The Full List of What Satellite Imagery Actually Does
On this page
- Every major use for satellite imagery, at a glance
- Types of satellite imagery, and what each is used for
- Farming, crops, and grazing land
- Mining and mineral exploration
- Disaster response and emergency management
- Insurance and claims verification
- Urban planning and government
- Infrastructure, energy, and pipelines
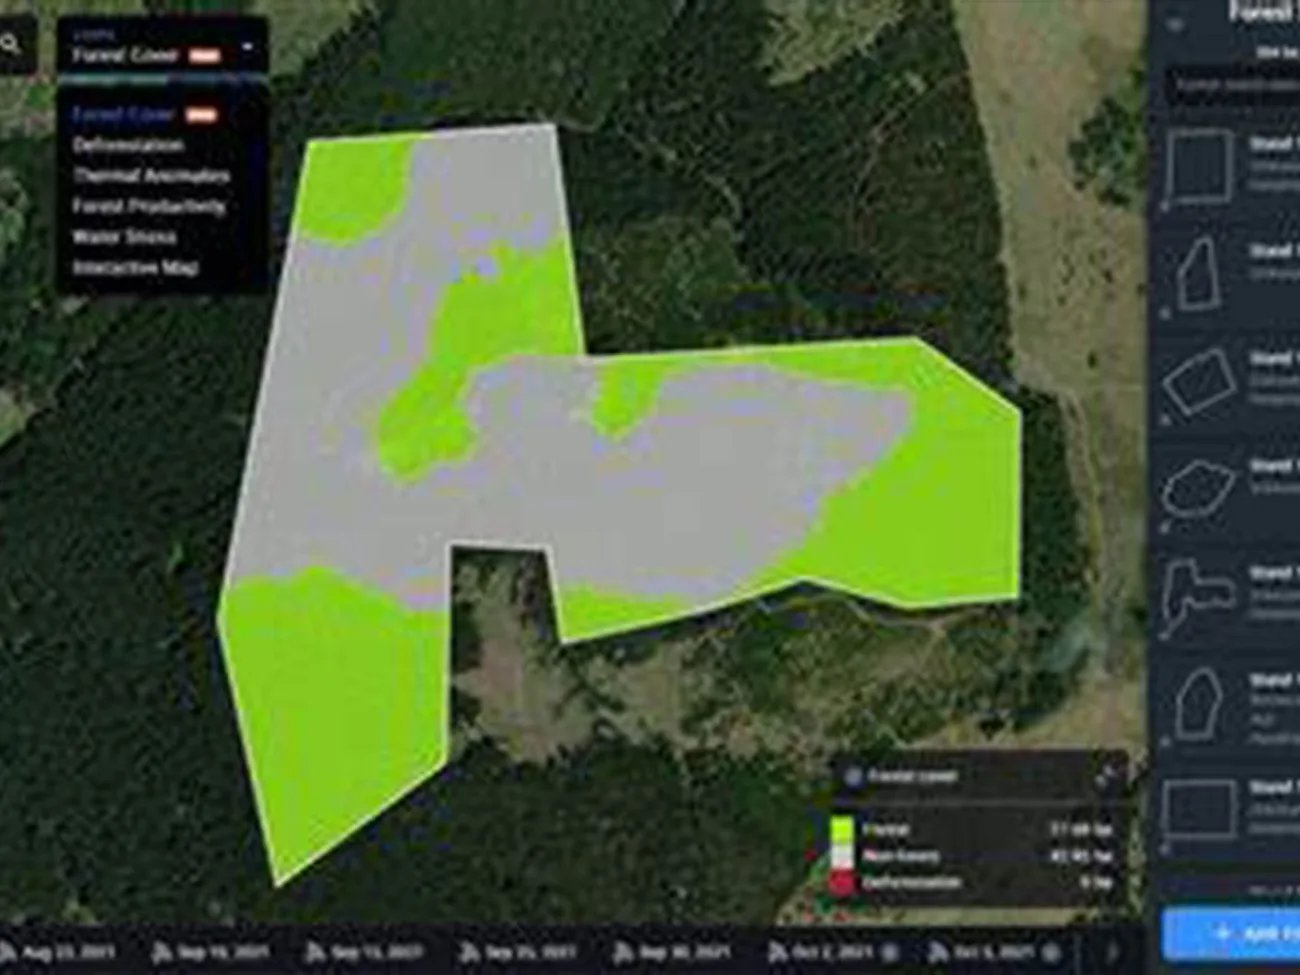
- Environmental monitoring and forestry
- Maritime and port monitoring
- Construction and real estate
- 3D mapping and digital twins
- Free vs. commercial imagery, by use case
- Who actually uses satellite imagery
- Where satellite imagery uses are expanding next
- Frequently asked questions
- Sources and further reading
A practical guide to what satellite images are used for across agriculture, mining, disaster response, insurance, infrastructure, and government, the resolution and sensor each job actually needs, and which satellites and price tiers apply to each one.
Quick answer
Satellite images are used to monitor crop health and irrigation, track mining pits and tailings dam deformation, map floods and wildfires within hours, verify insurance damage claims, catch illegal construction and plan cities, inspect pipelines and power corridors, track deforestation and water quality, monitor ports and vessels, audit construction sites, and build 3D terrain and city models. Optical imagery from 25 cm to 30 m resolution covers most of these jobs; SAR radar adds the all-weather, day-and-night coverage optical sensors can't provide. Free sources like Sentinel-2 and Landsat handle regional, 10 to 30 m-scale monitoring; commercial satellites take over wherever a use case needs sub-meter detail or guaranteed timing.
Every major use for satellite imagery, at a glance
| Industry | Primary use | Resolution needed | Sensor type |
|---|---|---|---|
| Farming and grazing land | Crop health, yield forecasting, irrigation, pasture and drought stress | 2–10 m, down to 50 cm for field-level stress | Optical multispectral (NDVI, NDRE) |
| Mining and exploration | Tailings dam deformation, mineral targeting, pit tracking | 25 cm–2 m optical, 30 m hyperspectral | Optical, InSAR, hyperspectral |
| Disaster response | Flood, fire, and storm damage mapping | 1–3 m SAR, 30 cm–2 m optical | SAR, optical, thermal |
| Insurance | Pre- and post-event damage verification | 25–50 cm | Optical, SAR in bad weather |
| Urban planning and government | Zoning, illegal construction, land-use compliance | 25 cm–10 m | Optical, InSAR |
| Infrastructure and energy | Pipeline and corridor encroachment, leak detection | 50 cm–1.5 m, 1–2 mm InSAR | Optical, InSAR, thermal |
| Environment and forestry | Deforestation, water quality, carbon tracking, volcano monitoring | 10–30 m, hyperspectral for species | Multispectral, hyperspectral, thermal |
| Maritime and ports | Vessel detection, dark-ship tracking, spill response | 1–16 m | SAR |
| Construction and real estate | Site progress tracking, due diligence | 25–50 cm | Optical, stereo |
| 3D mapping and digital twins | Elevation models, city-scale 3D models | 30 cm–2 m stereo | Stereo and tri-stereo optical |
Types of satellite imagery, and what each is used for
The industry use cases below draw on five underlying sensor types, each suited to a different job.
| Type | What it captures | Example applications |
|---|---|---|
| Optical / multispectral | Reflected visible and near-infrared light across a handful of bands, reading much like a photograph with extra color channels | Crop health, urban planning, environmental monitoring |
| Hyperspectral | Hundreds of narrow, contiguous bands across the same scene, fine enough to separate materials invisible to a standard camera | Mineral exploration, species mapping, precision agriculture |
| Thermal | Emitted heat rather than reflected light, so it works the same day or night | Wildfire hotspot detection, equipment heat-loss inspection, volcano monitoring |
| Radar (SAR) | Its own microwave pulse bounced off the surface, unaffected by cloud, smoke, or darkness | Flood mapping, ground deformation, disaster response |
| Stereo / tri-stereo optical | The same scene captured from two or three angles in a single pass | Digital elevation models, 3D city models, construction grading |
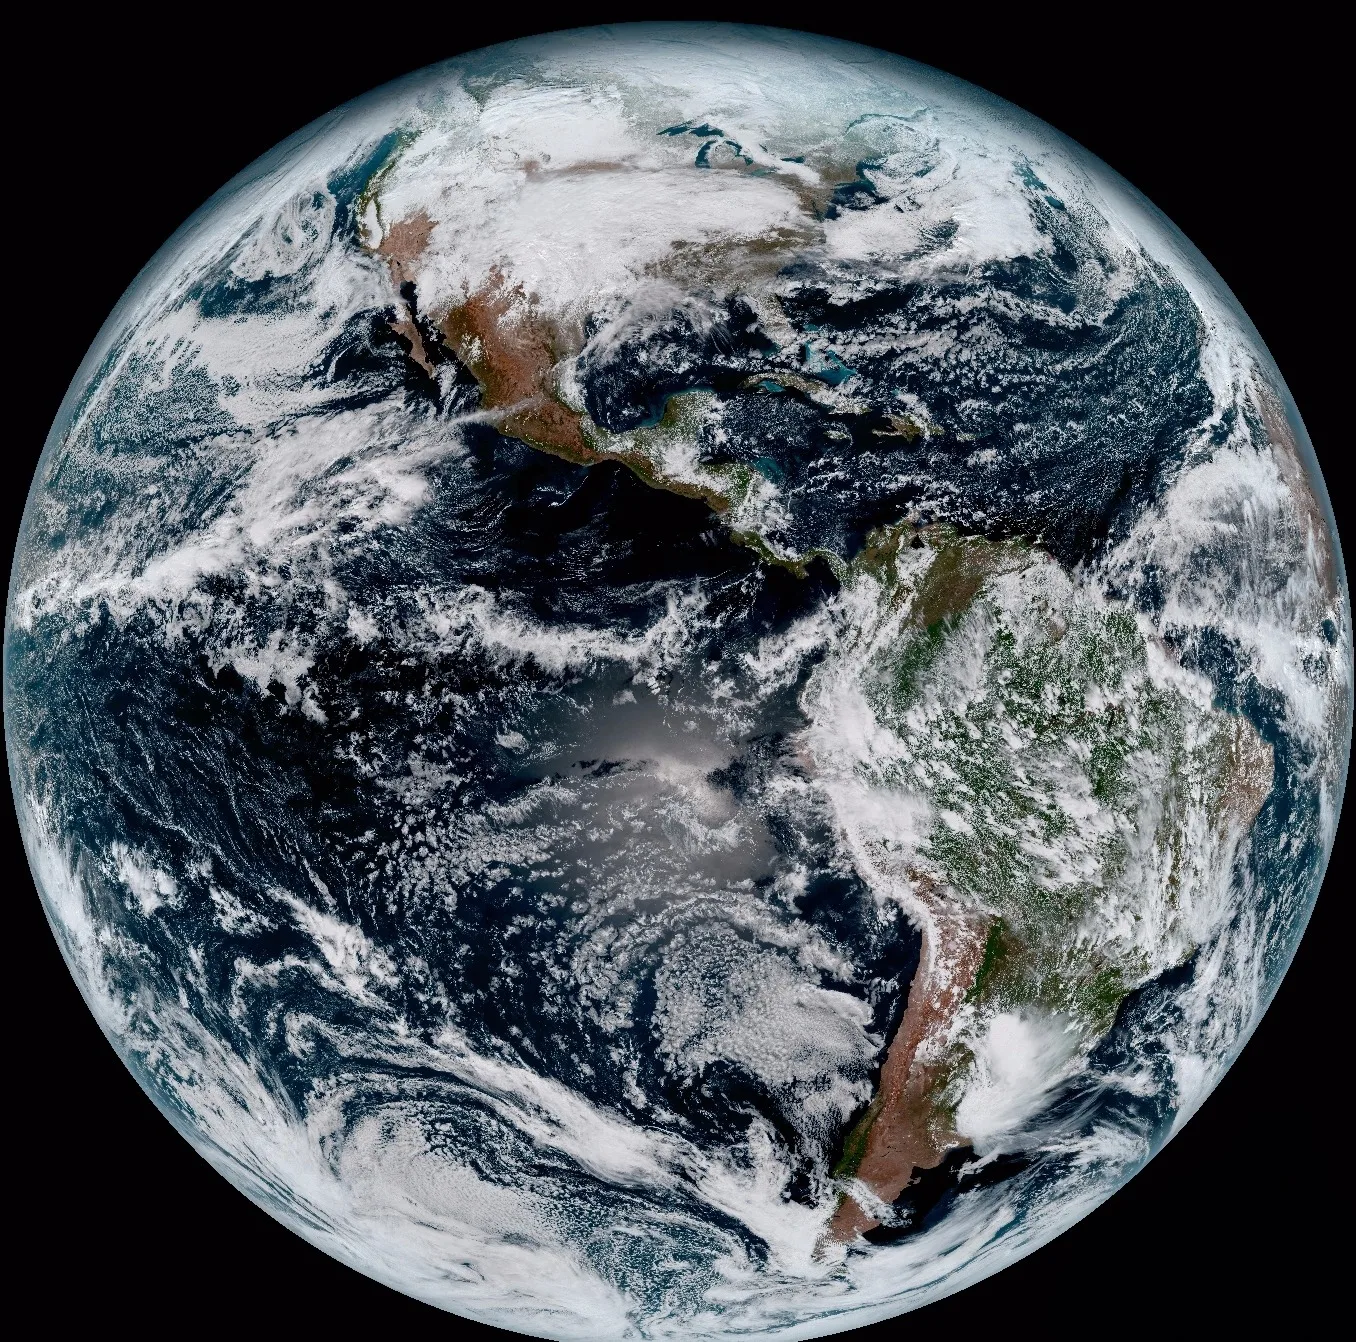
For the full taxonomy, including visible, infrared, water vapor, true color, and false color imagery with real examples of each, see our guide to real Earth images from space.
Farming, crops, and grazing land
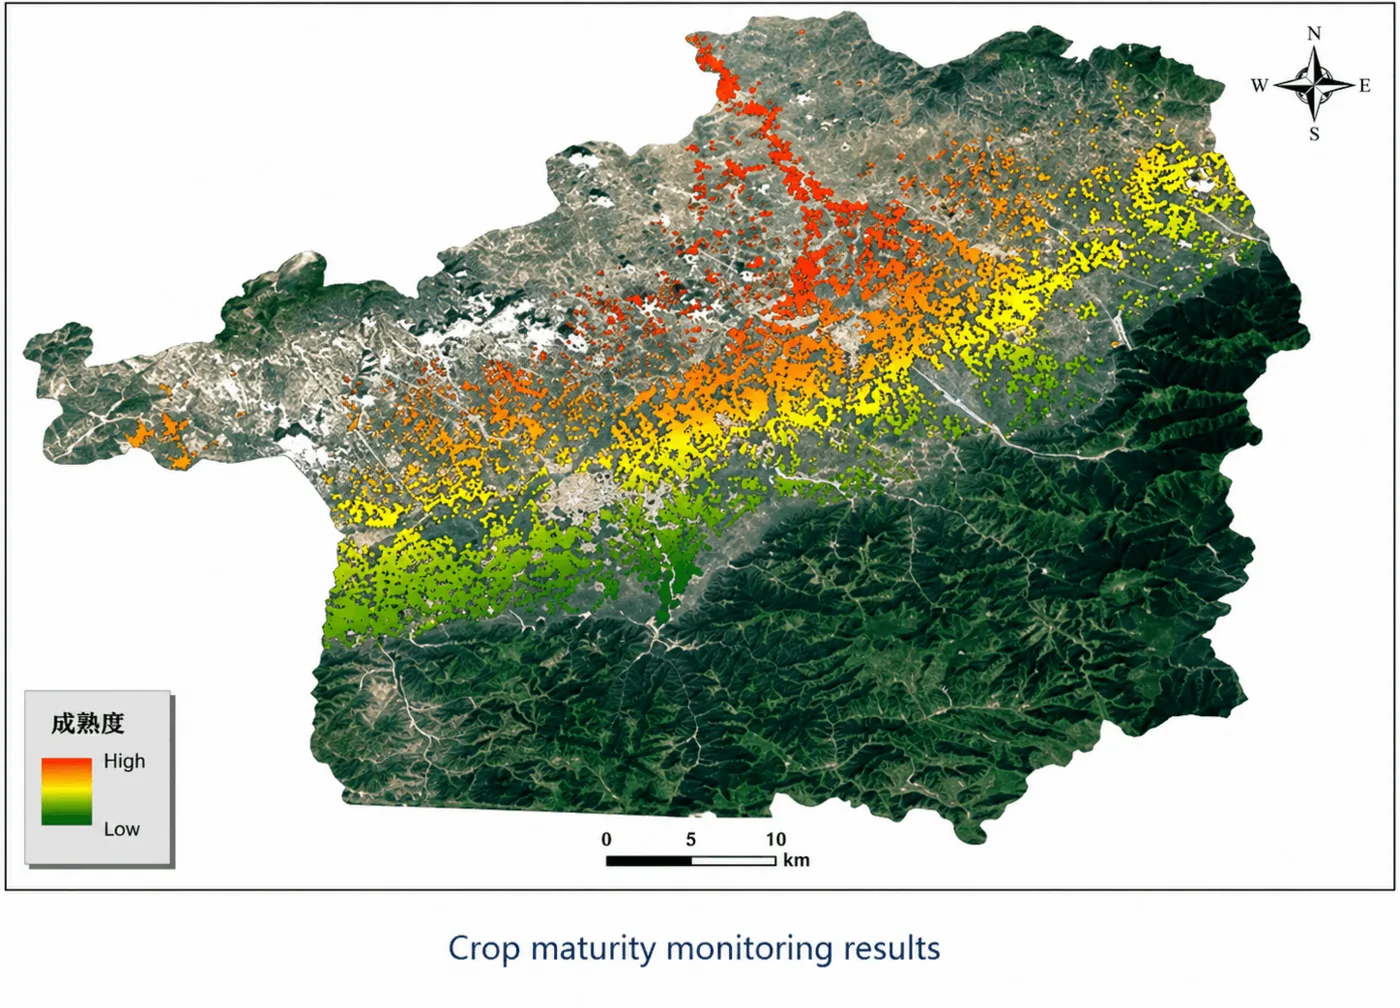
Multispectral satellite imagery tracks crop vigor, nitrogen deficiency, and water stress across a growing season using indices like NDVI, NDRE, and MSAVI, built from the red and near-infrared bands. Growers use it to schedule irrigation, flag pest or disease outbreaks before they spread, and forecast yield ahead of harvest. Variable-rate nitrogen application guided by vigor maps has cut input costs by up to 18%, and switching from blanket spraying to satellite-flagged pest zones has cut treated acreage by up to 60%. The same vegetation indices cover rangeland and pastoral operations, tracking pasture growth and flagging drought stress across grazing land too large to walk or drive in full. Full breakdown in our guide to precision agriculture satellite imagery, or see our agriculture solutions page.
Mining and mineral exploration
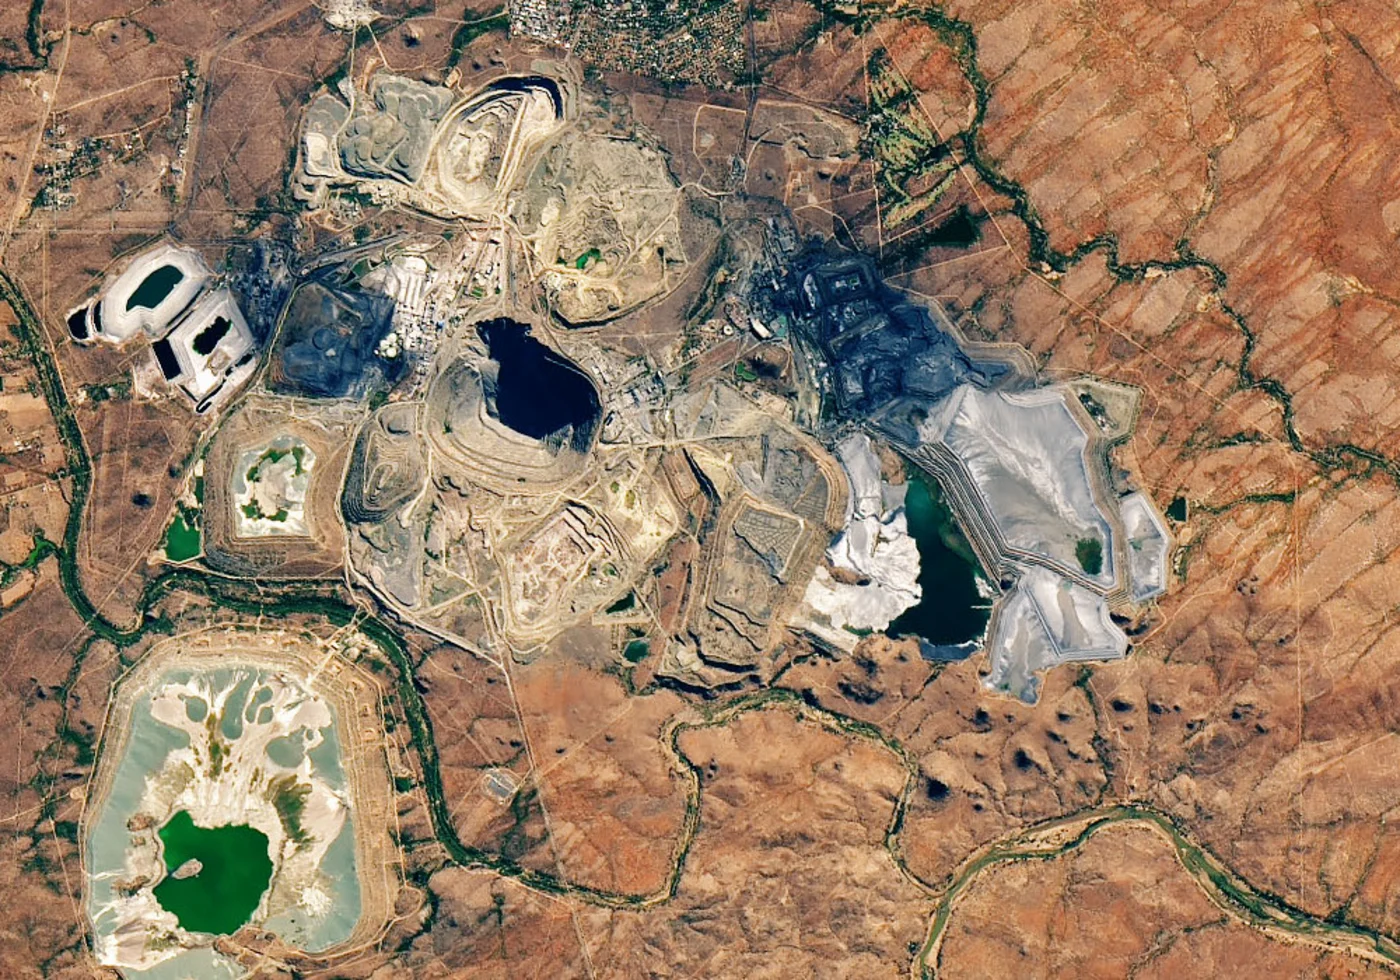
Satellite radar interferometry, or InSAR, resolves ground deformation down to 1 to 2 mm, precise enough to separate normal settlement from a developing tailings dam failure, a practice that became standard after the 2019 Brumadinho collapse released 11.7 million m³ of tailings. Over 80% of Extreme and Very High consequence tailings facilities now sit under continuous InSAR monitoring. On the exploration side, hyperspectral sensors flag mineral alteration signatures before any ground crew sets foot on site, turning around a ranked drill-target report in 2 to 3 days for a concession under 100 km². See our guides to how satellites monitor mining and hyperspectral mineral exploration, or the mining solutions page.
Disaster response and emergency management
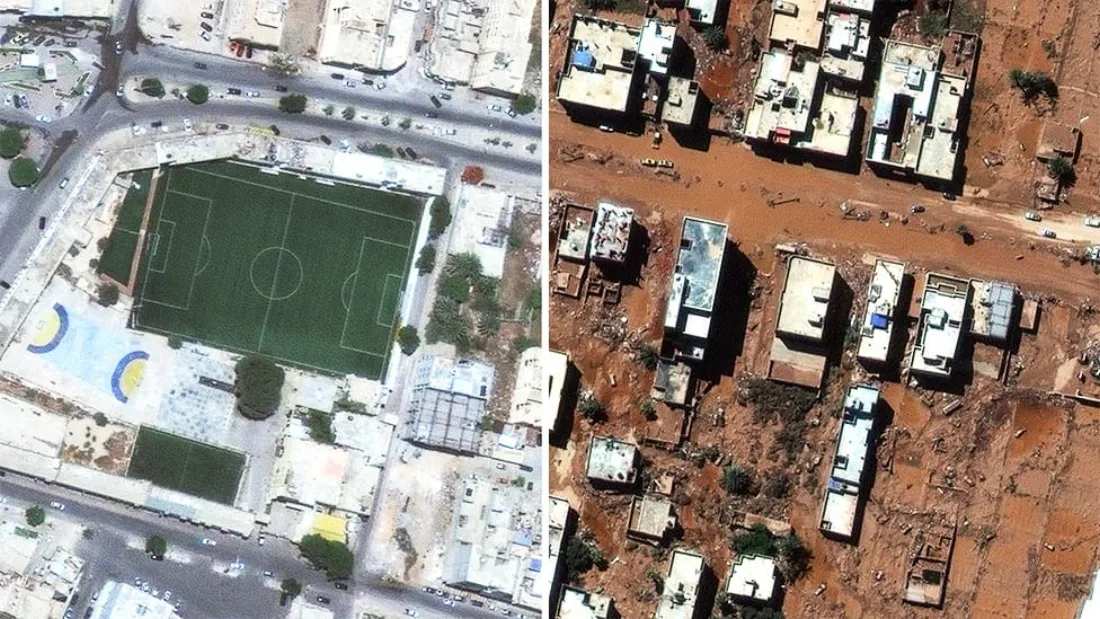
Satellite-based SAR radar sends its own microwave signal instead of relying on sunlight, so it keeps producing usable imagery through cloud, smoke, rain, and total darkness, the exact conditions a flood, wildfire, or hurricane creates. Response teams use it to map flood extent, trace wildfire boundaries, track oil spills, and watch slope or dam deformation, often within hours of a tasking request, with optical imagery following once skies clear to confirm damage at the building level. Thermal sensors add a fourth layer, geostationary platforms like GF-4 re-image the same wildfire front every 20 seconds, catching a new hotspot or flare-up long before it shows up in visible light. Full detail in our guide to SAR for disaster response.
Insurance and claims verification
Insurers compare pre-loss and post-event satellite imagery to confirm whether damage occurred inside the policy window, measure the extent of flood, wildfire, or storm damage, and flag unauthorized construction before underwriting a policy. Optical imagery down to 30 cm documents visible destruction; SAR keeps the evidence flowing during active weather. Pairing pre- and post-event NDVI with a claim turns a manual field inspection into a desk review roughly 3x faster, and in regions with no reliable historical yield records, satellite-based crop-risk underwriting already covers millions of smallholder farmers through programs like ACRE Africa and the WFP-backed R4 Rural Resilience Initiative. See our guides to satellite imagery as insurance evidence and satellite data for crop risk underwriting.

Urban planning and government
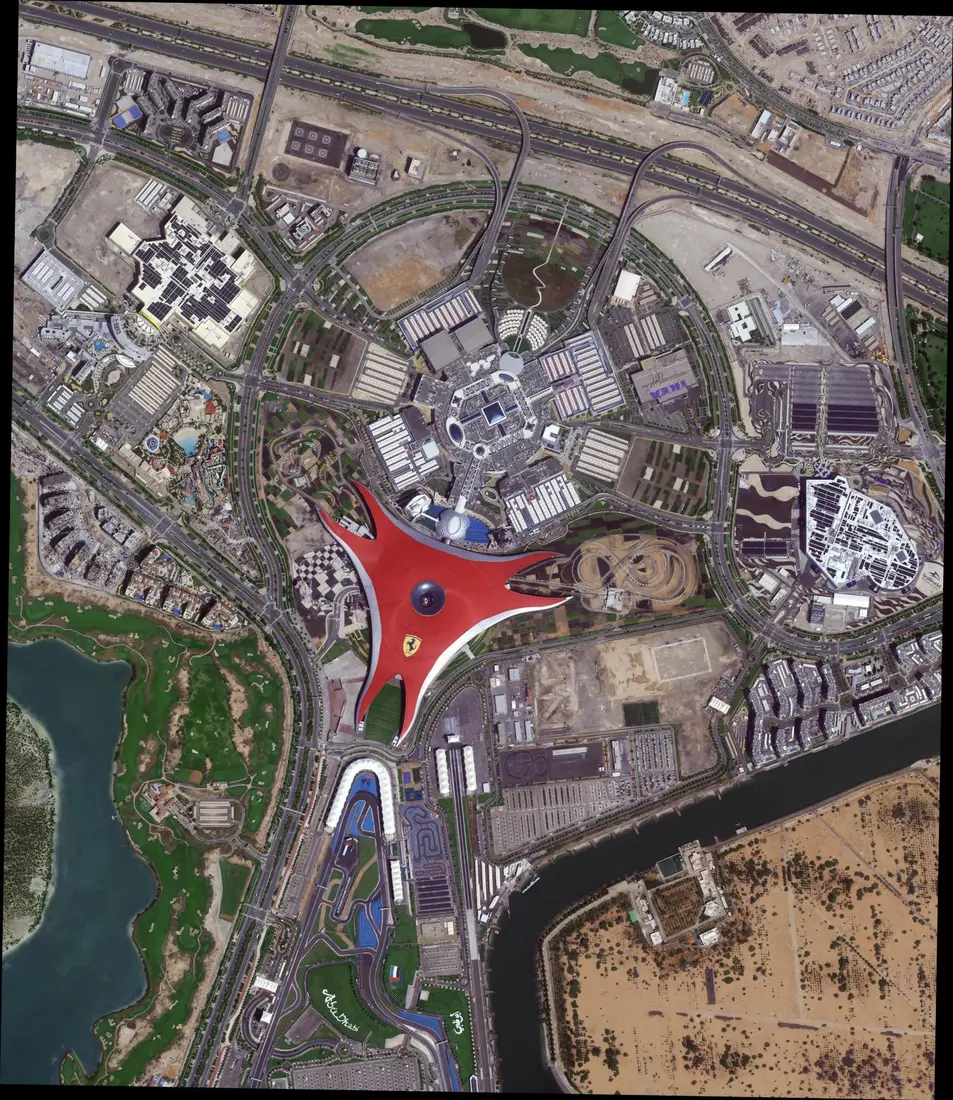
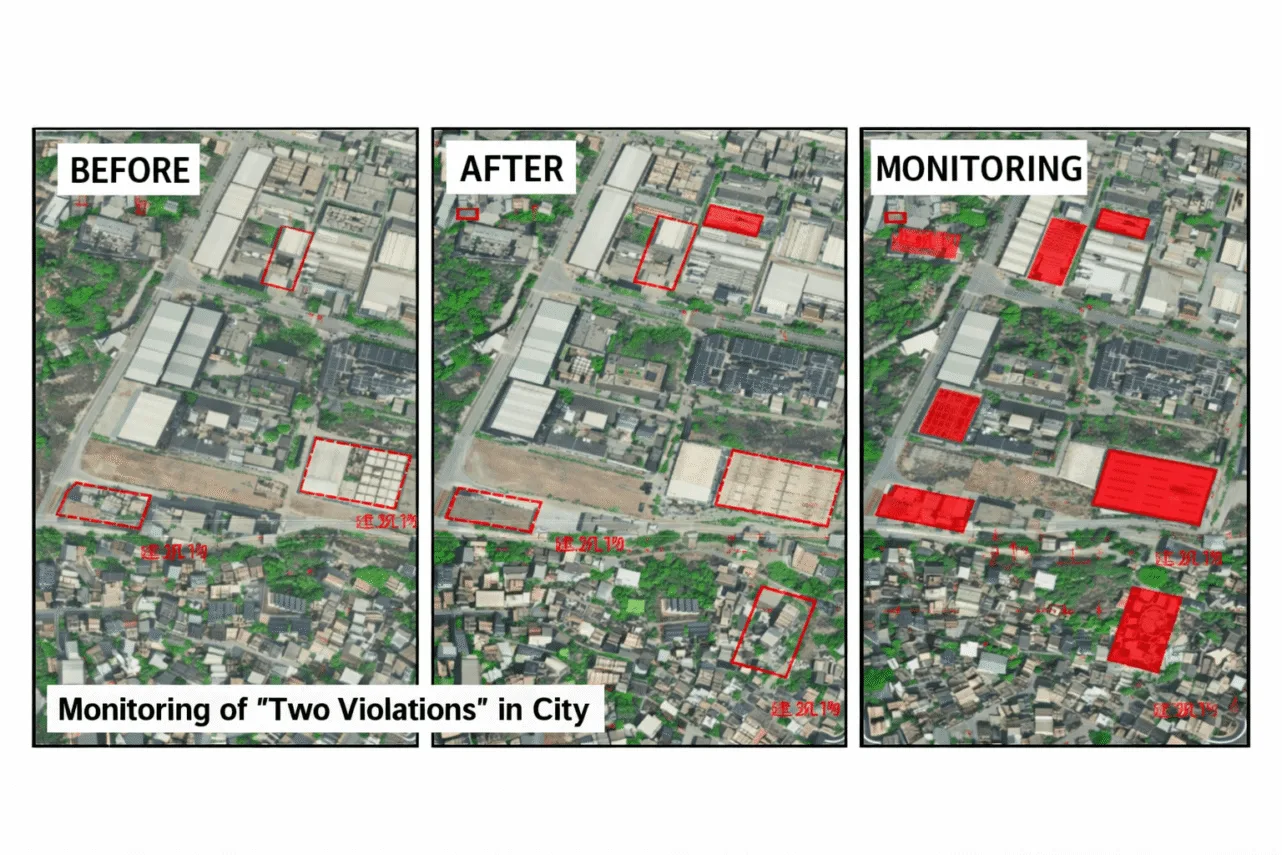
Municipal and national agencies run wide-area satellite imagery mosaics to track land-use compliance, and AI-assisted change detection compares multi-temporal scenes to extract new building footprints and flag construction that never got a permit. Optical satellites down to 25 cm capture the horizontal sprawl; InSAR measures vertical ground and structural movement as small as 1 to 2 mm, together giving planners a continuous record of how a city is actually changing rather than a redrawn map months after the fact. The same wide-area imagery also feeds greenfield site selection for new roads and suburbs, floodplain mapping ahead of a rezoning decision, and the national carbon-accounting and climate-reporting datasets governments file under emissions treaties. Full detail in our guide to change detection for urban growth.
Infrastructure, energy, and pipelines
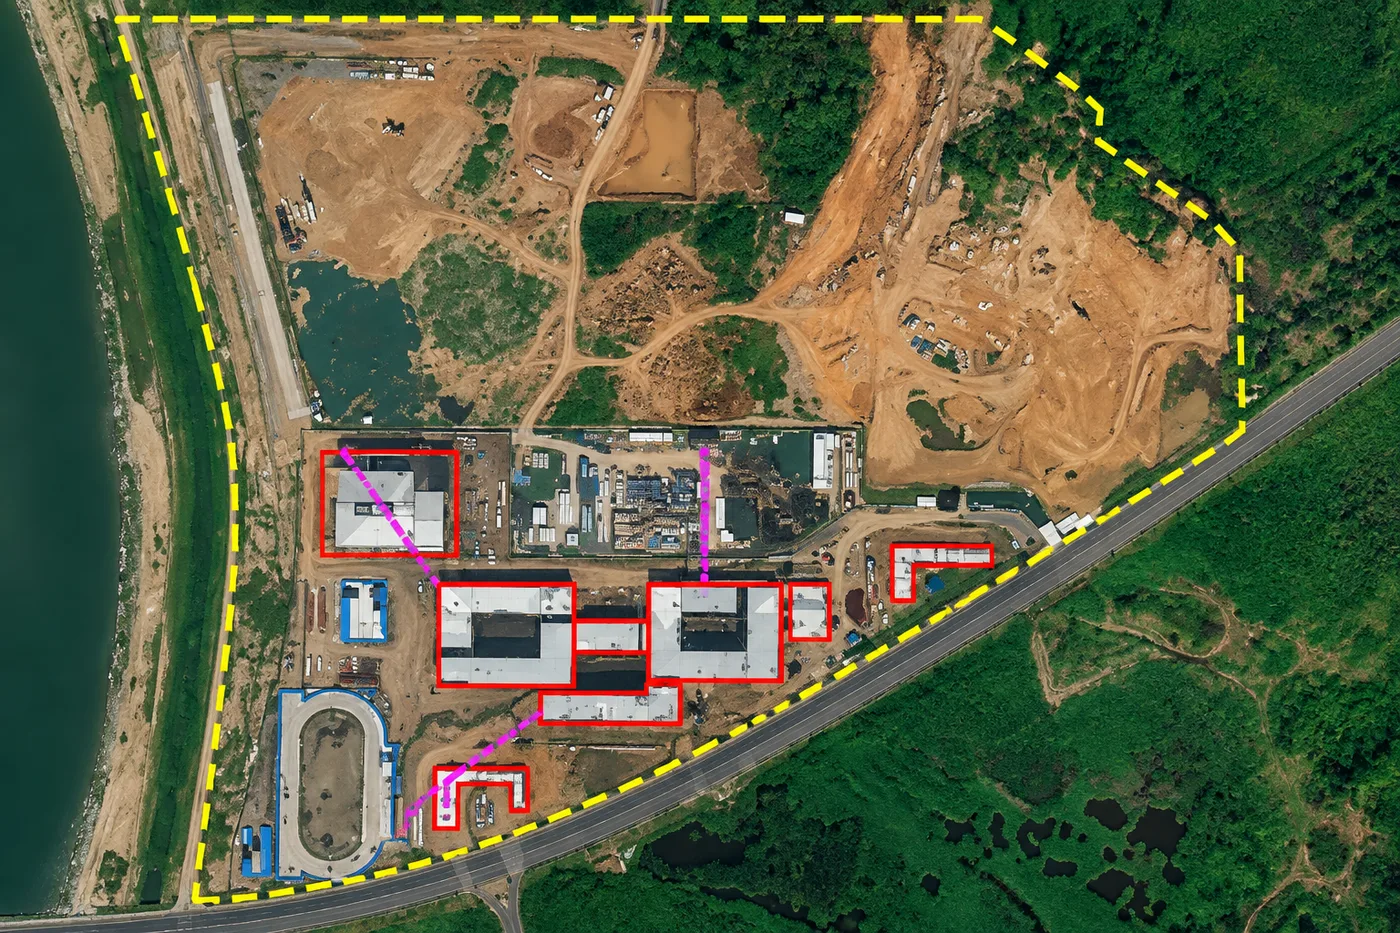
A pipeline or transmission corridor is long, exposed, and rarely staffed, so operators lean on satellite imagery at 50 cm to 1.5 m to catch encroachment and vegetation growth along the full route, backed by InSAR resolving ground movement to 1 to 2 mm around valves, compressor stations, and river crossings. The stakes are real, US pipelines logged an average of 265 significant incidents a year from 2014 through 2024, and UNEP's satellite-based MARS alert system has already flagged over 10,000 methane plumes from oil and gas activity worldwide, including releases on the scale of the 109,000-ton Aliso Canyon leak. Thermal infrared sensors such as GF-5B's VIMS payload add equipment-level fault detection, flagging a compressor or valve running hotter than normal before it fails. See our guide to oil and gas pipeline monitoring or the oil and gas solutions page.
Environmental monitoring and forestry
Multispectral and hyperspectral satellite sensors measure how foliage reflects light across the Red Edge and near-infrared bands to catch chlorophyll loss and early disease or pest stress before it's visible to the eye, feeding vegetation indices like NDVI, NDRE, and LAI. The same sensors detect illegal logging and deforestation in near real time, track active fire fronts and burn severity, map species composition, and measure biomass for carbon-credit accounting. Coastal and inland water bodies get the same treatment for algae blooms, turbidity, and shoreline erosion over decades, not a single capture. Thermal bands extend the same monitoring to volcanoes and geothermal fields, tracking a rising lava lake or vent temperature for early eruption warning. Full detail in our guide to forestry canopy monitoring.
Maritime and port monitoring
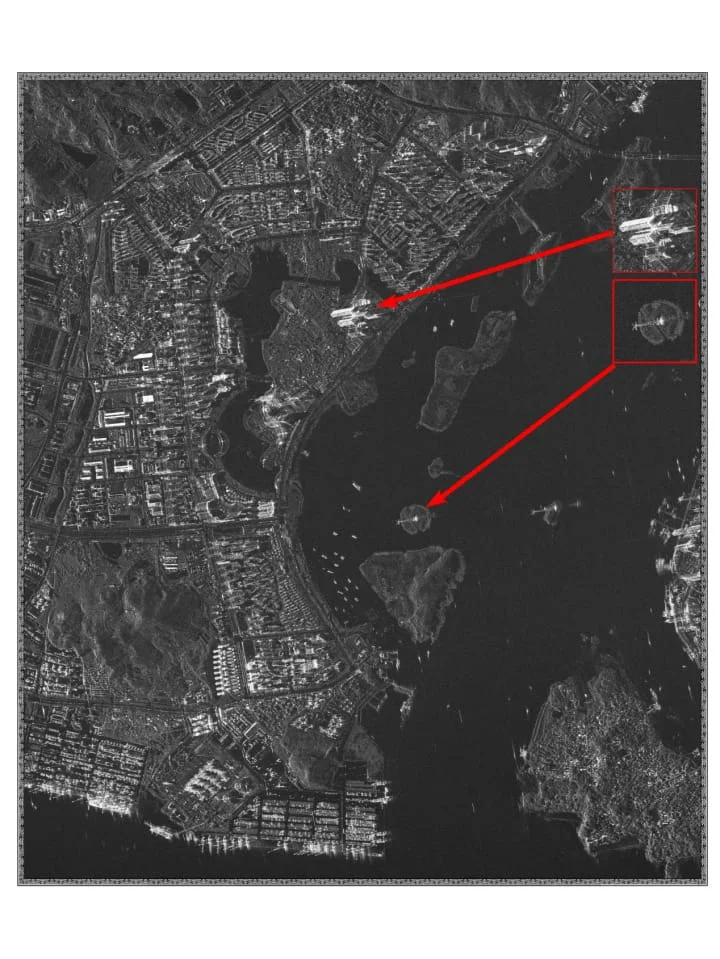
SAR satellites like GF-3 detect vessels regardless of weather or daylight, including ships that have switched off their AIS transponder to avoid tracking, a core tool for anti-smuggling, illegal fishing, and sanctions enforcement. Ports and coast guards use the same radar backscatter for routine traffic monitoring, oil-spill detection, and tracking vessel congestion at anchorages and terminals.
Construction and real estate
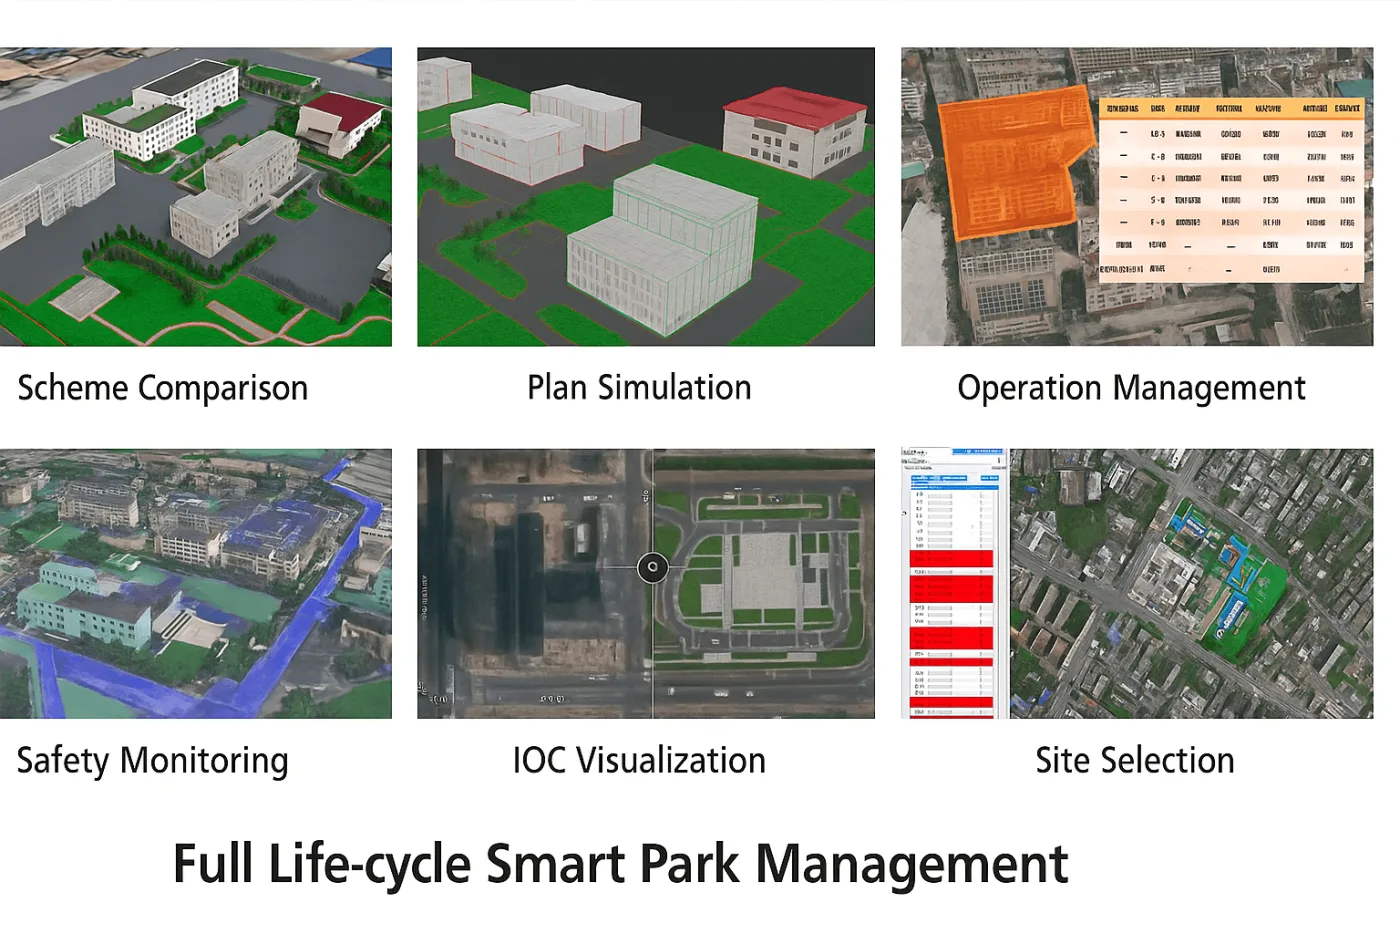
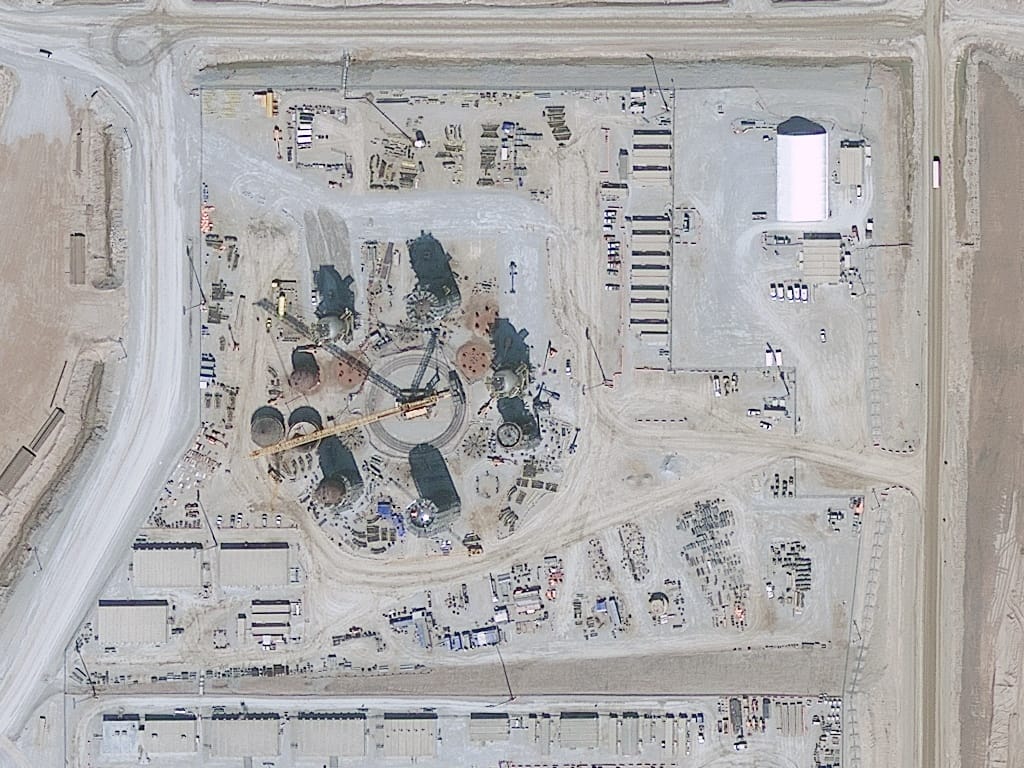
Developers and lenders use 25 to 50 cm satellite imagery to verify construction progress against a payment schedule without a site visit, confirm a property's condition before acquisition, and monitor a portfolio of sites from one desk instead of sending a surveyor to each one. Stereo and tri-stereo tasking adds elevation data on the same pass, useful for grading and drainage checks before and during a build.
3D mapping and digital twins
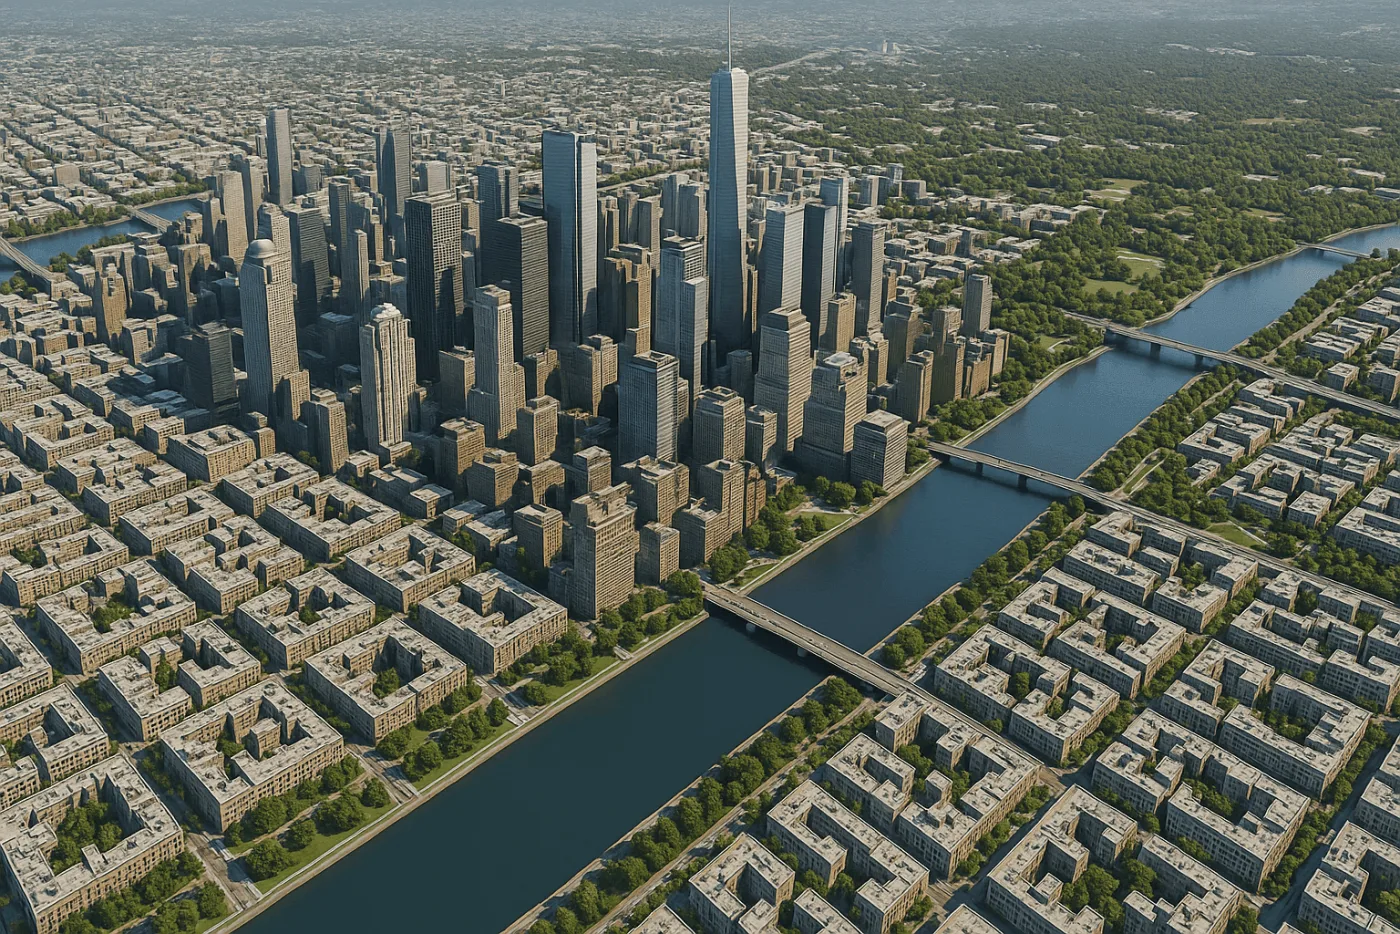
Stereo and tri-stereo satellite tasking captures the same scene from two or three angles in one pass, enough to extract elevation data and build a digital surface model without a separate LiDAR flight. That feeds photorealistic 3D city models used for urban digital twins, line-of-sight and viewshed analysis, flood and drainage modeling, and telecom network planning, at roughly 2x the cost of a standard mono capture for stereo and 3x for tri-stereo. Full detail in our guide to 3D models from stereo imagery.
Need imagery for one of these use cases?
Search free Sentinel-2 and Landsat archives for regional monitoring, or task commercial optical, SAR, and stereo imagery down to 25 cm for the use cases above.
Free vs. commercial imagery, by use case
Not every use case on this page needs a paid tasking order. Free sources cover regional, slow-changing analysis; commercial tiers take over once a use case needs sub-meter detail, a guaranteed capture date, or all-weather radar.
| Use case | Free imagery (Sentinel-2, Landsat) | Typical commercial price tier |
|---|---|---|
| Regional land cover, long-term environmental trend | Sufficient | Rarely needed |
| Field-level crop stress, irrigation zoning | Partial, catches broad stress only | $1–2/km² (2–16 m tier) |
| Tailings dam or pipeline deformation | Not sufficient, needs InSAR precision | Custom SAR quote |
| Insurance claim or construction-progress verification | Not sufficient | $5–30/km² (sub-meter tiers) |
| Illegal construction, parcel-level zoning | Not sufficient | $13–30/km² |
| Disaster first-look vs. building-level damage | Sufficient for scale, first pass | $5–30/km² for building-level follow-up |
For the full list of no-cost sources and what each one actually covers, see our guide to free satellite imagery sources. For picking the exact tier a project needs, see choosing the right satellite resolution.
Who actually uses satellite imagery
- Agronomists and farm managers. Crop stress maps, irrigation schedules, yield forecasts.
- Mining geologists and ESG teams. Tailings deformation monitoring, drill-target prospectivity, reclamation tracking.
- Emergency management agencies and NGOs. Flood, fire, and storm damage mapping within hours of an event.
- Insurance underwriters and claims adjusters. Pre- and post-event damage verification, crop-yield underwriting where ground records don't exist.
- Urban planners and government land-use departments. Zoning enforcement, illegal construction detection, compliance mosaics.
- Pipeline and utility engineers. Corridor encroachment screening, leak and methane plume detection.
- Environmental scientists and conservation NGOs. Deforestation alerts, species mapping, carbon-credit verification.
- Port authorities and maritime security agencies. Vessel tracking, dark-ship detection, spill response.
- GIS analysts and surveyors. Digital elevation models, 3D city models, telecom and network planning.
- Real estate developers and lenders. Construction progress verification, acquisition due diligence.
Satellite imagery capability, in numbers, 2026
Dedicated Earth observation satellites currently in orbit, across weather, optical, and radar missions.
Revisit frequency of large commercial constellations, which image the entire Earth's landmass roughly once a day at 3 to 5 m resolution.
Ground deformation precision from InSAR radar, the basis for tailings, pipeline, and urban subsidence monitoring.
Commercial price range spanning wide-swath 2 to 16 m archive imagery up to new-tasked 25 cm super high resolution.
Where satellite imagery uses are expanding next
- Shorter revisit times. Smallsat constellations keep growing the ~322-satellite Earth observation fleet, pushing more locations from a weekly pass toward a daily one, which turns a seasonal check into an early warning system.
- AI turning captures into alerts, not just pictures. AI land-use and change-detection models already run above 90% accuracy, replacing manual image review with an automatic flag the moment a tailings dam shifts, a wildfire starts, or an unpermitted structure goes up.
- Sharper resolution reaching the open market. US licensing rules eased in 2023, and the newest commercial satellites now sell imagery down to 10 cm, finer than the 25 to 30 cm that was the practical ceiling for most of the past decade.
- No broker required. Archive search, tasking, and delivery that once needed a specialist middleman now run through a self-serve portal, cutting the time from "I need imagery of this site" to a finished dataset from weeks to minutes.
- More free data, not less. Copernicus and Landsat keep extending their open archives, so the regional-scale baseline available at no cost keeps growing even as commercial tiers push resolution finer.
Key takeaways
- Satellite images are used across agriculture, mining, disaster response, insurance, urban planning, infrastructure, environmental monitoring, maritime security, construction, and 3D mapping, each with its own resolution and sensor requirement.
- Optical imagery from 25 cm to 30 m covers most monitoring jobs; SAR radar is the only option that works through cloud, smoke, and darkness.
- Free sources like Sentinel-2 and Landsat are sufficient for regional, 10 to 30 m-scale monitoring; commercial satellites are required for sub-meter detail, a guaranteed capture date, or InSAR-grade deformation precision.
- InSAR radar's 1 to 2 mm deformation precision underpins tailings dam safety, pipeline corridor monitoring, and urban subsidence tracking across completely different industries.
- Commercial pricing runs from about $1/km² for wide-swath archive data up to $30/km² for new-tasked super high resolution imagery, so the cost scales with how fine a resolution the use case actually requires.
Frequently asked questions
What are satellite images used for?
Satellite images are used to monitor crop health and irrigation, track mining pits and tailings dam deformation, map floods and wildfires, verify insurance damage claims, catch illegal construction, inspect pipelines and power corridors, track deforestation and water quality, monitor ports and vessels, audit construction sites, and build 3D terrain and city models.
What industries use satellite imagery?
Agriculture, mining, insurance, government and urban planning, energy and pipelines, environmental science, maritime and port security, construction and real estate, and surveying and 3D mapping all use satellite imagery as a standard monitoring tool today.
Is satellite imagery free or does it cost money?
Both. Sentinel-2 and Landsat provide free imagery at 10 to 30 m resolution, enough for regional land cover and long-term environmental trends. Commercial satellites charge roughly $1 to $30 per square kilometer depending on resolution, required for sub-meter detail, guaranteed capture dates, or radar deformation monitoring.
Who actually uses satellite images?
Agronomists, mining geologists, emergency management agencies, insurance underwriters, urban planners, pipeline engineers, environmental scientists, port authorities, GIS analysts, and real estate developers all use satellite imagery directly in their day-to-day work.
What resolution satellite image do I need?
It depends on the target. Regional land cover and environmental trends need only 10 to 30 m. Crop fields and forest blocks need 2 to 10 m. Vehicles, buildings, and construction detail need 25 to 50 cm. Ground or structural deformation needs InSAR radar rather than optical resolution at all.
Can satellite imagery see through clouds?
Optical satellite imagery cannot, since it depends on reflected sunlight that clouds block. Synthetic Aperture Radar (SAR) satellites generate their own microwave signal and produce usable imagery through cloud, smoke, rain, and total darkness.
How often are satellite images updated?
It depends on the satellite. Large commercial constellations image the entire Earth's landmass roughly once a day at 3 to 5 m resolution. Free sources like Sentinel-2 revisit every 5 days at the equator. Tasked commercial satellites can be scheduled for a specific date, often within 24 to 48 hours of a request.
What is the difference between satellite imagery and aerial photography?
Satellite imagery covers far wider areas in a single pass and includes a continuous historical archive, while aerial photography from aircraft or drones currently resolves slightly finer detail over a smaller area. Full comparison, including cost and when to use each, is in our aerial photography vs satellite imagery guide.
Sources and further reading
- ICMM: 2025 Global Tailings Portal and Tailings Progress Report
- PHMSA: US pipeline significant incident statistics, 2014–2024
- UNEP: Methane Alert and Response System (MARS) satellite detection data
- Industry satellite trackers: active Earth observation satellite counts and constellation revisit rates, 2026
- NOAA Office of Space Commerce: commercial remote sensing licensing rule changes, 2020 and 2023
- XRTech Group: satellite fleet specifications and commercial pricing tiers, 2026
For what satellite imagery actually is and how it's captured, see our guide to what satellite imagery is and how it works.
Every use case above comes down to the same shift, a question that used to need a site visit, a survey crew, or a guess now gets answered from an image instead.
Have a specific use case in mind?
Tell us the industry and the area, and we'll match it to the right resolution, sensor, and price tier, archive or new tasking.