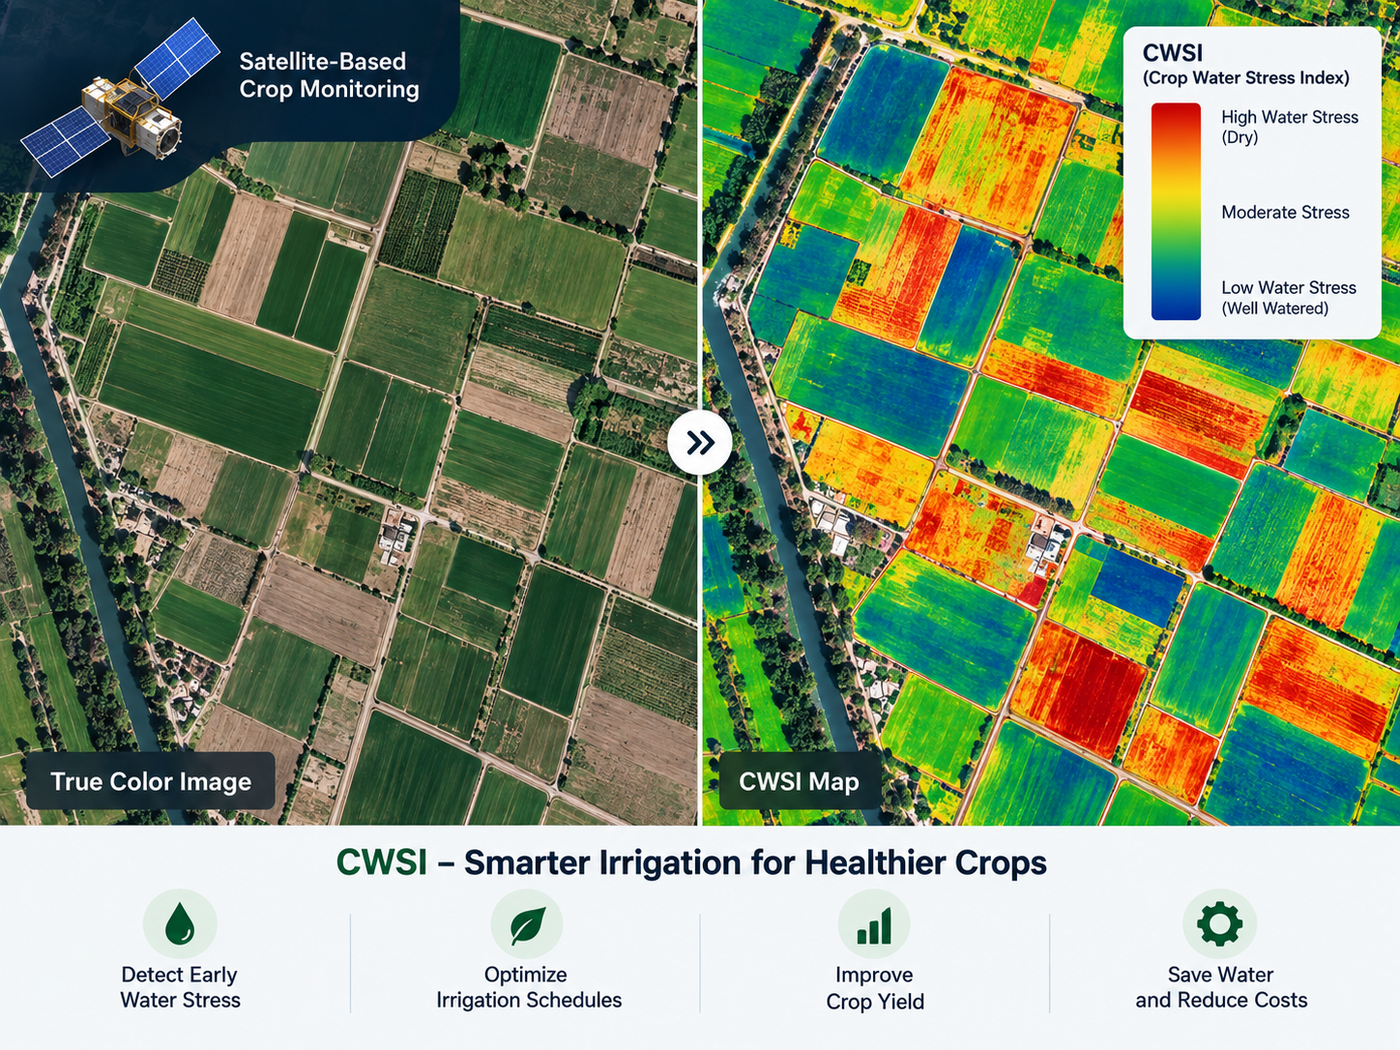
Agriculture Satellite Imagery for Crop Monitoring & Precision Farming
Satellite imagery is used across agriculture to monitor crop growth, field conditions, and vegetation health throughout the growing season. High-resolution and multispectral satellite images for farming help farmers and agronomists identify crop stress, track planting area, assess soil moisture, and make more informed irrigation, fertilization, and harvest decisions.
We provide agriculture satellite imagery, agricultural imaging services, and the analytics built on top of both, on a single platform. Our high-resolution multispectral imagery, built specifically for agriculture, lets you search or task optical, multispectral, and radar captures over your own fields, then turn that imagery and data into crop-health reports and prescription maps spanning pre-plow land assessment, in-season growth management, and harvest yield estimation.
What is agriculture satellite imagery?
Agriculture satellite imagery is satellite-based Earth observation data used to monitor farmland, crop growth, vegetation health, soil and moisture conditions, planting patterns, and other field characteristics over time. Multispectral and high-resolution images let farmers and agronomists compare a field against itself from one week to the next, instead of relying only on physical inspections.
How is satellite imagery used in agriculture?
Satellite imagery is used in agriculture to monitor crop growth, map fields and crop types, identify vegetation and water stress, assess soil and moisture conditions, detect early pest or disease pressure, estimate yield, and track land use across large farming regions. Comparing imagery captured on different dates helps agricultural teams spot the fields, or the parts of a field, that need closer inspection or a targeted intervention.
93%Staple crop classification accuracy
<2pxFarmland plot boundary accuracy
85%County-level yield estimation accuracy
0.3mNative resolution (SuperView Neo-1)
Crop Growth
Monitor Crop Growth Through the Season
Satellite imagery can monitor crop growth and development throughout the season. Comparing images captured at different dates reveals changes in vegetation vigor, crop establishment, growth stage, and areas where plants may be under stress, often before the difference is visible on the ground.
Before Planting — Field boundaries, cultivated land, and background soil conditions are mapped so every later image can be compared against a known baseline.
Early Season — Emergence, planting area, and crop establishment become visible as seedlings fill in the field.
Mid-Season — Vegetation vigor, water stress, and nutrient deficiencies show up as spectral differences across the field, often before they are visible to a ground scout.
Late Season — Maturity and harvest readiness can be tracked, feeding directly into yield estimation.
Examples
Farming Satellite Images
A sample of the imagery and derived maps agricultural teams work with, from field boundaries mapped before planting to vegetation-index maps used mid-season.
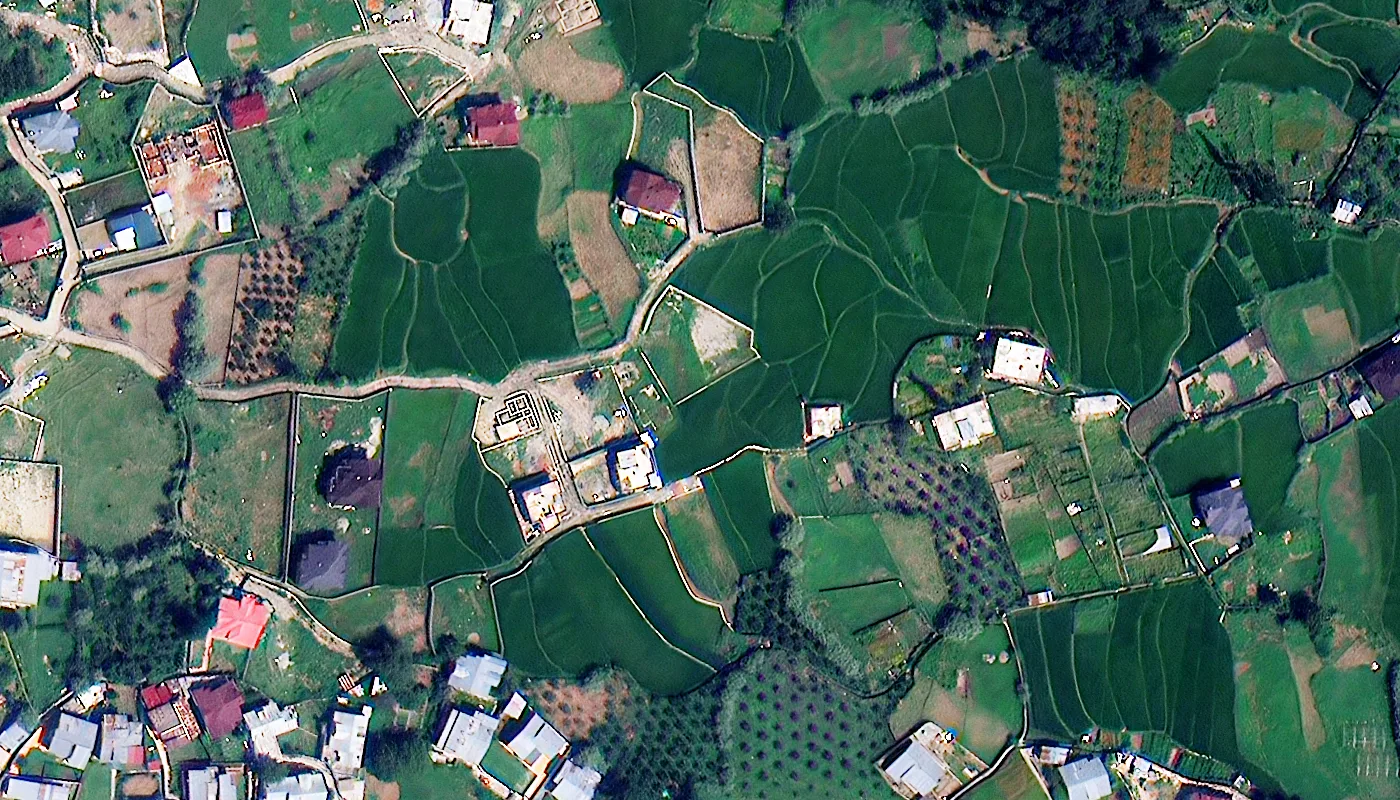
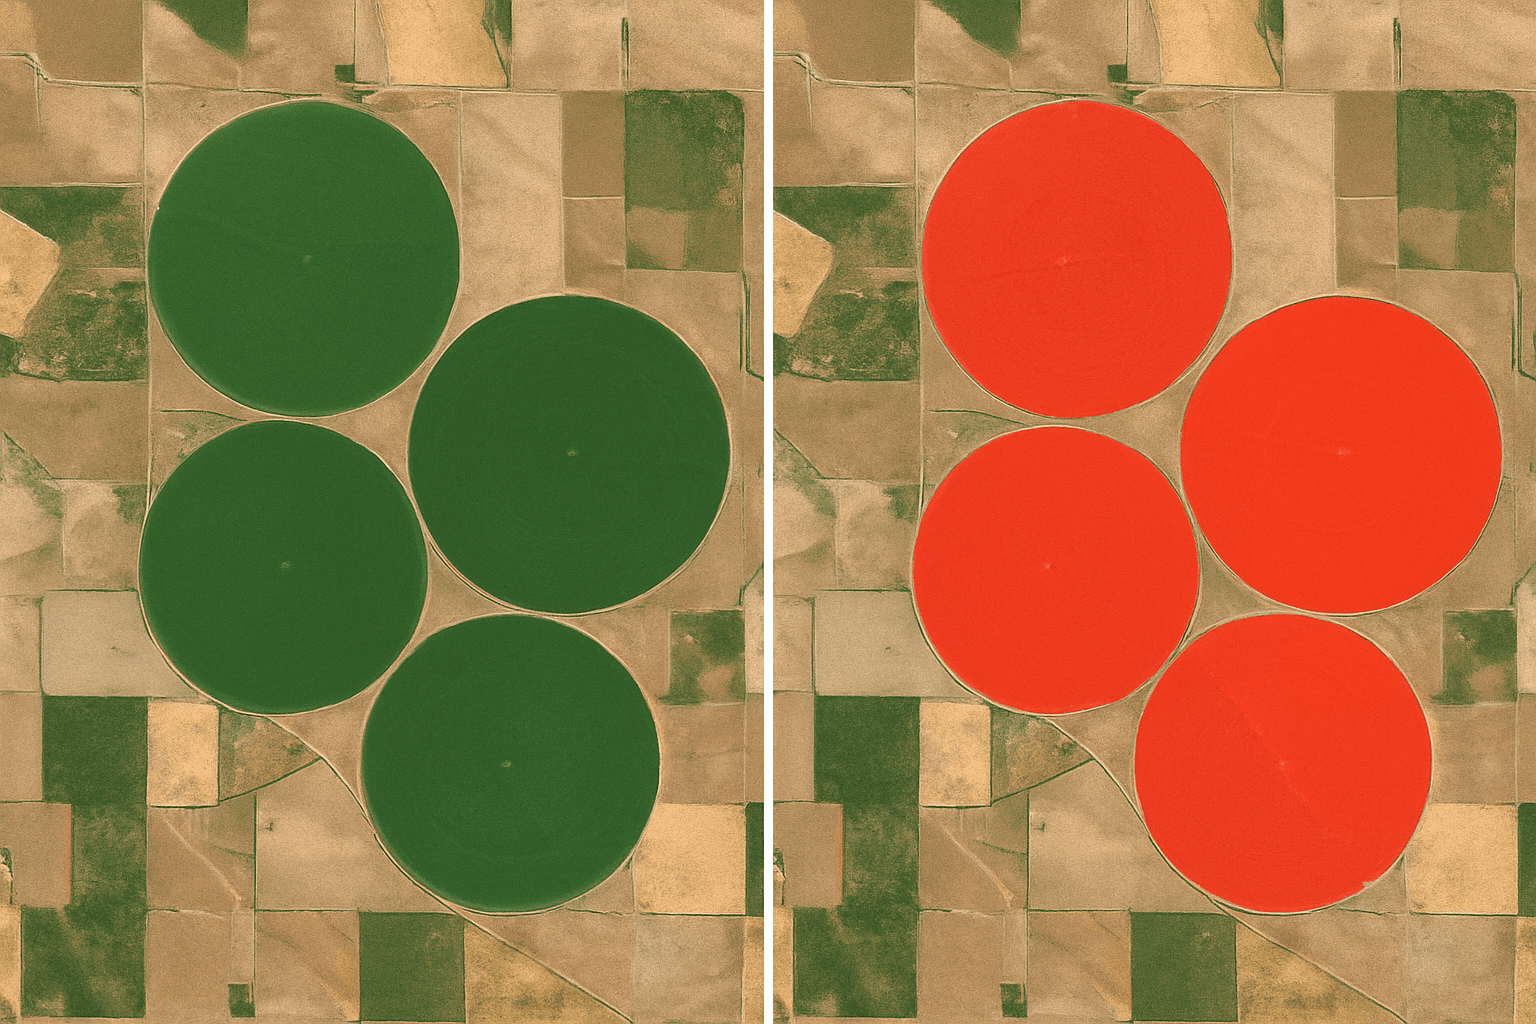
A GNDVI map converts raw satellite bands into chlorophyll and nitrogen variation across a field.A true satellite capture at 80cm resolution, sharp enough to resolve individual farm buildings and access roads.An EVI-derived classification map separates paddy field, corn, and bare land coverage across a region.Disease distribution and severity mapped from satellite imagery, pinpointing which fields need attention first.
Who It's For
Who Uses Agriculture Satellite Imagery?
The same imagery supports different decisions depending on who is looking at it.
Farmers & Farm Managers
Monitor crop health field by field and know exactly where to send a scout or a machine.
Agronomists
Use time-series imagery and vegetation indices to prioritize scouting instead of walking every field.
Agricultural Insurers
Assess crop damage across large areas with an independent record, without a ground visit to every plot.
Government & Agencies
Track cultivated land, crop types, and production across a region or country.
AgTech Companies
Integrate satellite imagery and derived agriculture data directly into a farm-management platform.
Solutions
Seven Ways We Support Every Stage of Farming
From pre-plow land assessment to harvest yield estimation, satellite imagery and the analytics built on it support every stage of the farming cycle.
AI plot extraction delineates individual farmland boundaries directly from satellite imagery, ahead of the planting season.
01 — SOLUTION
Pre-Plow Land & Farmland Boundary Assessment
Before the first pass of a plow, high-resolution classification and AI plot extraction establish a baseline of land quality and field boundaries.
Land Resources & Cultivated Land Quality: Remote sensing classification and spatial analysis monitor land-use type and evaluate cultivated land quality, supporting quantitative assessment of production potential and production-guidance decisions.
AI Farmland Plot Identification: A self-developed AI plot-extraction algorithm delineates farmland plot boundaries from medium- and high-resolution imagery, with boundary accuracy better than 2 pixels and plot identification accuracy above 90%.
Non-Agricultural Land Screening: The same plot data supports government monitoring of farmland converted to non-agricultural use before the planting season begins.
02 — SOLUTION
Crop Growth & Planting Area Monitoring
Once crops emerge, time-series satellite imagery tracks what was planted, where, and how it is growing, at field scale across an entire region.
Planting Area & Crop Type Mapping: Crop phenology analysis and time-series classification identify the spatial distribution of major plantings, with classification accuracy better than 93% for staple food crops and 85% for cash crops.
Non-Grain Land Conversion Detection: AI change detection flags farmland converted to forestland, fish ponds, vegetable greenhouses, or abandoned land, providing data support for regulatory oversight.
Recent Growth & Seedling Condition: A crop-growth parameter set built from medium- and high-resolution imagery macro-estimates seedling condition, growth stage, and distribution for production managers.
Daily-to-Weekly Revisit Options: Micro-satellite constellations can add daily high-resolution field updates on top of the core fleet, though actual frequency depends on the constellation, location, and cloud cover, and may run weekly or monthly instead.
03 — SOLUTION
Soil Moisture & Fertility Management
Spectral analysis of the soil surface itself, not just the crop canopy, guides irrigation and fertilization decisions before stress becomes visible.
Soil Moisture Monitoring: A soil-moisture inversion model built from spectral reflectance differences under varying water content tracks field-scale moisture, accurate to within 85% of ground measurements.
Soil Fertility & Nutrient Mapping: Spectral reflectance data is analyzed for physical and chemical soil properties to support fertilization planning, reaching over 90% accuracy on dry land and around 80% on paddy fields.
All-Weather Passive Microwave Sensing: Passive microwave and SAR-derived soil water, vegetation water content, and biomass data are unaffected by cloud cover, filling gaps optical-only monitoring leaves during monsoon or overcast stretches.
04 — SOLUTION
Pest, Disease & Meteorological Risk Monitoring
Spectral stress signatures and meteorological data combine to flag crop health risk before an outbreak or weather event causes irreversible loss.
Pest & Disease Risk Detection: A disease-diagnosis model combining optical greenness, SAR backscatter, temperature, irrigation, and planting-density data identifies disease presence and severity, exceeding 90% accuracy in tested scenarios.
Meteorological Disaster Early Warning: Multi-source meteorological satellite and observation data feed a disaster-risk analysis model, giving early warning of drought, flood, and other weather hazards to reduce crop loss.
05 — SOLUTION
Crop Maturity & Yield Estimation
As harvest approaches, satellite data shifts from monitoring growth to forecasting exactly how much a field will produce and when to bring in the crop.
Crop Maturity Monitoring: Comparing current accumulated temperature at a key phenological stage against the constant accumulated temperature a crop needs to mature determines harvest readiness.
County-Level Yield Estimation: Spectral inversion of crop growth indicators such as LAI and biomass, combined with a yield model and ground-measured data, delivers per-unit and total production figures with county-level accuracy better than 85%.
06 — SOLUTION
Digital Agriculture & Aerospace-Aviation-Ground Sensing
Satellite, aerial, and ground sensors combine into one intelligent monitoring network built for large-scale agricultural digitalization.
Integrated Communications & Remote Sensing: Communications, navigation, and remote-sensing satellites are integrated into a single sensing layer for agricultural monitoring at any scale.
Deep Learning Analysis: Deep-learning algorithms process aerospace, aviation, and ground sensor data together to intelligently analyze crop and environmental conditions.
07 — SOLUTION
Precision Input & Variable-Rate Prescription Zones
Multi-season satellite archives turn a uniform field into defined productivity zones, so every input dollar goes where it earns a return.
Smart Farming Zone Definition: Historical multi-season satellite archives are analyzed to divide fields into productivity zones based on soil and yield trends.
Variable-Rate Prescription Maps: Zone data generates machinery-ready prescription maps for variable-rate seeding and fertilization, cutting input costs in low-yielding zones without cutting yield.
Individual Plant & Tree Counting: AI object detection counts individual trees or plants in orchards and vineyards to assess stand density and flag replanting needs.
Imagery Types
What Type of Satellite Imagery Is Best for Agriculture?
Different sensor types answer different farming questions, and most agriculture programs end up combining more than one.
Imagery Type
What It Reveals
Best For
Multispectral
Red-edge and near-infrared reflectance beyond what the eye sees
Vegetation health, NDVI/NDRE, crop classification
High-Resolution Optical
Sharp, true-color detail down to individual plots
Field boundaries, plant counting, infrastructure
SAR (Radar)
Surface structure and moisture, regardless of cloud cover
All-weather monitoring, soil moisture, cloudy regions
NDRE chlorophyll analysis, vegetation and forestry monitoring
Wide-Swath Regional
GF-6 (800km swath), GF-1, GF-4
2m – 50m
Regional planting-area surveys, non-grain land monitoring
Infrared & Multispectral Scanning
CBERS-04 / 04A (IRS, WFI)
Medium resolution
Water resource surveys, long-term yield estimation
Vegetation & Soil Indices
Key Agriculture Vegetation Indices
NDVI and the vegetation and chlorophyll indices derived from it, first developed from NASA and USGS Landsat research, remain the standard way to turn raw satellite bands into a number a farmer can act on.
Index
Full Name
What It Measures
NDVI
Normalized Difference Vegetation Index
Overall plant vigor and biomass from red / near-infrared (NIR) reflectance
NDRE
Normalized Difference Red Edge
Chlorophyll content in dense canopies where NDVI saturates
GNDVI
Green Normalized Difference Vegetation Index
Chlorophyll concentration and nitrogen status
SAVI / OSAVI
Soil-Adjusted Vegetation Index
Vegetation vigor with reduced soil-background noise on sparse canopies
Tracking China's Wheat Belt From Germination to Harvest
Multi-temporal imagery and AI growth models followed a wheat-growing region through a full season, flagging early drought stress well before it was visible on the ground and sharpening the pre-harvest yield forecast.
Irrigation Efficiency
Daily Soil Moisture Mapping Across Henan Province
Field-scale soil moisture maps updated daily triggered automated irrigation alerts across a major growing region, cutting water use while keeping yield-limiting dry spells from going unnoticed.
Insurance & Subsidy Validation
Independent Crop-Health Verification for Insurance Claims
Satellite-derived crop health and damage assessment gave insurers and subsidy programs an independent field record, used across programs in India and Nigeria to validate disaster claims without a ground visit to every plot.
Deliverables
The Outputs We Deliver
Every engagement includes raw data layers, a decision-ready report, and prescription-ready maps, not just imagery.
Original Data Layers
Raw GEOJSON, KML/KMZ, or SHP datasets delivered ready to upload into ArcGIS, QGIS, or open directly in Google Earth Pro.
Decision-Ready PDF Report
A summarized report of crop condition, risk flags, and yield outlook for your fields, ready to share with agronomists or lenders.
Variable-Rate Prescription Maps
Machinery-ready seeding and fertilization prescription maps built from productivity-zone analysis, ready to load directly into your equipment.
Why Satellite Monitoring
Application Benefits
Increase Yield
Field-scale monitoring catches stress and disease early, before it costs bushels.
Cut Input Costs
Variable-rate maps target water, fertilizer, and pesticide only where the data says it is needed.
Protect Crop Health
Early pest, disease, and weather warnings help prevent losses before they spread.
Conserve Water
Field-scale soil moisture data supports precise, efficient irrigation scheduling.
Improve Decision-Making
Data and analysis results support faster, more accurate planting and harvest decisions.
Pricing & Delivery
Agriculture Satellite Imagery Pricing
Transparent per-km² pricing for archive and new-tasking imagery, delivered in the GIS format your team already works in.
Standard Archive
Existing imagery, 90+ days old — ready to download within minutes
Super High Resolution (25-30cm)$20/km²
Very High Resolution (31-50cm)$13/km²
High Resolution (51-80cm)$5/km²
Wide Area (2m)$1/km²
Minimum order area 25km² per scene.
New Satellite Tasking
Fresh capture of your exact location and date range
Super High Resolution (25-30cm)$30/km²
Very High Resolution (31-50cm)$20/km²
High Resolution (51-80cm)$8/km²
Wide Area (2m)$2/km²
Minimum order area 100km² per scene. Priority tasking available for time-critical growth stages.
From the Blog
Agriculture Guides From Our Blog
More on crop monitoring, soil health, and satellite-based farming practices.
What satellite data do you use for agriculture monitoring?
We combine ultra-high-resolution optical imagery (SuperView Neo-1 at 0.3m, SuperView-2 at 0.42m with a 1+8 band Red Edge sensor) with GF-6's 2m/8m red-edge multispectral data, CBERS-04/04A infrared scanning, and multi-source meteorological satellite data, covering everything from single-field crop stress to province-scale yield and weather risk.
Can satellite imagery monitor crop growth throughout the season?
Yes. Comparing satellite images captured at different points during the growing season reveals changes in vegetation vigor, crop establishment, growth stage, and stress across individual fields, letting agricultural teams track development from emergence through to harvest readiness without walking every field.
What type of satellite imagery is best for agriculture?
It depends on the question being asked. Multispectral imagery is best for vegetation health and NDVI-based indices, high-resolution optical imagery is best for field boundaries and individual plots, SAR (radar) imagery works through cloud cover for soil moisture and all-weather monitoring, and thermal imagery is best for water-stress and irrigation analysis. Most agriculture programs combine more than one type.
How accurate is satellite-based crop type and planting area monitoring?
Time-series classification identifies staple food crop plantings with better than 93% accuracy and cash crop plantings with better than 85% accuracy, based on crop phenology analysis applied to multi-source medium- and high-resolution imagery.
Can satellites really measure soil moisture and fertility from space?
Yes. Soil moisture is inverted from the different spectral reflectance of soil at different water content, reaching about 85% accuracy against field measurements. Soil fertility is assessed from spectral reflectance of physical and chemical soil properties, with over 90% accuracy on dry land and around 80% on paddy fields.
How does satellite monitoring detect crop pests and diseases before an outbreak spreads?
A disease-diagnosis model combines optical greenness, SAR backscatter, temperature, irrigation conditions, and planting density to identify disease presence and severity, exceeding 90% accuracy in tested scenarios, well before symptoms are visible to a ground scout walking the field.
How accurate is satellite-based crop yield estimation?
County-level production measurement accuracy is better than 85%, achieved by inverting crop growth indicators like LAI and biomass from spectral data, building a yield model, and combining it with ground-measured data for the region.
What resolution is needed to identify farmland plot boundaries?
Medium- and high-resolution imagery processed through an AI plot-extraction algorithm delivers boundary accuracy better than 2 pixels and plot identification accuracy above 90%, enough to support agricultural production, non-agricultural conversion, and non-grain land monitoring.
How is agriculture satellite imagery delivered and priced?
Imagery is delivered through a cloud platform in GeoTIFF, SHP, DWG, or UTM format. Standard archive imagery starts at $1/km² for 2m wide-area resolution up to $20/km² for 25-30cm, while new tasking for a fresh capture runs from $2/km² up to $30/km², with priority tasking available for time-critical growth stages.
What outputs are included with an agriculture satellite monitoring report?
Each engagement includes original GEOJSON, KML/KMZ, or SHP data layers ready to upload into ArcGIS, QGIS, or Google Earth Pro, a decision-ready PDF report summarizing crop condition and risk flags, and machinery-ready variable-rate prescription maps for seeding and fertilization.
Get Satellite Imagery for Your Farm
Search available farm satellite imagery, compare archive captures, or request new satellite tasking for a specific growing period, optical, multispectral, or radar.