How Satellite-Based Monitoring Protects Oil and Gas Pipelines
On this page
- Why Pipeline Monitoring From Orbit Matters Now
- 1: Millimeter-Level InSAR Detects Ground Movement Before a Rupture
- 2: All-Weather SAR Confirms Leaks and Spills Through Cloud and Darkness
- 3: Optical Imagery Flags Right-of-Way Encroachment and Confirms Damage Visually
- 4: Multispectral and Hyperspectral Sensors Catch a Leak's Spectral Signature
- 5: Methane Sensors and Nighttime Imagery Close the Emissions Reporting Gap
- 6: DEM-Based Flood and Landslide Modeling Flags the Riskiest Corridor Segments
- 7: Satellite Tasking Cuts Emergency Response Time After an Incident
- Pipeline Monitoring in Practice
- Aliso Canyon, the First Facility-Level Methane Leak Seen From Space
- Nord Stream, Quantifying the Largest Single Methane Release Ever Recorded
- Keystone Pipeline, When a Weld Flaw Outruns a Patrol Schedule
- Storm-Season Corridor Risk, Catching an Exposed Crossing Before It Fails
- Choosing the Right Sensor Mix for Your Pipeline Corridor
- Frequently asked questions
- Sources and further reading
A practical guide to oil and gas pipeline monitoring with remote sensing, covering how SAR and InSAR catch ground movement before a rupture, how optical and hyperspectral sensors confirm a leak, how satellites track right-of-way encroachment and gas flaring, and how DEM-based flood modeling flags the corridor segments most at risk.
Quick answer
Oil and gas pipeline monitoring with remote sensing combines satellite SAR, optical, multispectral, thermal, and hyperspectral imagery to watch a corridor continuously instead of relying on periodic ground patrols and aerial surveys. InSAR radar measures ground deformation and subsidence along the route down to 1 to 2 millimeters, often weeks before a stress-related rupture; high-resolution optical imagery flags right-of-way encroachment, unauthorized construction, and visible spill extent; multispectral and hyperspectral sensors pick up vegetation stress and the spectral signature of a hydrocarbon leak; and satellite-based methane sensors quantify gas releases from pipeline incidents and flaring that would otherwise go unreported.
Why Pipeline Monitoring From Orbit Matters Now
US pipeline operators reported an average of 265 significant incidents a year between 2014 and 2024, and the last five years alone added up to more than 3,070 incidents, 58 deaths, and over $2.3 billion in property damage, according to PHMSA's own incident statistics. The pattern behind the costliest failures repeats, a weld flaw or corrosion site under stress for months before it finally gives way, a right-of-way encroachment that goes unnoticed until equipment strikes the line, or a storm that exposes a buried segment no one re-surveyed. The December 2022 Keystone Pipeline rupture in Washington County, Kansas, the largest crude spill in the pipeline's history at roughly 13,000 barrels, traced back to a bending-stress fatigue crack at a girth weld, a flaw that a monthly or quarterly ground patrol has no way to catch before it fails. Satellite remote sensing closes exactly that gap, watching the full length of a corridor on a schedule no ground crew or helicopter patrol can match.
1: Millimeter-Level InSAR Detects Ground Movement Before a Rupture
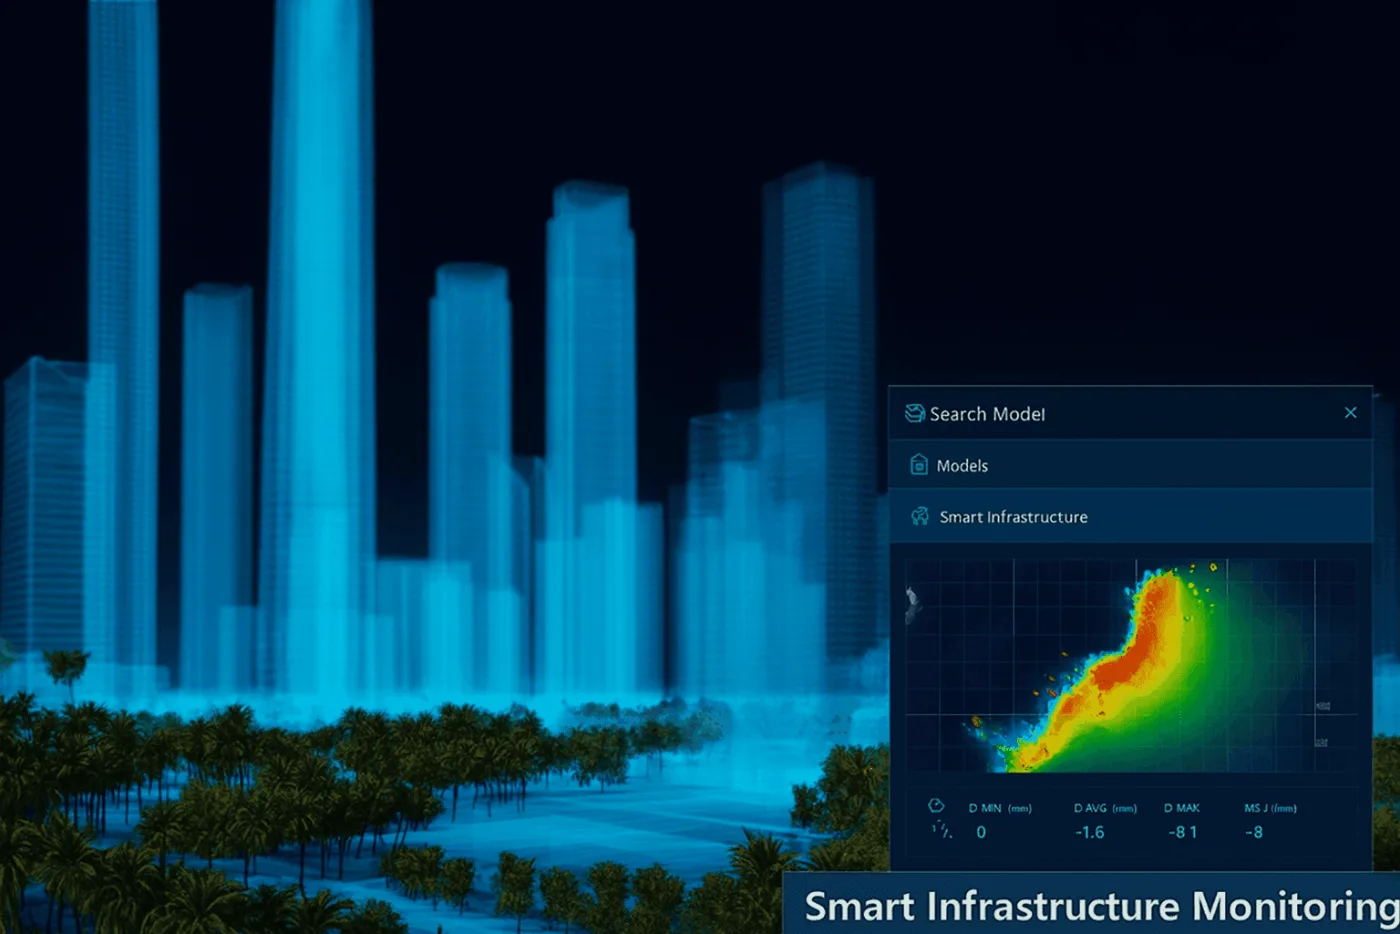
Interferometric SAR, InSAR, compares the phase of a radar signal reflected off the same ground point across repeated satellite passes. L-band satellites such as LT-1 and C-band satellites such as GF-3 turn that phase difference into a deformation map accurate to roughly 1 to 2 millimeters, fine enough to separate ordinary seasonal ground settlement from the accelerating creep that precedes a pipeline rupture. Applied continuously along a right-of-way, InSAR surfaces subsidence over abandoned mine workings, slope creep on a hillside crossing, and soil movement around a buried segment, including river and seabed crossings a ground crew could never inspect directly, weeks before the deformation would otherwise show up as a structural failure.
2: All-Weather SAR Confirms Leaks and Spills Through Cloud and Darkness
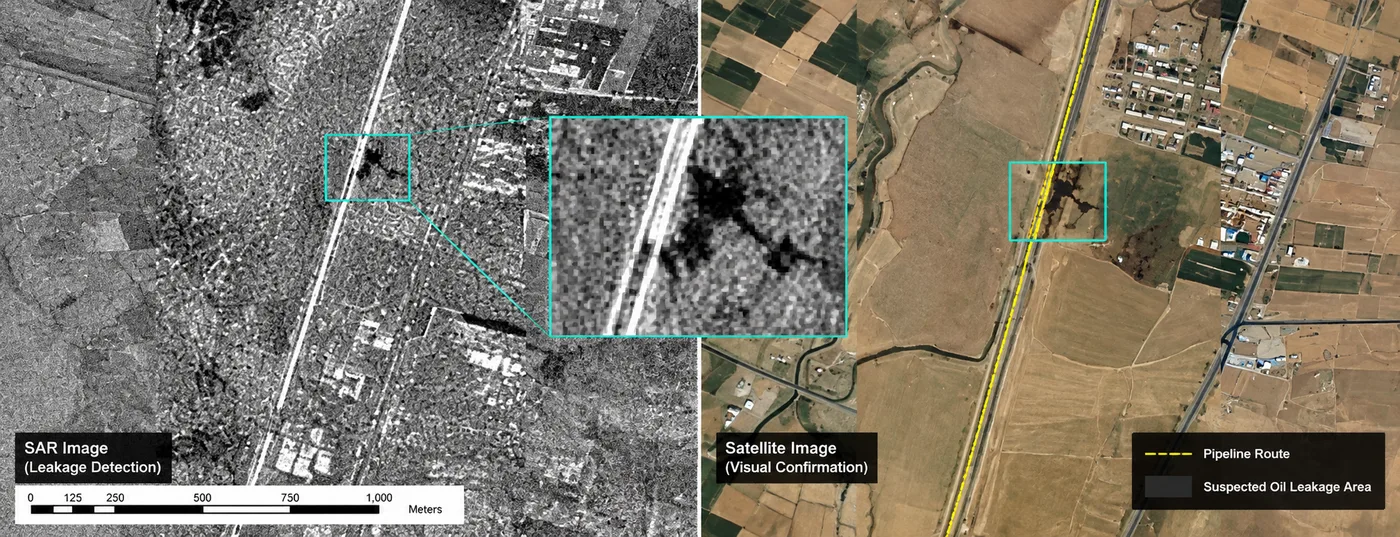
Deformation, leaks, and storms do not wait for clear skies, which is exactly when optical satellites go blind. SAR is an active sensor, it transmits its own microwave pulse and reads the reflection, so it keeps producing a usable image through heavy cloud, monsoon rain, smoke, and total darkness. A fresh hydrocarbon leak changes the surface roughness and dielectric properties of the ground or water it reaches, which shows up as a distinct dark patch in a SAR return, pairing the radar anomaly with a same-day optical pass turns a suspected leak into a visually confirmed one without waiting for a clear-weather overflight.
3: Optical Imagery Flags Right-of-Way Encroachment and Confirms Damage Visually
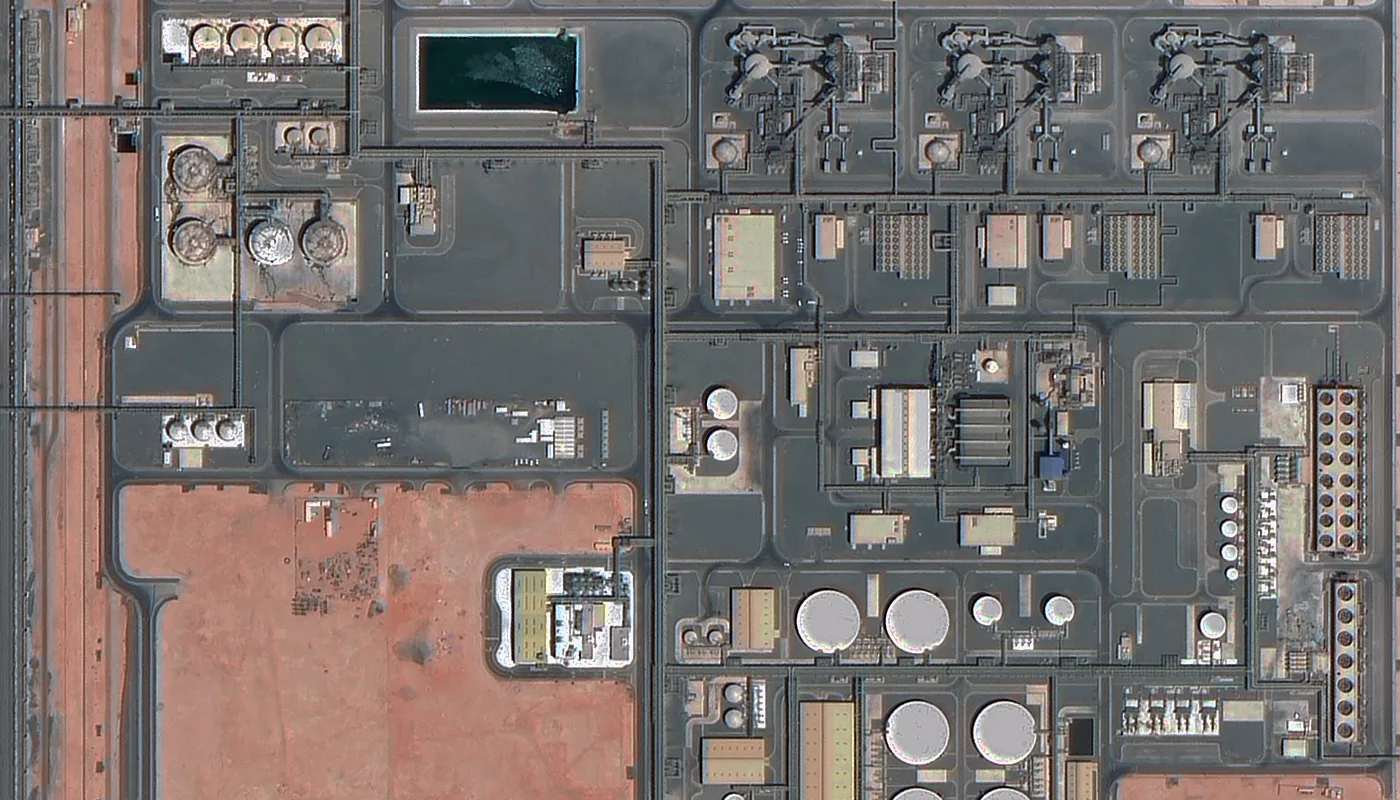
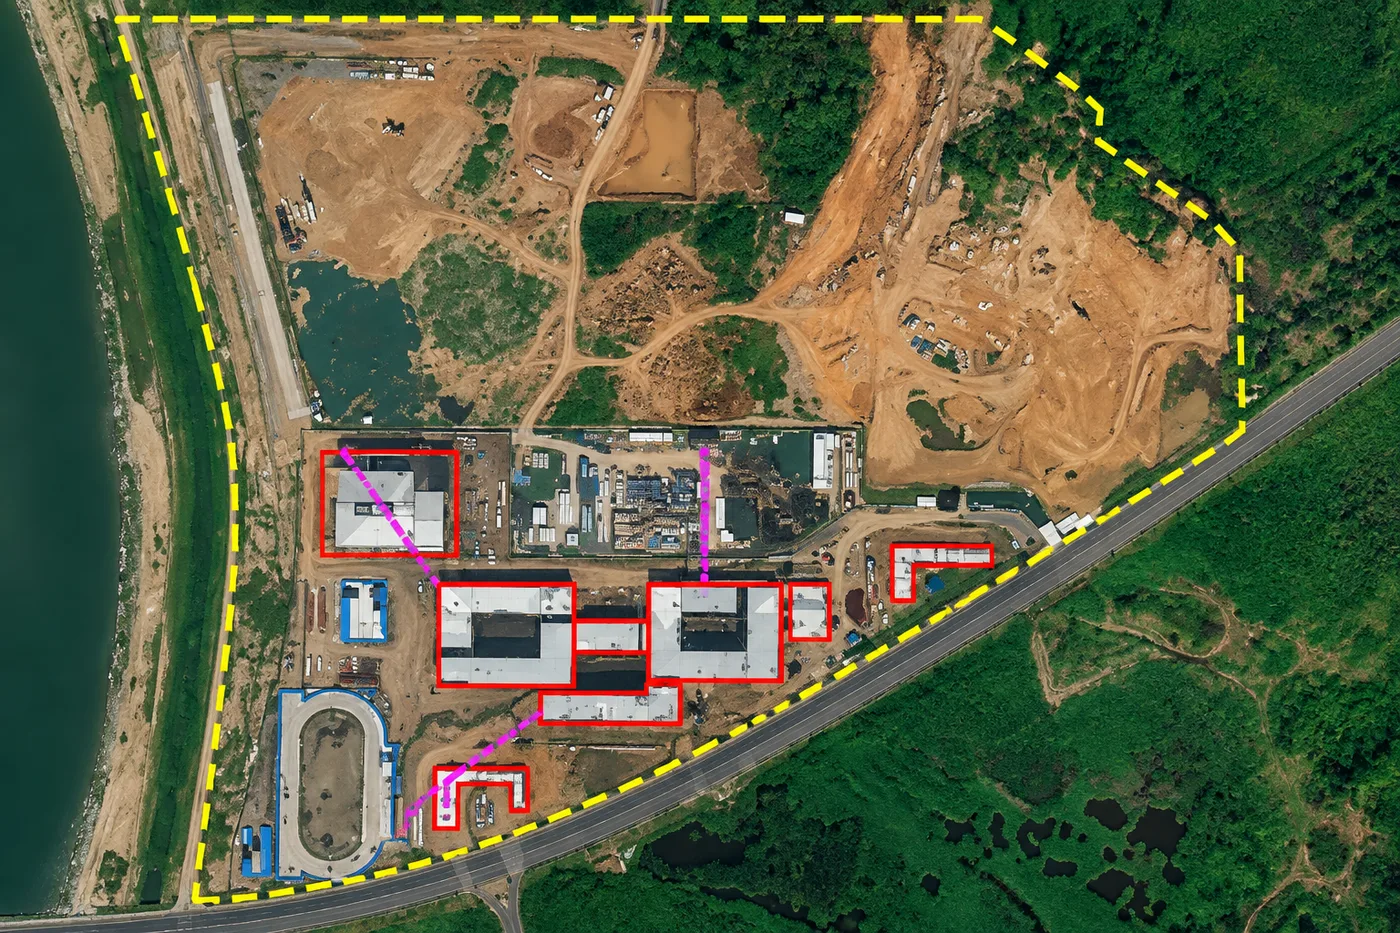
High-resolution optical imagery, typically 25 to 50 cm, is what turns a suspected problem into a mapped one. Automated AI change detection compares a new capture against the last confirmed-clear pass and flags new access roads, excavation, structures, or vehicle activity appearing inside a pipeline buffer zone, the kind of third-party encroachment that causes a large share of reportable incidents. The same resolution tier tracks construction progress at pump stations and compressor sites, and gives responders a clear, measurable view of spill extent once a leak is confirmed.
Need continuous monitoring over your own corridor?
Combine InSAR deformation, all-weather SAR, and high-resolution optical tasking across your pipeline right-of-way. No account needed for a first estimate.
4: Multispectral and Hyperspectral Sensors Catch a Leak's Spectral Signature
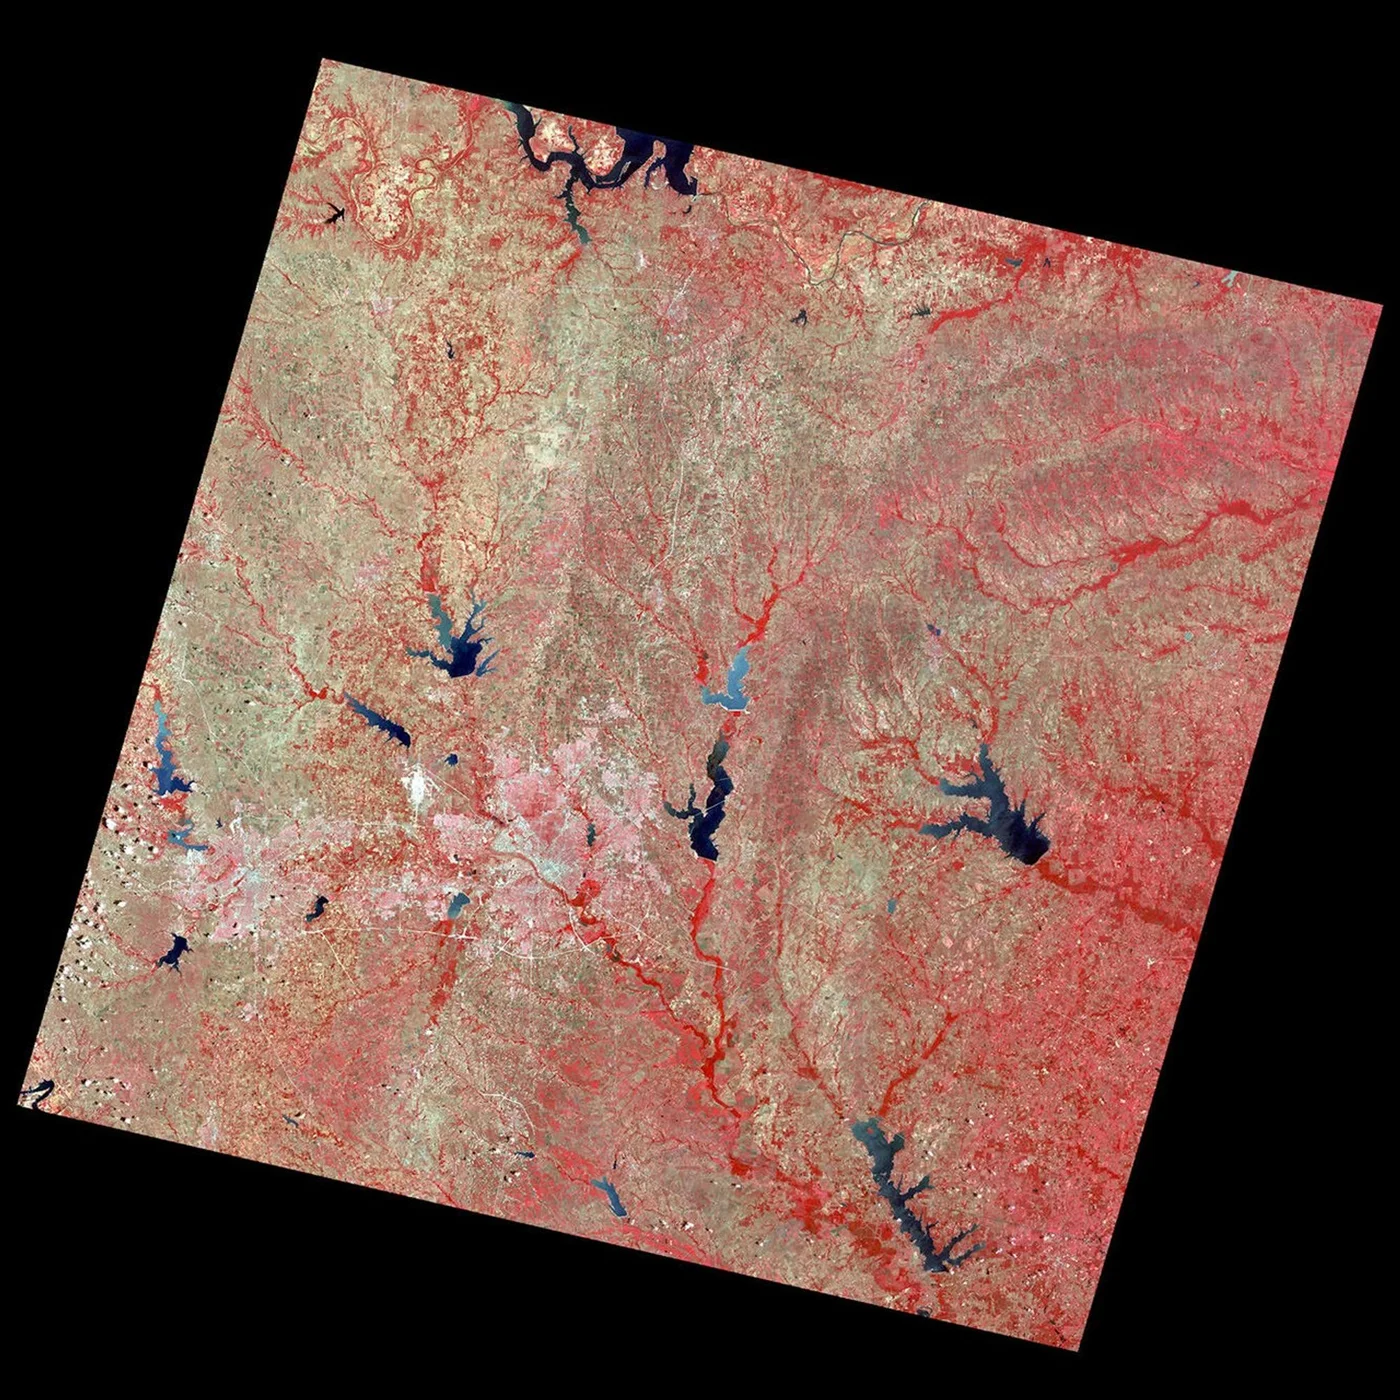
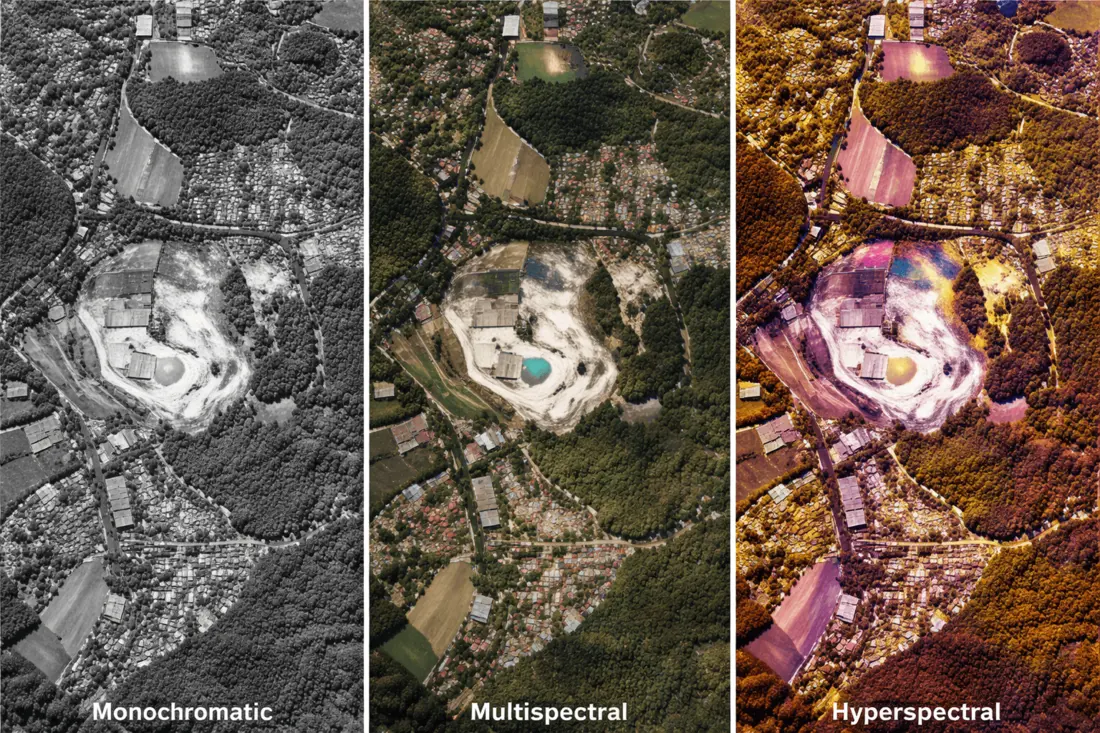
A hydrocarbon leak changes the ground long before a visible stain appears on the surface. Saturated soil stresses plant roots, which shifts a vegetation canopy's near-infrared reflectance, the same mechanism multispectral sensors use for NDVI and the other vegetation indices covered in our guide to what multispectral imaging actually captures. Hyperspectral sensors go a step further, resolving hundreds of narrow, continuous bands fine enough to separate the specific absorption features of crude oil and refined product from ordinary plant or soil stress, the difference between flagging a general anomaly and identifying it as a hydrocarbon leak from orbit. A real-world example of exactly this detection mechanism, resolved from space for the first time at a single facility, is covered in the Aliso Canyon case study below.
5: Methane Sensors and Nighttime Imagery Close the Emissions Reporting Gap
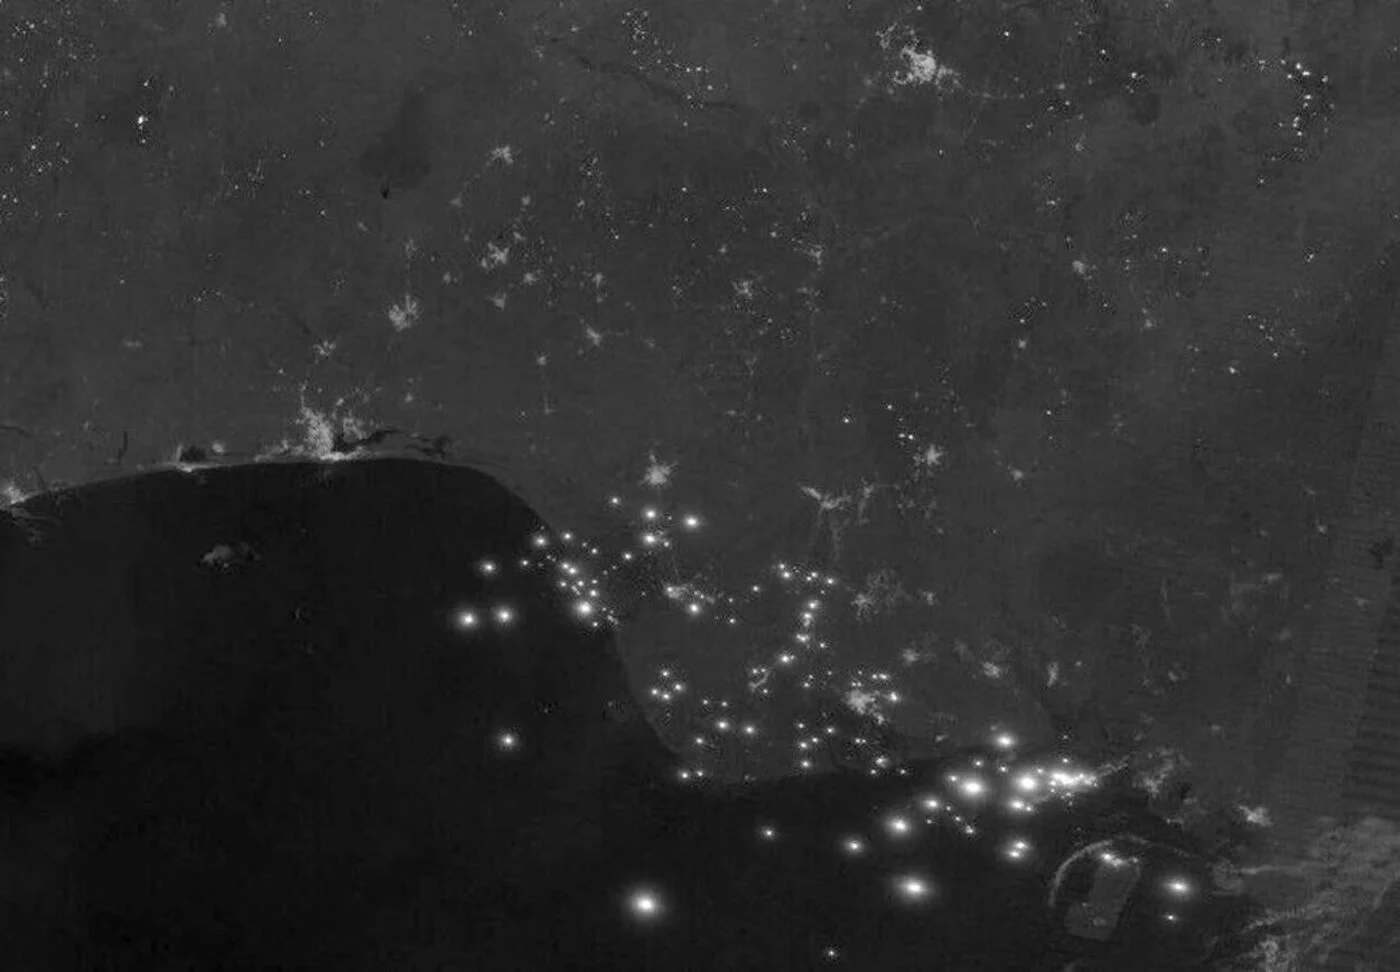
Pipeline infrastructure leaks and vents methane whether or not anyone is reporting it, and satellites now provide an independent check that does not depend on self-reported data. UNEP's International Methane Emissions Observatory runs the Methane Alert and Response System, MARS, drawing on more than 30 satellite instruments including hyperspectral sensors such as EMIT, PRISMA, and EnMAP, and has detected over 10,000 methane plumes from oil and gas activity worldwide, notifying operators directly when a major release is spotted. XRTech's own GF-5B carries a similar visible-to-thermal-infrared payload for facility-level thermal anomaly and emissions screening, covered alongside the rest of the fleet in our hyperspectral sensor guide. A separate but related signal comes at night, nighttime imagery from sensors like VIIRS picks up gas flares as bright point sources, letting researchers and regulators track flaring volume and location at facilities and pipeline-fed processing sites across an entire region from a single pass.
6: DEM-Based Flood and Landslide Modeling Flags the Riskiest Corridor Segments
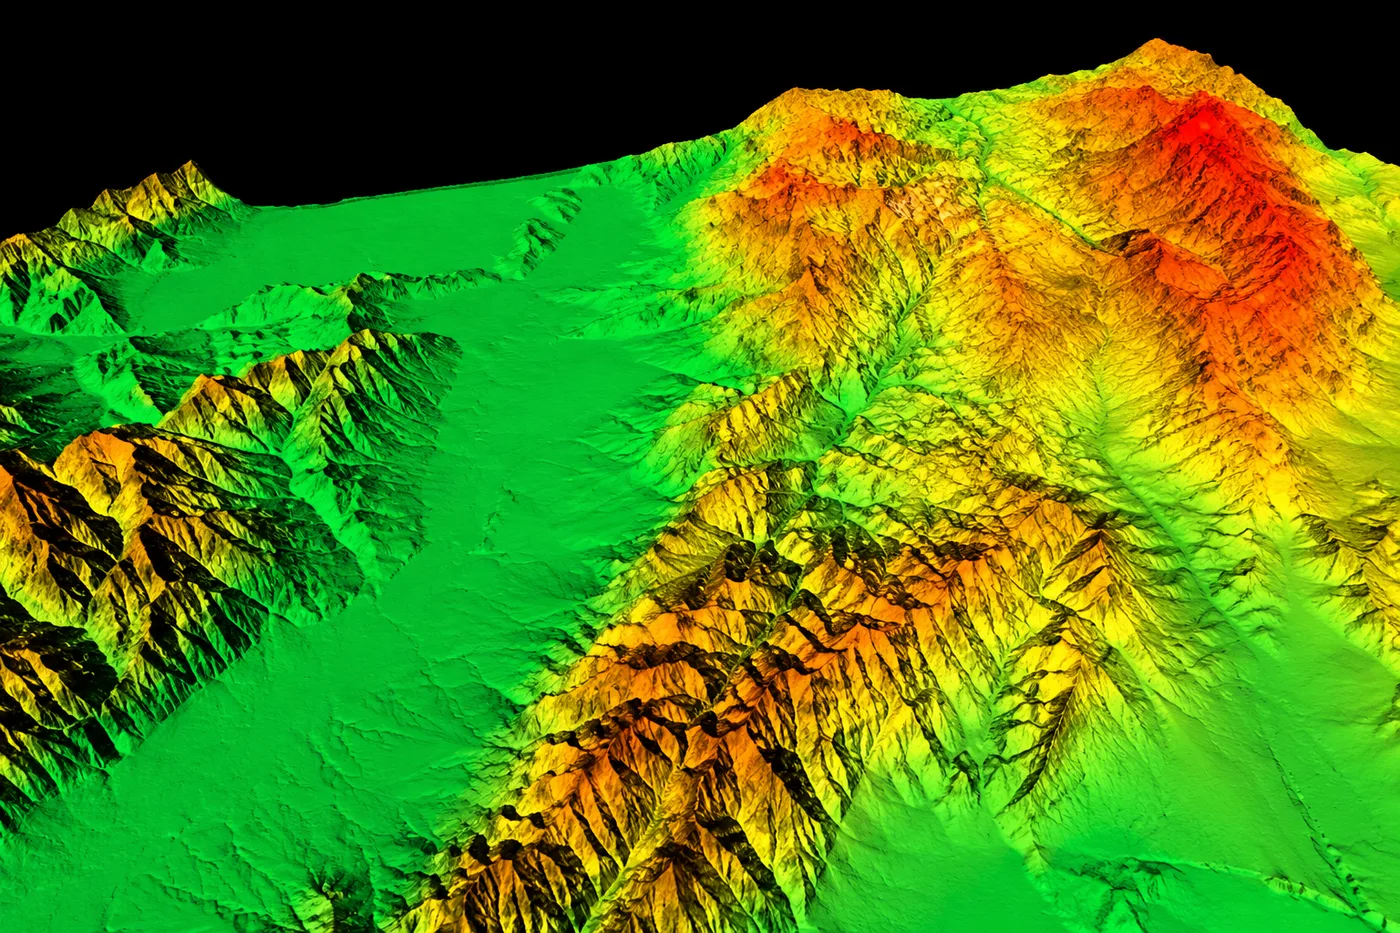
A pipeline route that was stable the day it was buried is not guaranteed to stay that way. Digital Elevation Models built from stereo satellite passes, accurate to roughly ±3 m vertical, model how water actually flows across the terrain a corridor crosses, pinpointing the low-lying segments prone to flooding, bank erosion at a river crossing, and the steep, unstable slopes most likely to fail after heavy rain or seismic activity. Run ahead of a storm season, that model turns a reactive, after-the-fact damage assessment into a prioritized list of segments worth reinforcing or re-surveying before the water arrives, the same geological-hazard screening covered in more general terms in our guide to building 3D models from satellite stereo imagery.
7: Satellite Tasking Cuts Emergency Response Time After an Incident
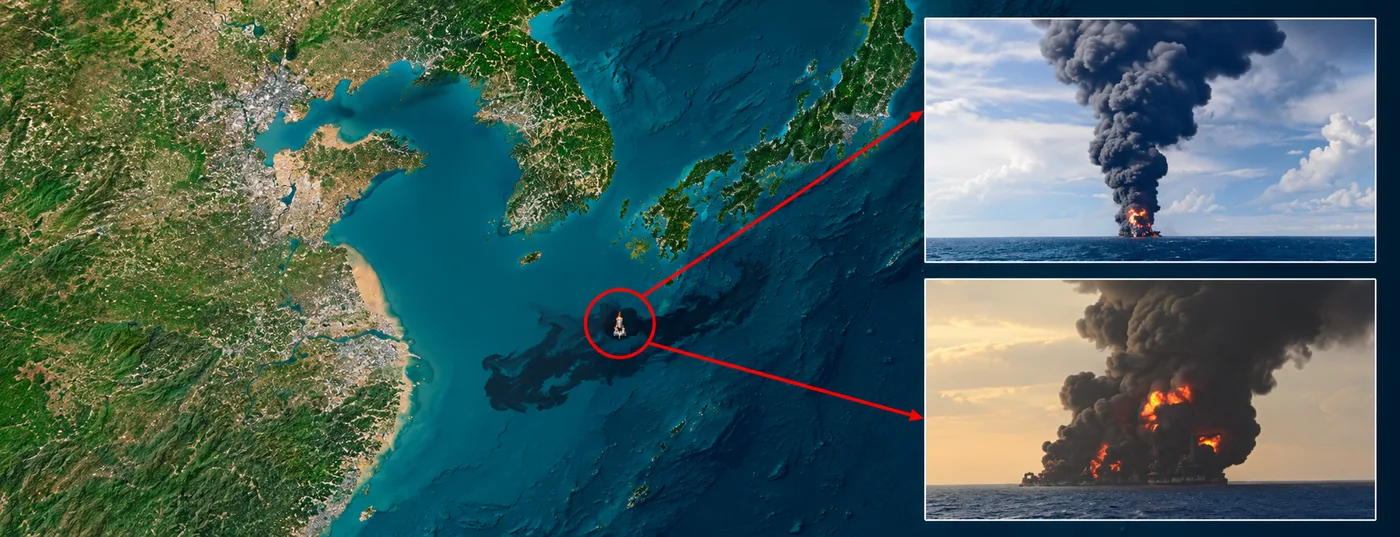
Once an incident is confirmed, speed of imagery matters as much as the sensor type. Priority and emergency tasking can deliver analysis-ready imagery over an active spill, fire, or storm-damaged corridor in under 24 hours, and past marine spill emergencies have processed over 90 satellite scenes within 4 days to help direct cleanup operations. For an offshore platform or well-site fire, optical and thermal-infrared tasking tracks burn extent and smoke-plume direction in near real time, supporting evacuation and containment decisions while the incident is still active rather than after the fact.
Pipeline Monitoring in Practice
These are not hypothetical capabilities. Four real incidents show what each monitoring layer above actually catches, and what it misses when it isn't in place.
Aliso Canyon, the First Facility-Level Methane Leak Seen From Space
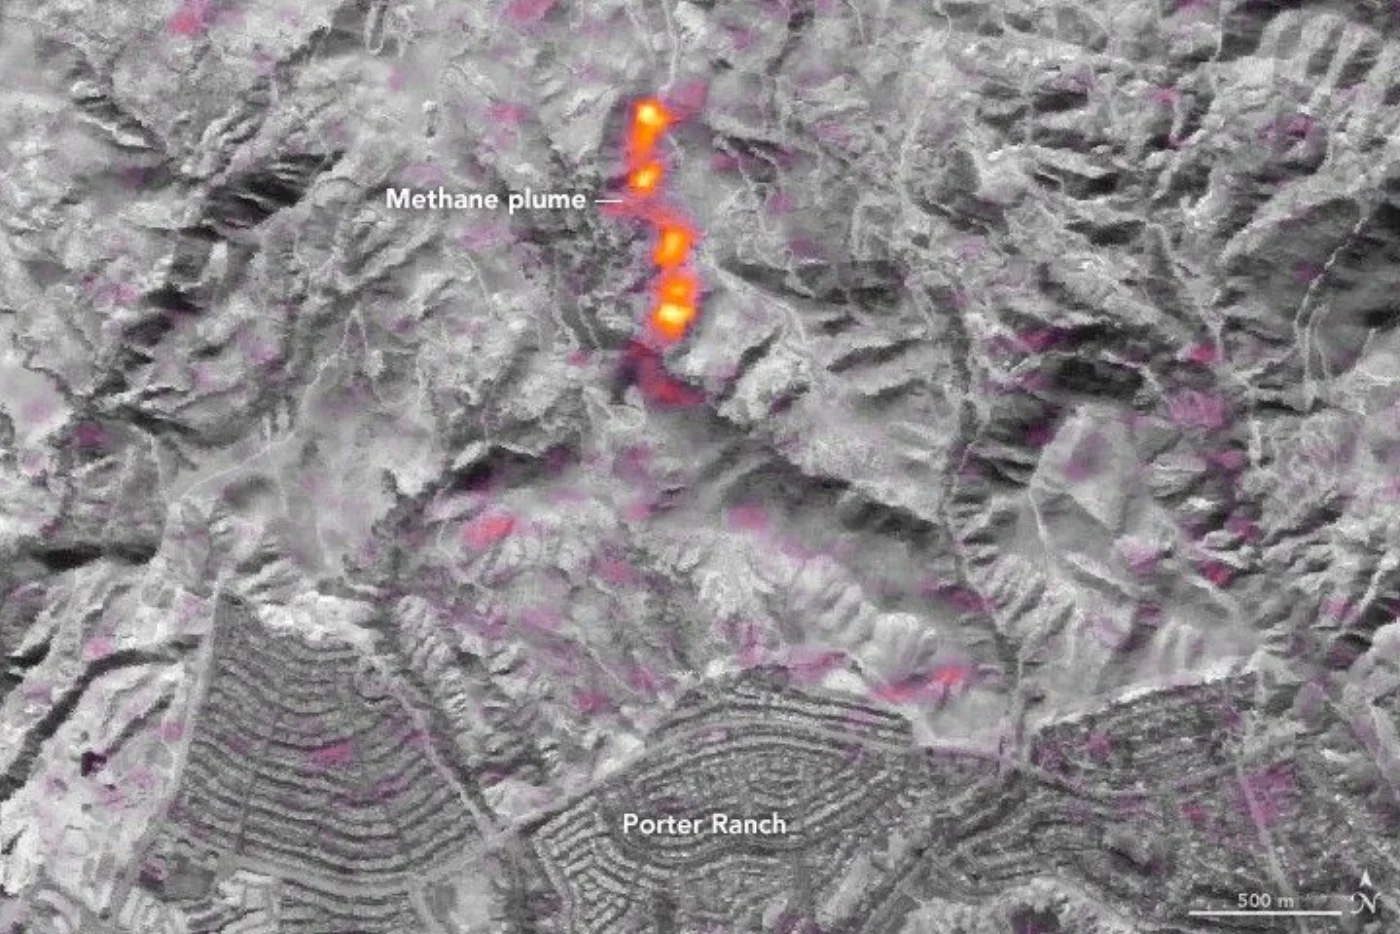
The October 2015 blowout at SoCalGas's Aliso Canyon underground storage facility near Porter Ranch, California, released 109,000 metric tons of methane over four months, the largest uncontrolled release from a single US facility on record. In January 2016, NASA's EO-1 satellite used its Hyperion hyperspectral instrument to image the plume directly over the facility, the first time emissions from a single site had ever been measured from orbit, a capability now built into facility-level satellite monitoring everywhere.
Nord Stream, Quantifying the Largest Single Methane Release Ever Recorded
When the Nord Stream and Nord Stream 2 pipelines ruptured in the Baltic Sea in late September 2022, Sentinel-2 and Landsat 8 optical passes confirmed a methane-driven surface disturbance roughly 500 meters across, while GHGSat's dedicated methane-sensing satellites measured a peak release rate of 79,000 kilograms per hour and a total of 465,000 metric tons of methane, one of the largest point-source leaks ever quantified from space. No ground sensor network could have measured a subsea release at that scale and speed, satellite data was the only independent record of how much gas actually escaped.
Keystone Pipeline, When a Weld Flaw Outruns a Patrol Schedule
The December 2022 Keystone Pipeline rupture in Washington County, Kansas, released roughly 13,000 barrels of crude into Mill Creek, the largest spill in the pipeline's operating history. The investigation traced the failure to a weld flaw combined with bending stress that had been building for years, exactly the kind of slow-developing structural fatigue that InSAR deformation monitoring is built to catch along a right-of-way long before a scheduled ground patrol would reach that exact segment.
Storm-Season Corridor Risk, Catching an Exposed Crossing Before It Fails
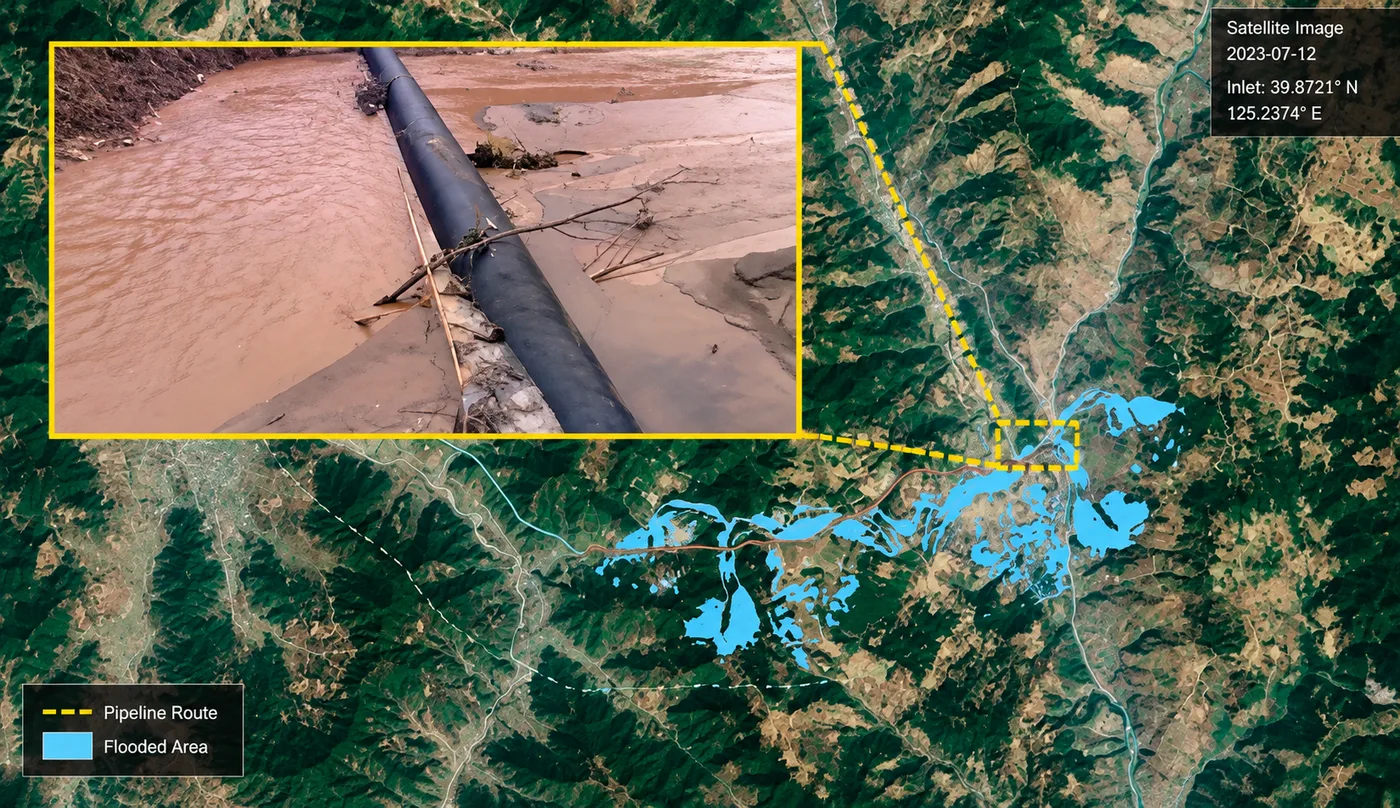
During monsoon season, repeat all-weather tasking over a pipeline corridor can produce a same-week briefing on newly flooded or exposed sections. In one such case, satellite flood mapping flagged a river crossing where erosion had undercut and exposed a buried segment, confirmed by a ground follow-up, letting the operator schedule reinforcement before the exposed pipe itself became the point of failure rather than after.
Oil and gas pipeline monitoring by the numbers
Figures drawn from regulatory data, published satellite research, and XRTech's own fleet specifications, not marketing estimates.
Average significant US pipeline incidents reported annually from 2014 through 2024, per PHMSA.
InSAR ground deformation precision achievable along a pipeline corridor using LT-1 and GF-3 SAR data.
Methane plumes from oil and gas activity detected worldwide by UNEP's satellite-based MARS alert system.
Methane released in the Aliso Canyon storage leak, the largest single-facility release in US history.
Choosing the Right Sensor Mix for Your Pipeline Corridor
No single sensor covers every failure mode above, which is why operational pipeline monitoring layers several together rather than picking one.
| Monitoring need | Best-fit sensor | Why |
|---|---|---|
| Ground movement or subsidence along the route | SAR / InSAR | Millimeter-level deformation, day or night, any weather |
| Visual confirmation of a spill or encroachment | High-resolution optical | 25 to 50 cm detail for direct visual interpretation |
| Leak or spill detection through cloud or darkness | C-band or L-band SAR | Active sensor, no dependence on sunlight or clear skies |
| Vegetation stress above a buried leak | Multispectral (NDVI) | Flags canopy stress before it is visible on the ground |
| Confirming a hydrocarbon spectral signature | Hyperspectral | Resolves absorption features multispectral bands can't |
| Methane emissions and gas flaring | Thermal-infrared / dedicated methane sensors | Point-source quantification independent of self-reporting |
| Flood and landslide risk along the corridor | DEM / elevation modeling | Flags unstable or low-lying segments before a storm hits |
For the full commercial breakdown of satellite constellations, resolution tiers, and pricing XRTech offers across upstream, midstream, and downstream oil and gas assets, see our satellite imagery solutions for oil and gas page. For how resolution tiers translate into actual pixel size, see choosing the right satellite resolution, and for the radar mechanics behind all-weather monitoring, see SAR imagery for disaster response mapping.
Key takeaways
- InSAR radar measures ground deformation along a pipeline corridor down to 1 to 2 millimeters, often weeks before a stress-related rupture becomes visible.
- SAR works through cloud, smoke, and total darkness, pairing with optical imagery to both detect and visually confirm a leak or spill.
- High-resolution optical and AI change detection flag right-of-way encroachment, unauthorized construction, and third-party activity before it becomes a strike hazard.
- Multispectral vegetation indices and hyperspectral band data catch a hydrocarbon leak's effect on soil and plant health, and in some cases its spectral signature directly.
- Satellite-based methane sensors and nighttime gas-flaring imagery provide an independent emissions record that does not rely on self-reported data, while DEM-based flood and landslide modeling flags the corridor segments most at risk before a storm.
Frequently asked questions
How does remote sensing detect oil and gas pipeline leaks?
Remote sensing detects pipeline leaks by combining several signals, a SAR radar anomaly where hydrocarbons change the ground or water's surface return, a vegetation stress pattern visible in multispectral imagery, a hydrocarbon spectral signature resolved by hyperspectral sensors, and a visible spill footprint confirmed by high-resolution optical imagery. Used together, these catch a leak earlier and more reliably than any single sensor alone.
What is InSAR and how does it monitor pipeline integrity?
InSAR, Interferometric Synthetic Aperture Radar, compares the phase of a radar signal reflected off the same ground point across repeated satellite passes to measure how much the surface moved. Along a pipeline corridor, this detects soil subsidence, slope creep, and ground movement down to 1 to 2 millimeters, surfacing the kind of gradual structural stress that precedes a rupture weeks before it would otherwise be detected.
Can satellites detect pipeline leaks through cloud cover or at night?
Yes, SAR satellites can. Because SAR transmits its own microwave signal instead of relying on sunlight, it produces a usable image through thick cloud, smoke, and total darkness, conditions that leave optical satellites blind. Optical and hyperspectral sensors still need daylight and a reasonably clear sky to confirm what SAR flags.
How is satellite imagery used to monitor pipeline right-of-way encroachment?
High-resolution optical imagery, typically 25 to 50 cm, is compared against the last confirmed-clear capture using automated AI change detection, which flags new access roads, excavation, structures, or vehicle activity appearing inside a mapped pipeline buffer zone. This catches third-party encroachment and construction near the right-of-way before it becomes a safety or strike hazard.
Can satellites detect methane emissions from oil and gas pipelines?
Yes. Dedicated satellite methane sensors and hyperspectral instruments such as EMIT, PRISMA, and EnMAP detect and quantify point-source methane releases from pipeline infrastructure. UNEP's Methane Alert and Response System has detected more than 10,000 methane plumes from oil and gas activity worldwide using more than 30 satellite instruments, providing an emissions record independent of self-reported data.
What resolution is needed to monitor a pipeline corridor by satellite?
High-resolution optical imagery at 25 to 50 cm is typically used for right-of-way encroachment detection, facility construction tracking, and visual spill confirmation. SAR resolution for InSAR deformation monitoring is sensor-dependent rather than a single fixed number, since what matters for deformation mapping is phase precision across repeat passes, not raw pixel size.
How quickly can satellite imagery respond to a pipeline spill or incident?
Priority and emergency satellite tasking can deliver analysis-ready imagery over an active incident in under 24 hours. In past large-scale marine oil spill emergencies, more than 90 satellite scenes were processed within 4 days to help direct cleanup operations.
What is gas flaring and how is it monitored from space?
Gas flaring is the controlled burning of natural gas at oil and gas facilities, typically for safety or when there is no economic way to capture it. Nighttime satellite sensors such as VIIRS detect flares as bright point sources, letting researchers and regulators track flaring volume, location, and trends across an entire region or country from repeated passes.
How does DEM-based flood modeling protect pipeline infrastructure?
A Digital Elevation Model built from stereo satellite imagery, accurate to roughly ±3 m vertical, models how water flows across the terrain a pipeline crosses. Run ahead of a storm season, it identifies low-lying segments prone to flooding, river crossings at risk of erosion, and unstable slopes likely to fail, letting operators prioritize reinforcement or re-inspection before damage occurs rather than after.
For the full satellite constellation lineup, pricing, and deliverables XRTech offers for oil and gas operators, see our oil and gas satellite monitoring solutions page. To understand the capture process behind every image in this guide, see how satellite images are taken.
Sources and further reading
- PHMSA: Pipeline incident statistics and significant incident reporting, 2014 to 2024
- UNEP International Methane Emissions Observatory, IMEO: Methane Alert and Response System (MARS) satellite detection data
- GHGSat and ESA Copernicus: Nord Stream pipeline methane leak quantification, September 2022
- NASA/JPL and the EO-1 mission team: Hyperion hyperspectral imaging of the Aliso Canyon methane leak
- NASA Earth Observatory: Niger River Delta nighttime gas flaring, VIIRS imagery
- California Air Resources Board: Aliso Canyon methane emissions final assessment
- eoPortal and China Siwei: GF-3, LT-1, and GF-5B SAR and hyperspectral mission specifications
Ready to monitor your pipeline corridor from orbit?
Search free and commercial SAR, optical, multispectral, and DEM archive over your right-of-way, or request tasking for emergency response. Get a first estimate in minutes, no account required.