Is There a Point in the Season Satellite Stress Signals Are Accurate Enough to Trade
On this page
- Why Early-Season Satellite Crop Stress Signals Carry Too Much Uncertainty to Trade
- The Growth Stage Where Satellite Stress Signals Become Accurate Enough to Trade
- How Satellite Crop Stress Signal Timing Compares to USDA Crop Condition Reports
- Why the Tradable Window for Satellite Crop Stress Signals Still Closes
- How XRTech Supports In-Season Satellite Crop Stress Monitoring
- Frequently asked questions
- Sources and further reading
Quick answer
Yes, there is a real point in the growing season where satellite crop stress signals become accurate enough to trade on, and a real stretch before it where they are not. Published research puts that turning point around the tasseling and silking stage for corn (growth stage VT/R1) and a similar reproductive window for soybeans, roughly mid-season, when NDVI-based vegetation index readings start correlating strongly with final yield, studies report correlation coefficients climbing from near zero in early June to around 0.82 for corn and 0.76 to 0.80 for soybeans by July and August. Before that point, early vegetative-stage readings (V6 to V7) are noisy and weakly correlated with final yield, soil background reflectance, replant risk, and patchy emergence all distort the signal. This is a plain read of the published research and signal timing, not financial advice.
Why Early-Season Satellite Crop Stress Signals Carry Too Much Uncertainty to Trade
In the first few weeks after planting, a satellite reading of a field is mostly looking at bare soil with a thin, uneven scatter of young plants on top. At the V6 to V7 leaf stage, published in-season sensor studies found a poor, weak relationship between NDVI and final grain yield, the canopy simply hasn't closed enough yet for the vegetation signal to dominate over soil color, moisture, and residue underneath it. Add replant risk, uneven emergence across a field, and early-season cloud cover gaps in optical coverage, and an early reading can look stressed for reasons that have nothing to do with how the crop will actually finish the season.
University of Illinois farmdoc daily research tracking USDA condition ratings against final corn and soybean yields found the same pattern from a different angle, correlation between weekly Good-plus-Excellent ratings and final yield is very low early in the season for both crops. That's the same signal-to-noise problem satellite-based vegetation indices run into, a reading taken too early simply doesn't carry enough information yet to separate a real stress event from normal early-season noise, whether the reading comes from a field scout's eye or a satellite sensor.
Early season isn't a dead zone for satellite data generally, it's only a dead zone specifically for stress-trading signals. AI-based crop-type classification and planted-acreage verification, confirming what's actually in the ground and how many hectares of it, already runs at better than 90% accuracy in commercial deployments from the earliest post-emergence imagery. That acreage number is a legitimate, tradable input in its own right, it just answers a different question than "how is this crop going to yield," which is the one that needs the canopy to mature before it can be answered with any confidence.

The Growth Stage Where Satellite Stress Signals Become Accurate Enough to Trade
The published research points to a fairly consistent window. A MODIS-based study by Sakamoto, Gitelson, and Arkebauer found that a wide dynamic range vegetation index read 7 to 10 days before corn silking had a strong linear correlation with final grain yield, at both field and regional scale. A separate study on maize found the strongest predictive accuracy right at tasseling and silking (growth stage VT/R1), with a mean absolute percentage error of 8.75%, the lowest error of any stage tested. A third in-season sensor study found the relationship between NDVI and yield was still weak at V6 to V7, but by V8 it strengthened enough to explain 77% of the yield variation in that dataset, before saturating again once full canopy closure made later readings less able to distinguish differences in biomass.
Put together, that's a consistent picture across three independent studies, late vegetative growth through tasseling and silking is where a satellite stress signal stops being noise and starts carrying real, tradable information about where that crop is headed.
In XRTech's own fleet, this is the exact window where the Normalized Difference Red Edge index, NDRE, does its most useful work. NDRE is calculated as (NIR − Red Edge) ÷ (NIR + Red Edge), and because Red Edge light penetrates deeper into the canopy than standard red or NIR, it keeps responding to falling chlorophyll weeks before a stressed leaf turns visibly pale, well ahead of what a field scout or plain NDVI would catch. SuperView-2 carries a dedicated Red Edge band at 710 to 750 nm, and GF-6, built specifically for agricultural monitoring, carries two, 690 to 730 nm and 730 to 770 nm, for wide-area regional coverage. That earlier catch is what lets a confirmed NDRE drop at the tasseling and silking window turn into a tradable signal before the stress is visible on the ground at all, not just before USDA's own report catches up to it.
Confirm a stress signal at the right growth stage
Task a fresh NDVI or NDRE capture right at tasseling, silking, or pod-set over your tracked fields, delivered in 4 to 7 days standard.
How Satellite Crop Stress Signal Timing Compares to USDA Crop Condition Reports
A satellite stress signal is only tradable if it tells you something before everyone else finds out the same thing. USDA's weekly Crop Progress and Condition reports are the public benchmark here, and the farmdoc daily research cited above timed them precisely, the Good-plus-Excellent rating becomes a reliable predictor of final corn yield by mid-July, and for soybeans by mid-August, with correlation holding fairly steady from that point through harvest. That means the growth-stage window where satellite signals turn accurate, tasseling and silking for corn, the comparable reproductive stage for soybeans, lines up almost exactly with when USDA's own public rating starts becoming reliable too.
Vendors selling satellite-based yield forecasts to trading desks lean on that overlap directly. Gro Intelligence's own research team described their models as more volatile earlier in the season, prone to higher highs and lower lows than USDA and other trade estimates, before reaching what they called high levels of statistical accuracy against USDA's final numbers toward the end of July, the same window the independent academic research points to. A separate vendor, SatYield, markets satellite-based yield estimates to commodity trading clients claiming delivery 60 to 90 days ahead of USDA's WASDE report, a vendor claim worth noting but not independently verified.
| Signal | Crop | When it becomes reliable |
|---|---|---|
| NDVI / vegetation index | Corn | 7 to 10 days before silking (VT/R1) |
| NDVI / vegetation index | Corn (in-season sensor study) | V8 leaf stage, 77% of yield variance explained |
| USDA Good+Excellent rating | Corn | Reliable by mid-July, ~0.82 correlation |
| USDA Good+Excellent rating | Soybeans | Reliable by mid-August, ~0.80 correlation |
Why the Tradable Window for Satellite Crop Stress Signals Still Closes
Getting an accurate signal and having a tradable edge are not the same thing. Once a satellite-derived stress signal lines up with the same window USDA's own public rating becomes reliable, the private information advantage shrinks fast, by the time your reading and the public report agree, the market has usually already priced it in. The real edge window sits in the days to weeks before that overlap, after the signal stops being noise but before the public data catches up to it, which is exactly why satellite-based yield vendors emphasize lead time over the official WASDE report as their core selling point rather than accuracy alone.
There's also a ceiling satellite signals don't cross even at their most accurate. An agricultural market analyst reviewing satellite-based crop forecasting pointed out that satellite imagery doesn't directly detect pollination failure, disease spread, or localized weather damage the way a field scout or yield-model that blends in weather data can, a vegetation index shows the downstream canopy effect of those problems, often with a lag, not the cause itself as it happens. That's part of why even Gro Intelligence's own reported error rates, around 2% for corn and 2.5% for soybeans by their senior analyst's account, stay above zero rather than converging on a perfect forecast, and why farmdoc's own corn yield model, built on the Week 25 condition rating alone, still carried a standard error of 9.3 bushels, meaningful residual uncertainty even after the rating had become statistically reliable.
This same edge-before-the-public-catches-up pattern shows up well beyond crop markets. Firms like Orbital Insight and Kayrros run the same information-timing play on crude oil, measuring the shadow a floating roof casts inside a storage tank against the shadow the tank itself casts outside it to estimate fill level from orbit, at a claimed 25,000-plus tanks tracked globally, with that data distributed to trading desks through partners including CME's Datamine service. The accuracy claims behind those numbers are vendor-reported and contested, not independently verified, but the underlying logic is the same one driving the growing-season window above, a satellite signal is worth trading on exactly as long as it says something the public data hasn't said yet.
How XRTech Supports In-Season Satellite Crop Stress Monitoring
XRTech doesn't sell trading signals, we sell the imagery that in-season crop monitoring and yield models are actually built on, timed to hit the growth stages where that imagery carries real signal rather than noise. A practical workflow across the season looks like this.
- Early season. Task or pull archive imagery to verify planted acreage and crop type, a classification task that already runs above 90% accuracy even this early, well before stress signals themselves are trustworthy.
- Mid-season. Monitor NDRE and Red Edge reads through the tasseling, silking, or pod-set window, catching a chlorophyll drop weeks before it would show up as visible browning on the ground.
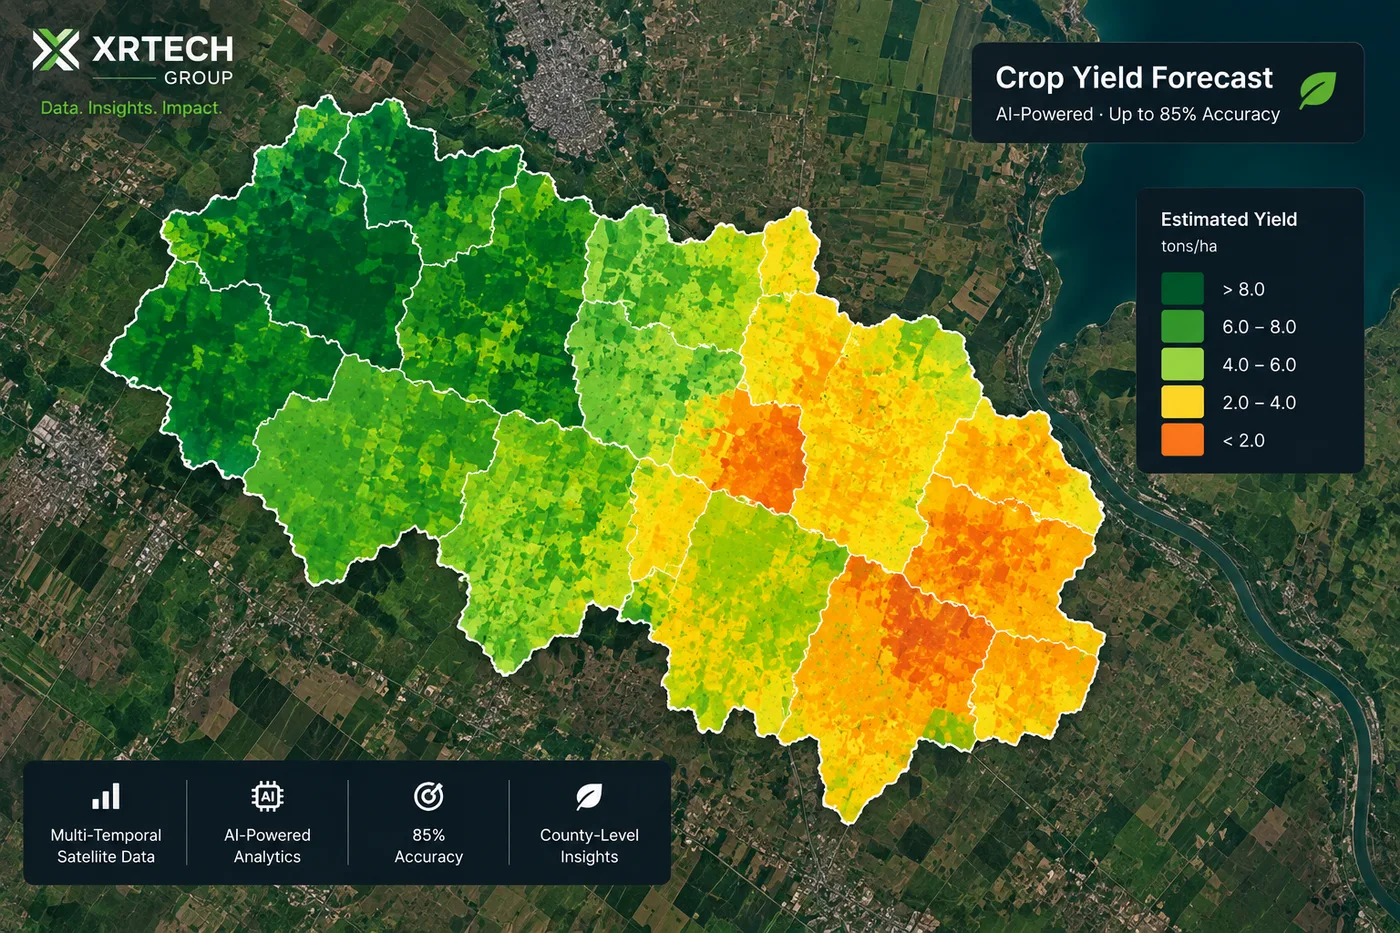
- Pre-harvest. Run multi-temporal imagery through grain fill into a county-level yield estimate, roughly 85% accuracy in current commercial models, to lock in a position before the official harvest count confirms it.
- Multispectral tasking at the right stage. GF-6, built specifically for precision agriculture with Red Edge bands, and SuperView-2's 8-band configuration including Red Edge and dual NIR, both support NDVI and NDRE reads timed to the tasseling, silking, or pod-set window.
- All-weather coverage through cloud. GF-3 and LT-1 SAR keep a usable read going through the cloud cover that optical sensors lose during the exact reproductive-stage window that matters most, so a cloudy week doesn't create a gap right when the signal is turning reliable.
- Historical baseline for real anomaly detection. Landsat and Sentinel-2 archive depth supports a Vegetation Condition Index-style comparison, this season's reading against the same location's historical min/max, the same approach used in index-based crop insurance to separate a real weather-driven anomaly from normal seasonal variation.
- Fast confirmation captures. Standard new tasking delivers in 4 to 7 days, with priority and emergency tiers available when a stress signal needs confirming faster than that.
See the full monitoring service on our agriculture satellite imagery page, or go straight to order new satellite tasking timed to your crop's growth stage.
Build your own in-season signal on real data
Multispectral and SAR tasking across XRTech's fleet, timed to the growth stage where your crop stress signal actually becomes accurate.
Key takeaways
- Yes, there is a real point in the growing season where satellite crop stress signals turn accurate, roughly the tasseling and silking growth stage (VT/R1) for corn and the comparable reproductive stage for soybeans.
- Before that point, early vegetative-stage readings (V6 to V7) are weakly correlated with final yield, soil background, replant risk, and uneven emergence all distort the signal too early to trust, even though crop-type classification and acreage verification are already reliable at the same stage, above 90% accuracy.
- Published correlation between crop condition and final yield climbs to about 0.82 for corn by early-to-mid July and about 0.76 to 0.80 for soybeans by late July through August, both satellite-based indices and USDA's own weekly ratings follow this same timing.
- NDRE, built from the Red Edge band (710 to 750 nm on SuperView-2, 690 to 770 nm across GF-6's dual Red Edge bands), catches a falling chlorophyll signal weeks before a stressed leaf turns visibly pale, ahead of both plain NDVI and a field scout's eye.
- The real information edge sits in the window after a satellite signal turns accurate but before the public USDA rating catches up, since the edge narrows once the two converge.
- Satellite signals don't directly detect pollination failure, disease, or localized weather damage, which is why real-world forecast error, including vendor-reported figures around 2 to 2.5% and a 9.3-bushel standard error in one academic model, stays above zero even at peak reliability.
- This is a read of published research and signal timing, not financial advice, XRTech supplies the multispectral, SAR, and archive imagery this kind of in-season tracking is built on, not trading recommendations.
Frequently asked questions
Are satellite crop stress signals accurate enough to trade on?
Yes, but only from around the tasseling and silking growth stage onward for corn, and the comparable reproductive stage for soybeans. Before that point, published research shows satellite-based vegetation index readings are weakly correlated with final yield and too noisy to rely on.
Why are early-season satellite crop stress signals unreliable?
Early in the season the crop canopy hasn't closed, so a satellite reading picks up soil background, residue, and uneven emergence as much as actual plant stress. Studies on NDVI at the V6 to V7 leaf stage found only a weak relationship with final grain yield for this reason.
What growth stage do satellite stress signals become accurate?
For corn, published studies point to 7 to 10 days before silking and the V8 leaf stage through tasseling and silking (VT/R1) as the window where correlation with final yield strengthens sharply, in one study explaining 77% of yield variation by V8.
How does satellite signal timing compare to USDA crop condition reports?
They line up closely. University of Illinois farmdoc daily research found USDA's Good-plus-Excellent condition rating becomes a reliable predictor of final yield by mid-July for corn and mid-August for soybeans, almost the same window satellite-based vegetation indices turn accurate in.
Does a satellite stress signal still give a trading edge once it is accurate?
The edge is strongest in the gap between when a satellite signal turns accurate and when the public USDA rating reaches the same reliability. Once both converge, the private information advantage narrows, which is why satellite data vendors emphasize lead time ahead of public reports as their main selling point.
Can satellites detect everything that affects final crop yield?
No. Satellite imagery reads the crop canopy, not the underlying cause, so it doesn't directly detect pollination failure, disease spread, or localized weather damage until those problems show up as a visible canopy change, often with a lag. This is part of why forecast error stays above zero even at peak signal accuracy.
What satellite data is used to track crop stress through the season?
Multispectral sensors with Red Edge and NIR bands, such as GF-6 and SuperView-2, generate NDVI and NDRE readings for in-season tracking. SAR satellites like GF-3 and LT-1 keep that record unbroken through cloud cover, and multi-decade Landsat and Sentinel-2 archives provide the historical baseline needed to tell a real anomaly from normal seasonal variation.
Is satellite imagery useful at all early in the season if stress signals aren't reliable yet?
Yes, just for a different question. AI-based crop-type classification and planted-acreage verification already runs above 90% accuracy from the earliest post-emergence imagery, well before stress or yield signals become trustworthy. Confirming what's planted and how many hectares is a separate, earlier-reliable use case from forecasting how that crop will yield.
Why does NDRE catch crop stress before it's visible?
NDRE, the Normalized Difference Red Edge index, uses the Red Edge band, which penetrates deeper into the leaf canopy than standard red or near-infrared light. That lets it keep responding to falling chlorophyll weeks before a stressed leaf turns visibly pale, which is why it catches nitrogen and water stress earlier than a plain NDVI reading or a visual field check.
For the full picture of how satellite imagery turns into a pre-harvest yield number, see our guide to yield estimation with satellite imagery. For the free macro-level report that already tracks this across major growing regions monthly, see early warning satellite data for wheat sourcing. For how underwriters use the same signals where yield history is missing, see best satellite data for crop risk underwriting. For the full breakdown of NDRE, Red Edge, and the other indices that separate nitrogen from water stress, see nitrogen deficiency vs water stress satellite detection.
Sources and further reading
- Sakamoto, Gitelson, and Arkebauer, MODIS wide dynamic range vegetation index study, corn silking-stage yield correlation
- Peer-reviewed maize study, predictive accuracy by growth stage, tasseling/silking (VT/R1) mean absolute percentage error
- In-season canopy sensor study, NDVI and corn grain yield correlation by V-stage, V8 variance explained
- University of Illinois farmdoc daily, weekly USDA crop condition rating correlation with final corn and soybean yield
- DTN Progressive Farmer, Digital Yield Tour coverage of Gro Intelligence's in-season and end-of-season model accuracy, 2018 and 2021
- SatYield, satellite crop intelligence marketing materials, claimed lead time over USDA WASDE reports
- AgWeb market analysis, limits of satellite imagery for detecting pollination, disease, and weather-driven yield loss
- Kogan, 1995, Vegetation Condition Index methodology
- Risk.net and Energy Aspects, Orbital Insight and Kayrros satellite oil-storage tank-shadow monitoring, tank count and CME Datamine distribution
- XRTech Group, GF-6, SuperView-2, GF-3, and LT-1 satellite specifications
Time your next capture to the growth stage that matters
Order multispectral or SAR tasking timed to tasseling, silking, or pod-set, with instant pricing before you confirm.