Best Satellite Data for Crop Risk Underwriting
On this page
- Why Incomplete Yield Records Are a Real Underwriting Problem
- Multi-Decade Optical Archives for Reconstructing a Baseline
- 01. Landsat and Sentinel-2 for long-term NDVI trends
- 02. Commercial very-high-resolution archives back to 1999
- Regional Wide-Swath Satellites for Yield and Biomass Proxies
- Synthetic Aperture Radar for All-Weather Continuity
- 01. GF-3, C-band SAR
- 02. LT-1, L-band SAR
- Very High-Resolution Imagery for Field-Level Verification
- 01. SuperView-2, field-scale multispectral
- 02. Wyvern and GF-5B, hyperspectral chemical fingerprinting
- Detecting Peril-Specific Crop Damage for Underwriting
- 01. Drought
- 02. Disease and pest outbreaks
- 03. Flood
- 04. Fire
- 05. Hurricane and wind damage
- AI Yield Proxies That Replace Missing Ground Records
- Case Study From Index Insurance Programs Already Doing This
- ACRE Africa and the R4 Rural Resilience Initiative
- Frequently asked questions
- Sources and further reading
A practical guide to the satellite data sources underwriters use to price crop risk when a county's historical yield records are incomplete, the multi-decade optical archives that stand in for missing ground history, the radar and wide-swath satellites that keep that record unbroken through cloud and monsoon, and the real index-insurance programs already running on this exact approach.
Quick answer
When official historical yield records in a county are missing or incomplete, underwriters replace them with multi-decade optical satellite archives, wide-swath regional sensors, all-weather radar, and AI yield models built to work without ground-truth history. Landsat's archive back to 1982 and Sentinel-2 reconstruct a multi-season vegetation baseline in place of missing harvest records, SAR satellites such as GF-3 and LT-1 keep that record unbroken through cloud, haze, and monsoon rain, and biophysical AI models simulate crop growth directly from spectral and weather data rather than learning from a local yield history that does not exist. Real index-insurance programs, including ACRE Africa and the WFP-backed R4 Rural Resilience Initiative, already underwrite millions of smallholder farmers this way.
Why Incomplete Yield Records Are a Real Underwriting Problem
Traditional area-yield index insurance is built on a decade or more of local loss-cost history, actual harvest weights, reported county by county, year after year. That record simply does not exist across most of the smallholder world, and it is frequently incomplete even in mature markets after a boundary change, a new county formation, or a gap in reporting during a conflict or a bad administrative year. An underwriter facing that gap has two bad options without satellite data, price the risk blind using a neighboring county's history that may not transfer, or decline to write the policy at all and leave the farmers in that county uninsured.
- No local baseline to price against. Without a multi-year yield record, there is no objective way to set a trigger or a premium that reflects the county's actual risk.
- Ground verification does not scale. Sending an adjuster to sample crop cuts across every insured field in a data-sparse county is slow and expensive relative to the premium collected.
- Cloud cover and remoteness compound the gap. Many of the counties with the weakest yield records are also the hardest to reach for a field visit and the most affected by monsoon cloud cover during the growing season.
Satellite data closes this gap from a different direction, instead of a ground record built up over years, it reconstructs an objective baseline from the same archive that has already been recording every growing season since long before the policy was written.
Multi-Decade Optical Archives for Reconstructing a Baseline
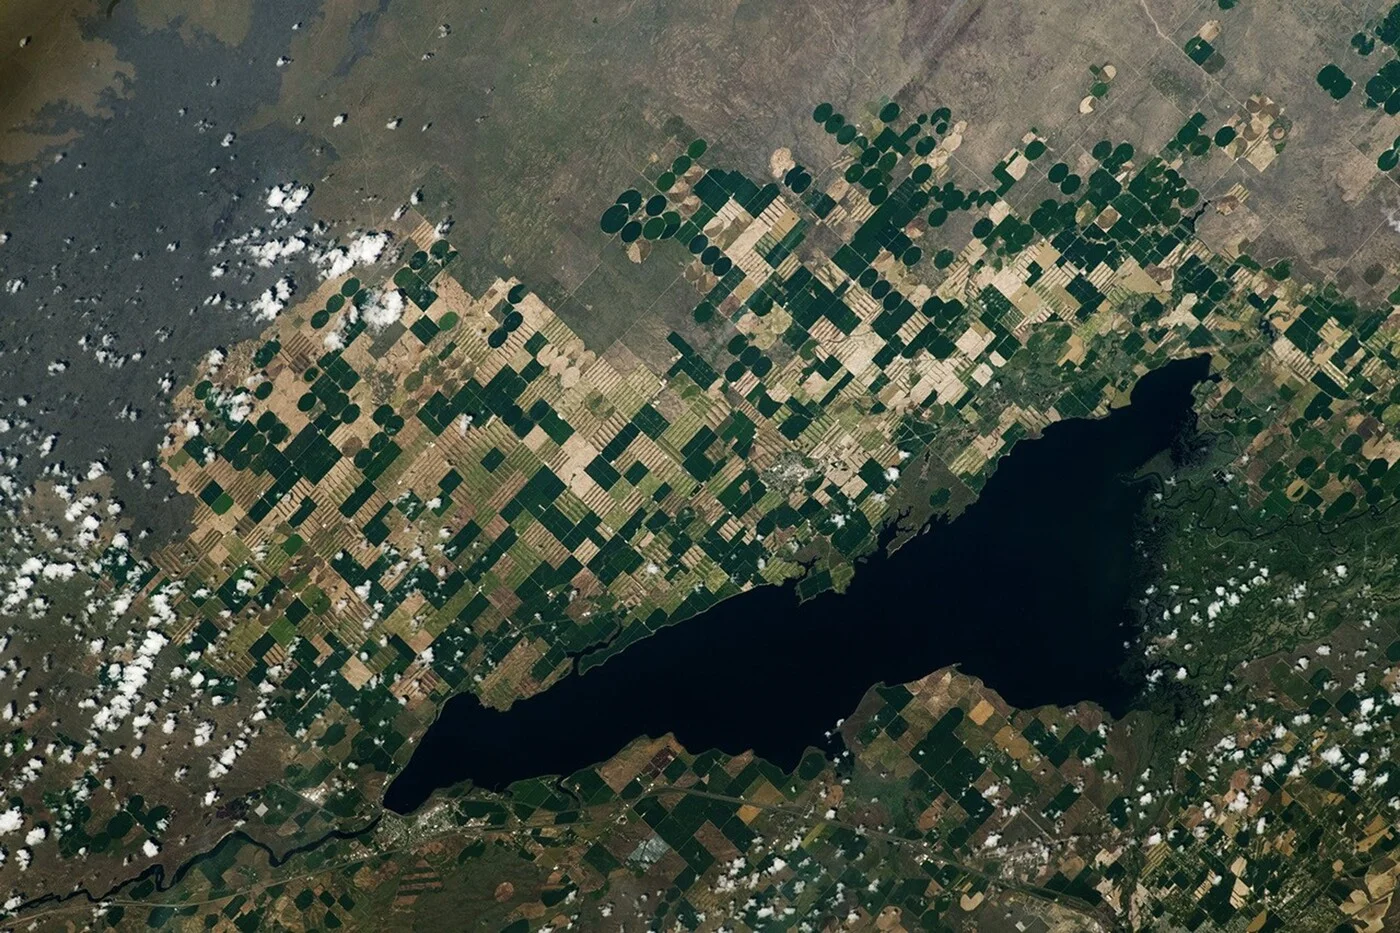
When ground-level yield records are missing, the first substitute is not a new satellite pass but an old one, decades of existing optical imagery that already covers the county whether anyone thought to use it for underwriting or not.
01. Landsat and Sentinel-2 for long-term NDVI trends
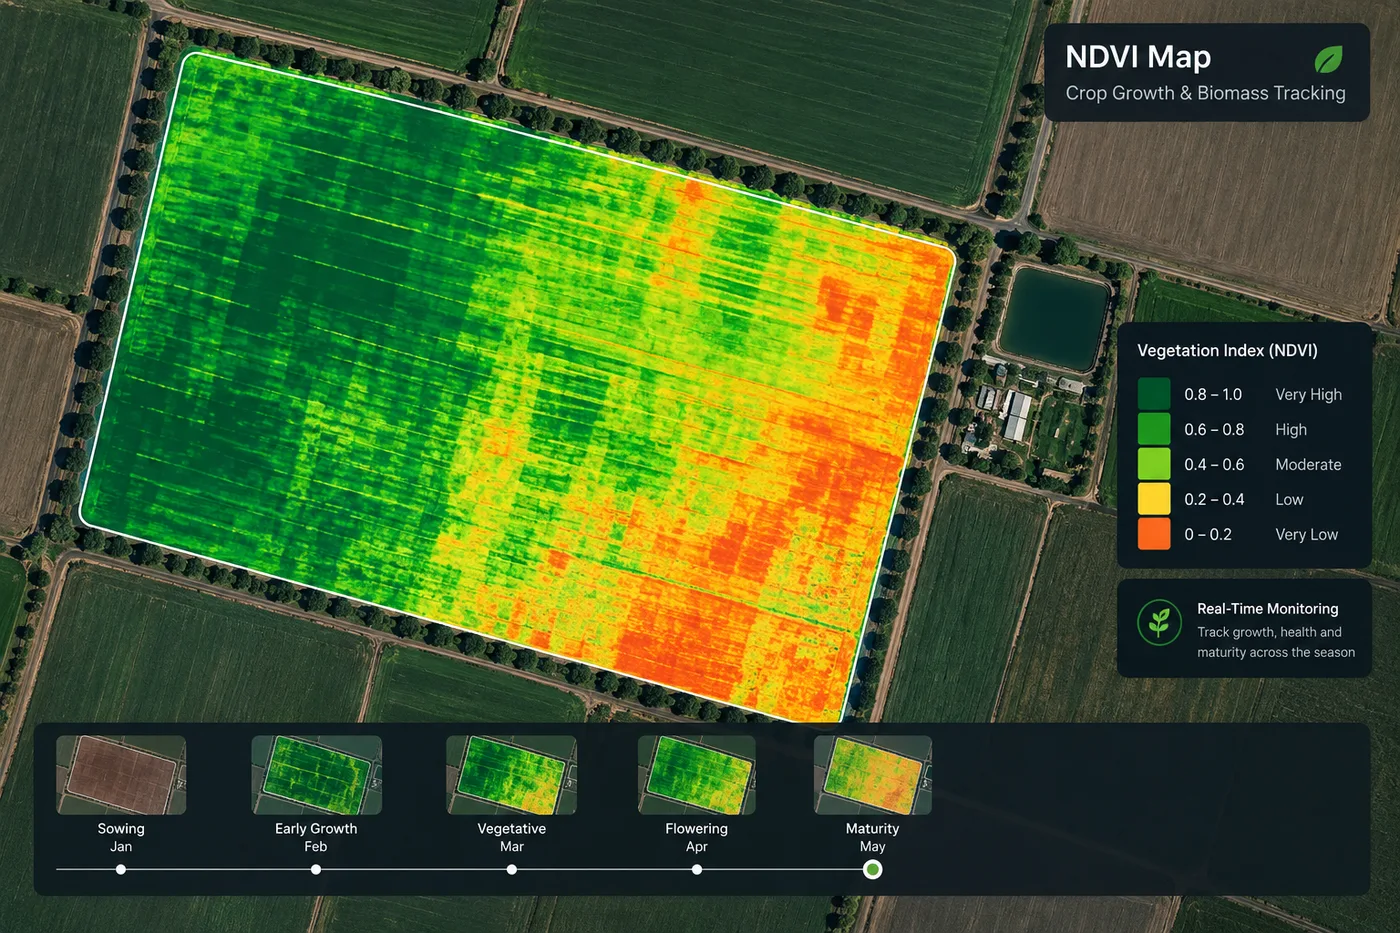
Landsat's freely available archive runs back to 1982, and Sentinel-2 has added a 10 m, 5-day-revisit layer since 2015. Together they let an underwriter calculate a county's NDVI for the same dekad, or 10-day period, across 20 or more growing seasons and turn that into a Vegetation Condition Index, developed by Kogan in 1995, which scales the current season's NDVI against the historical minimum and maximum for that same period of the year. A VCI reading isolates a weather-driven anomaly from the county's normal ecological baseline without requiring a single reported harvest weight, and real index-insurance programs already set payout triggers on exactly this kind of rolling seasonal decline.
02. Commercial very-high-resolution archives back to 1999
Where the question is not a season's vegetation trend but a specific parcel's history, commercial VHR archives extending back to 1999 let an underwriter check whether a field suffered a past flood inundation, soil degradation, or an unauthorized land-use conversion before the policy was written, the same pre-loss verification already used on the claims side and covered in full in our guide to satellite imagery as insurance claims evidence.
Regional Wide-Swath Satellites for Yield and Biomass Proxies
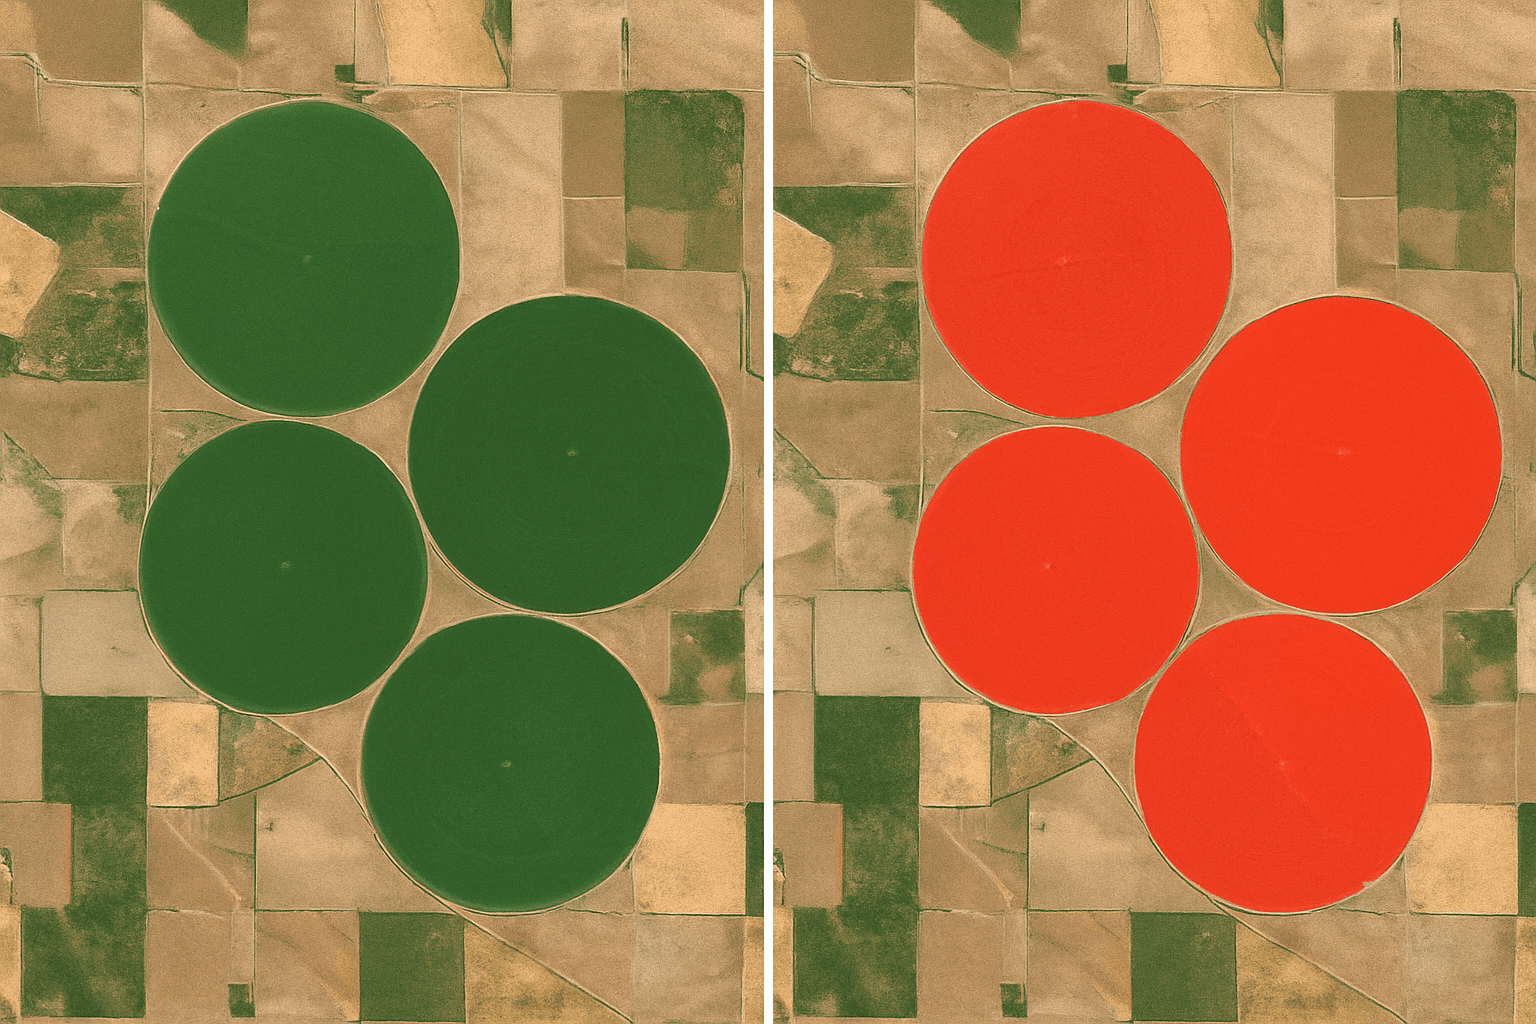
A county-wide risk assessment needs a sensor that can see the whole county in one pass, not a mosaic stitched from dozens of narrow-swath scenes taken on different days.
| Satellite | Swath and resolution | Underwriting role |
|---|---|---|
| CBERS-04 | WFI 73 m, 866 km swath; IRS 40-80 m infrared | Regional biomass tracking and agricultural census modeling |
| CBERS-04A | WFI 60 m, 866 km swath | Faster-revisit regional coverage for the same biomass proxy |
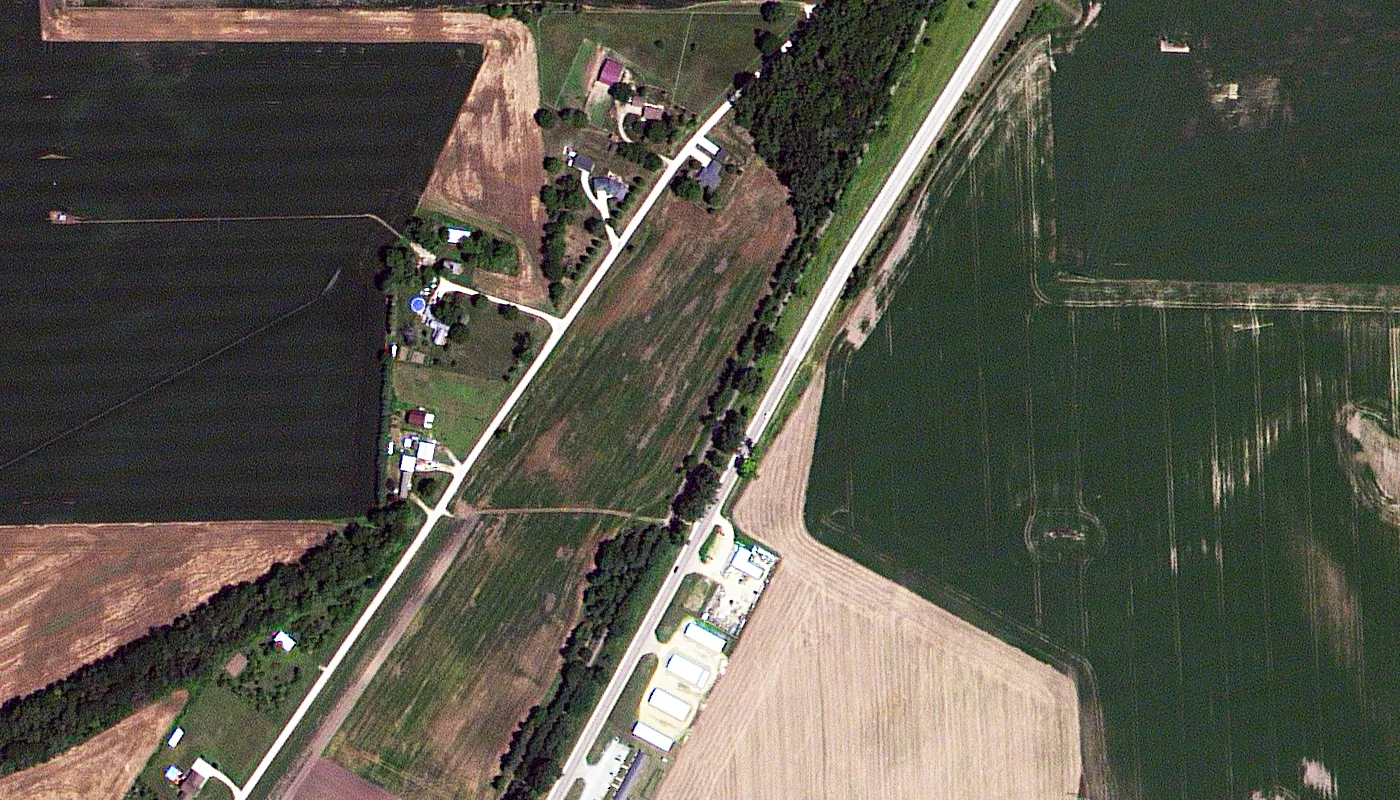
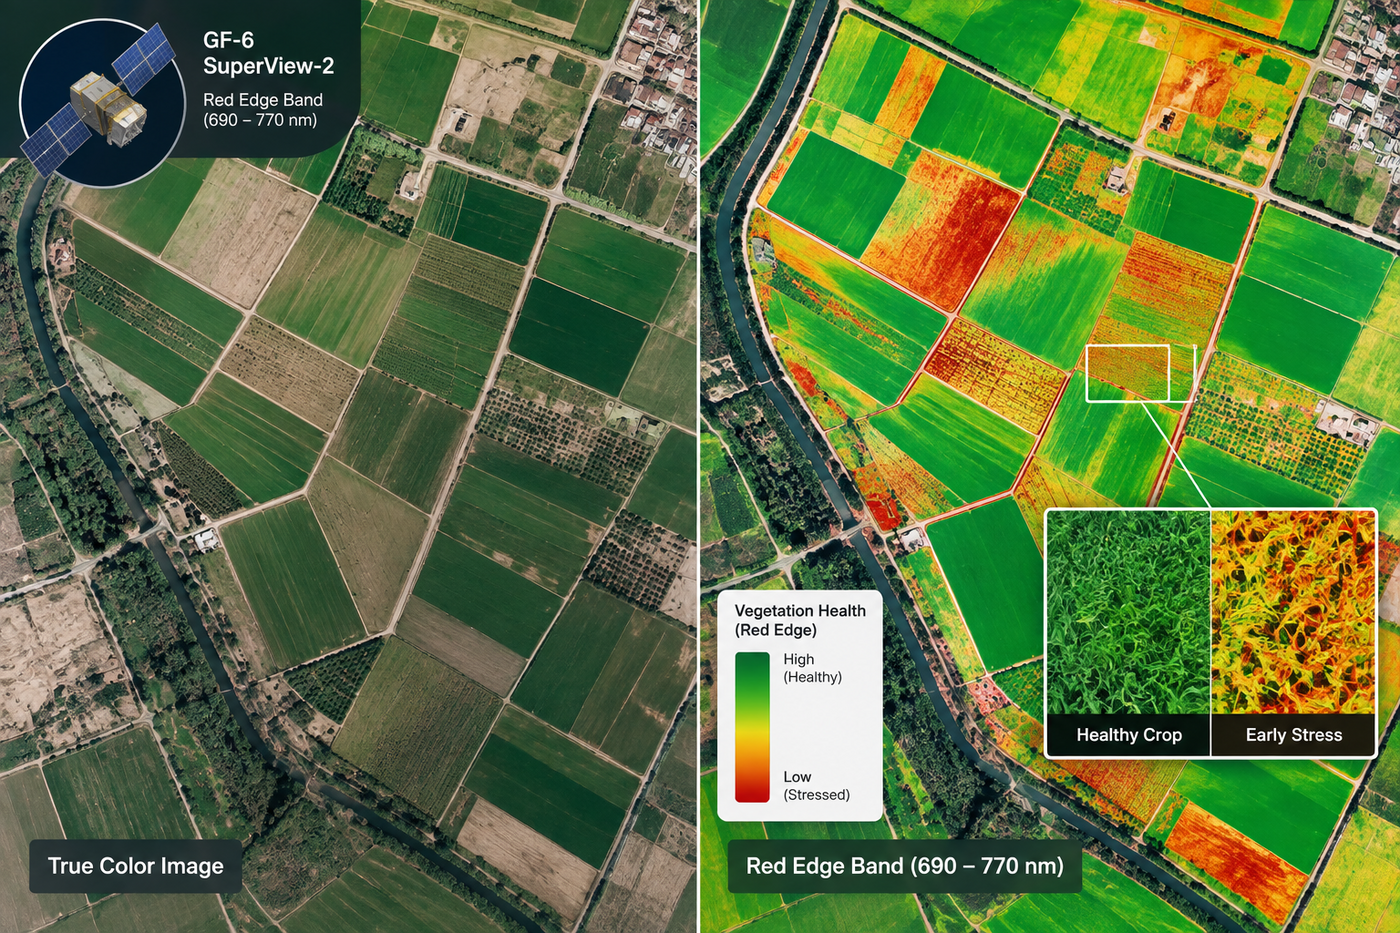
| GF-6 | 8 m MS (90 km swath) or 16 m Wide Field Imager (800 km swath) | Red Edge canopy-stress detection before NDVI saturates |
GF-6's Red Edge bands, at roughly 690 to 770 nm, sit exactly where canopy chlorophyll and leaf structure are most sensitive to stress, which matters because standard NDVI saturates over a dense, healthy canopy and stops showing meaningful change right when early stress most needs catching. A wide-swath Red Edge pass over an entire county flags that stress at a stage a coarser vegetation index would still read as uniformly healthy.
Synthetic Aperture Radar for All-Weather Continuity
A county's growing season does not pause for cloud cover, and neither can the data record an underwriter is relying on. Radar keeps recording when optical sensors cannot see the ground at all.
01. GF-3, C-band SAR
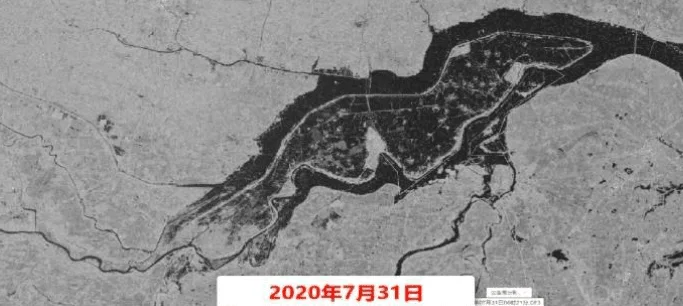
GF-3 carries 12 imaging modes, the most of any SAR satellite in service, ranging from 1 m resolution over a 10 km swath in Sliding Spotlight mode to 500 m resolution across a 650 km swath in ScanSAR mode. Two additional satellites, GF-3B and GF-3C, joined the original in 2021 and 2022, forming a 3-satellite constellation that shortens revisit specifically for the kind of continuous flood-extent and soil-moisture tracking a county-wide underwriting model needs through an entire monsoon season.
02. LT-1, L-band SAR
LT-1, also called Lutan-1, is a two-satellite L-band constellation, LT-1A and LT-1B, launched in early 2022 as the first civil L-band SAR constellation of its kind. It resolves down to 3 m across swaths up to 400 km, and in its dual-satellite formation revisits the same ground every 4 days, against 8 days for a single satellite. L-band's longer wavelength penetrates deeper into vegetation canopy than C-band, adding a second, independent read on soil moisture and canopy structure under exactly the cloud cover that blinds an optical pass.
Very High-Resolution Imagery for Field-Level Verification
A county-level baseline tells an underwriter how the whole region is trending. Confirming what is actually happening on one insured field still needs a sharper look.
01. SuperView-2, field-scale multispectral
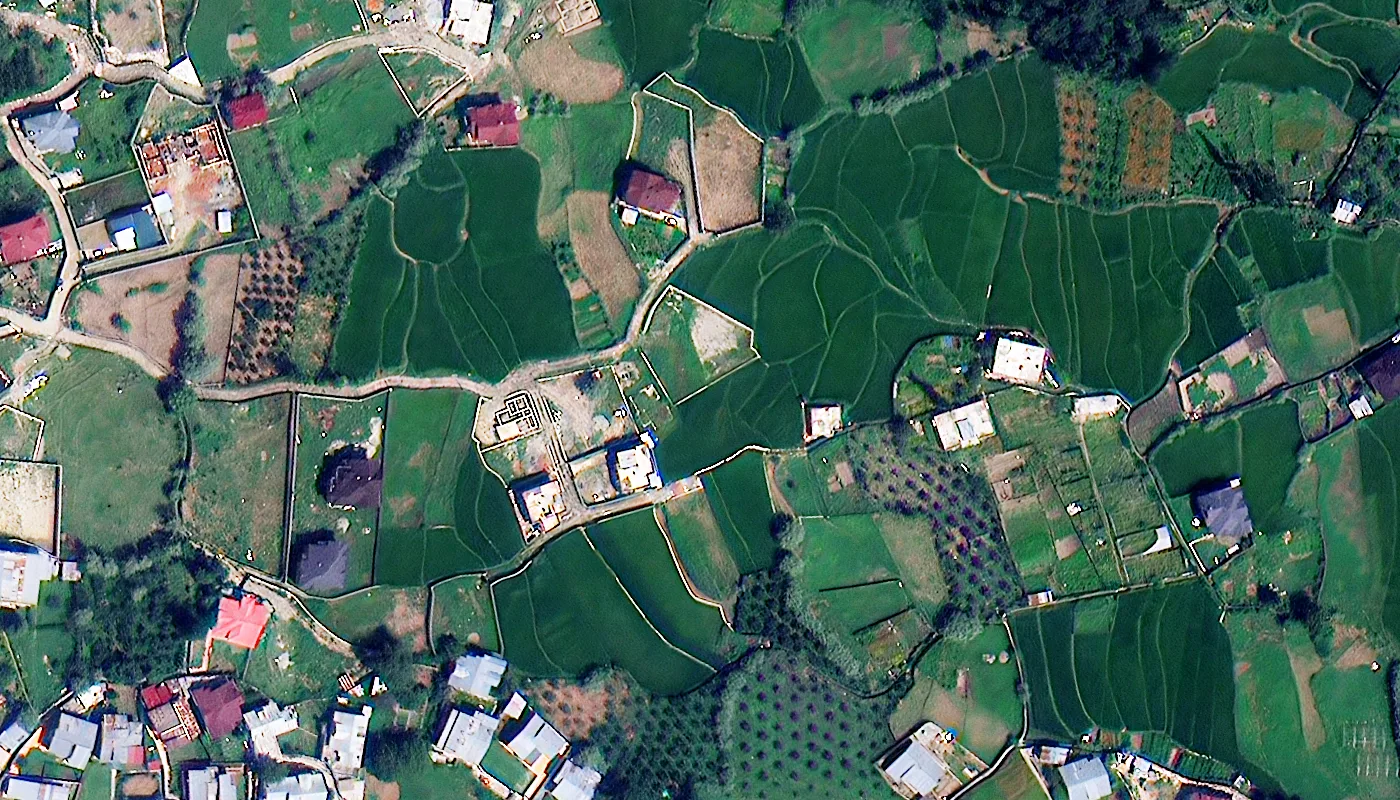
SuperView-2 resolves to 0.42 m panchromatic and 1.68 m multispectral, with a nine-band configuration that adds Yellow, Red Edge, and two near-infrared bands, NIR1 and NIR2, to the standard visible set. That extra band depth is what turns a single high-resolution pass into a field-scale read on soil fertility and early chlorophyll deficit, not just a sharper photograph.
02. Wyvern and GF-5B, hyperspectral chemical fingerprinting
Wyvern's 31-band VNIR sensor and GF-5B's 330-band Advanced Hyperspectral Imager both measure light across hundreds of continuous narrow channels from 400 to 2500 nm, enough to separate soil composition, canopy water content, and nitrogen status from each other rather than lumping them into one general vegetation-health score.
Detecting Peril-Specific Crop Damage for Underwriting
A single yield number hides which peril actually caused the shortfall, and multi-peril crop insurance needs to know the difference, a drought, a disease outbreak, a flood, a fire, and a hurricane each leave a different satellite signature and trigger a different indemnity calculation.
01. Drought
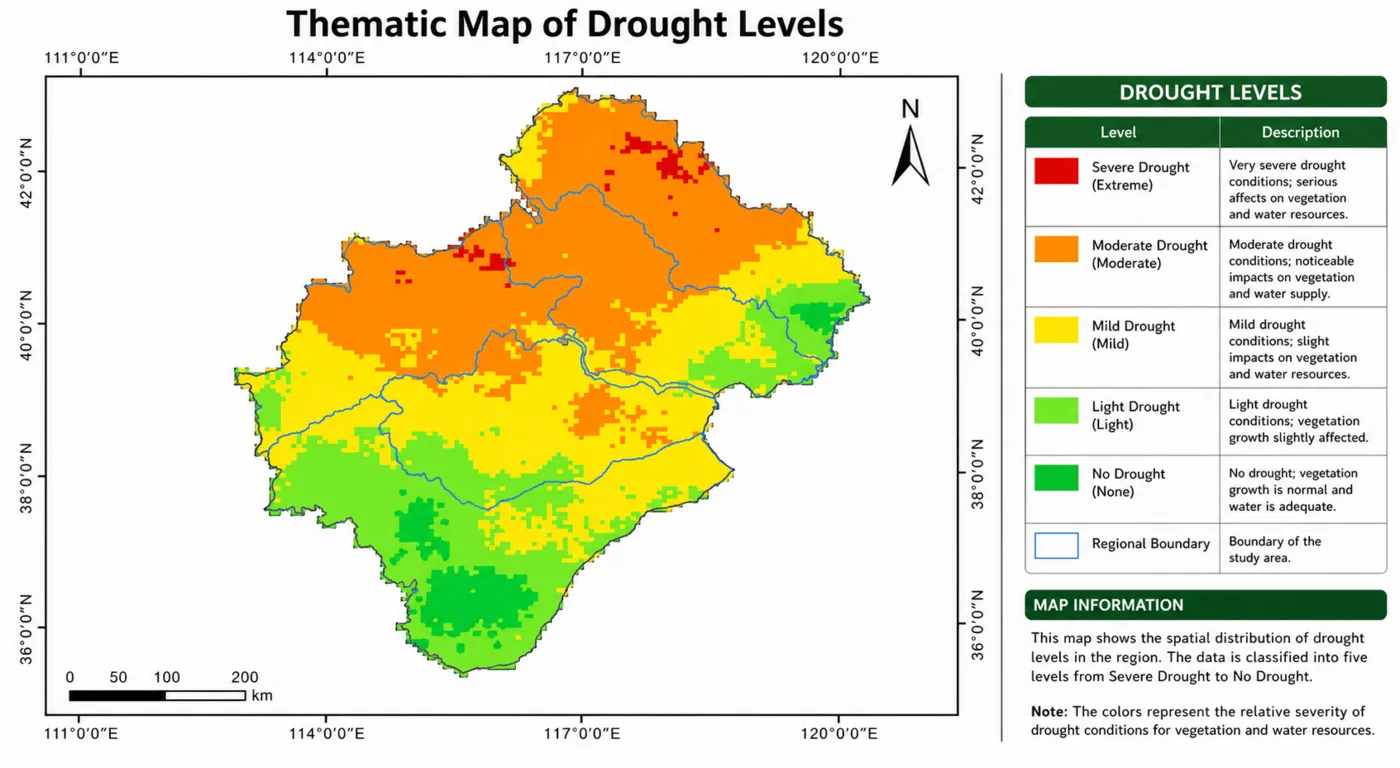
Drought is the peril the Vegetation Condition Index described earlier was built for, a rolling NDVI decline against the multi-decade baseline for that same period of the year, classified into severity bands from light to severe across an entire region in one output.
02. Disease and pest outbreaks
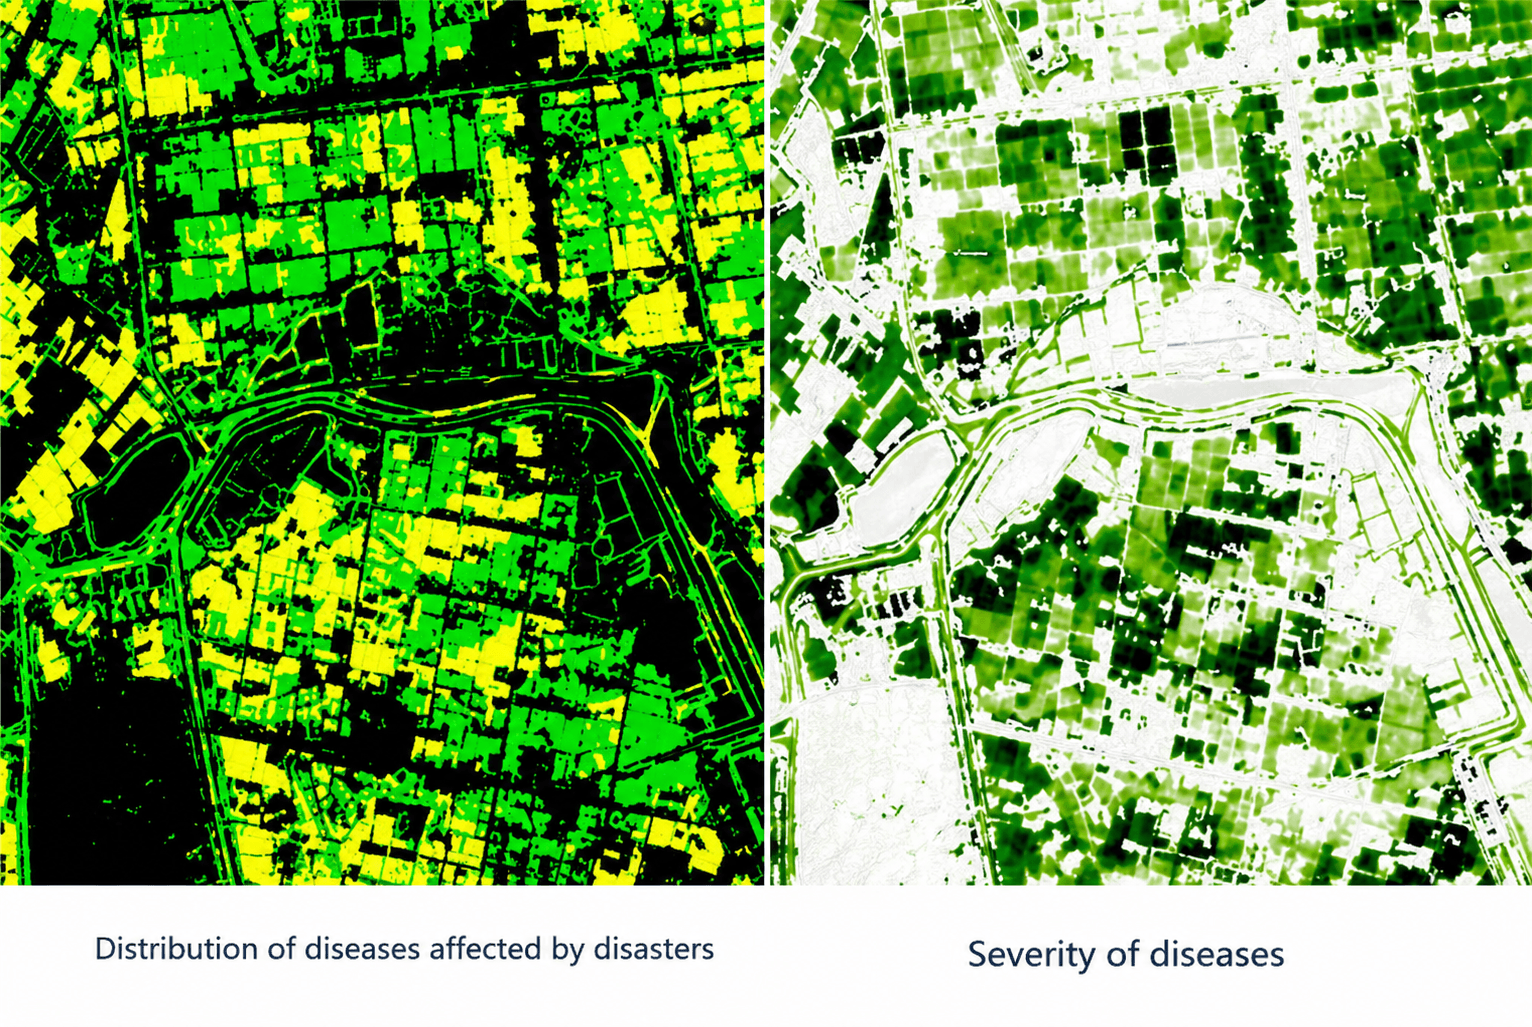
Fungal and bacterial disease, along with pest infestation, show up as a canopy stress signature in the same Red Edge and SWIR bands covered above, before the damage is visible to the eye, and AI classification models turn a scene into a mapped severity distribution across every field in a district at once. The full mechanism, spectral bands, and vegetation indices behind this detection are covered in our guide to satellite imagery for crop stress and disease detection, and telling that signature apart from drought or a nutrient deficiency in the first place is covered in our guide to diagnosing crop stress in satellite imagery.
03. Flood
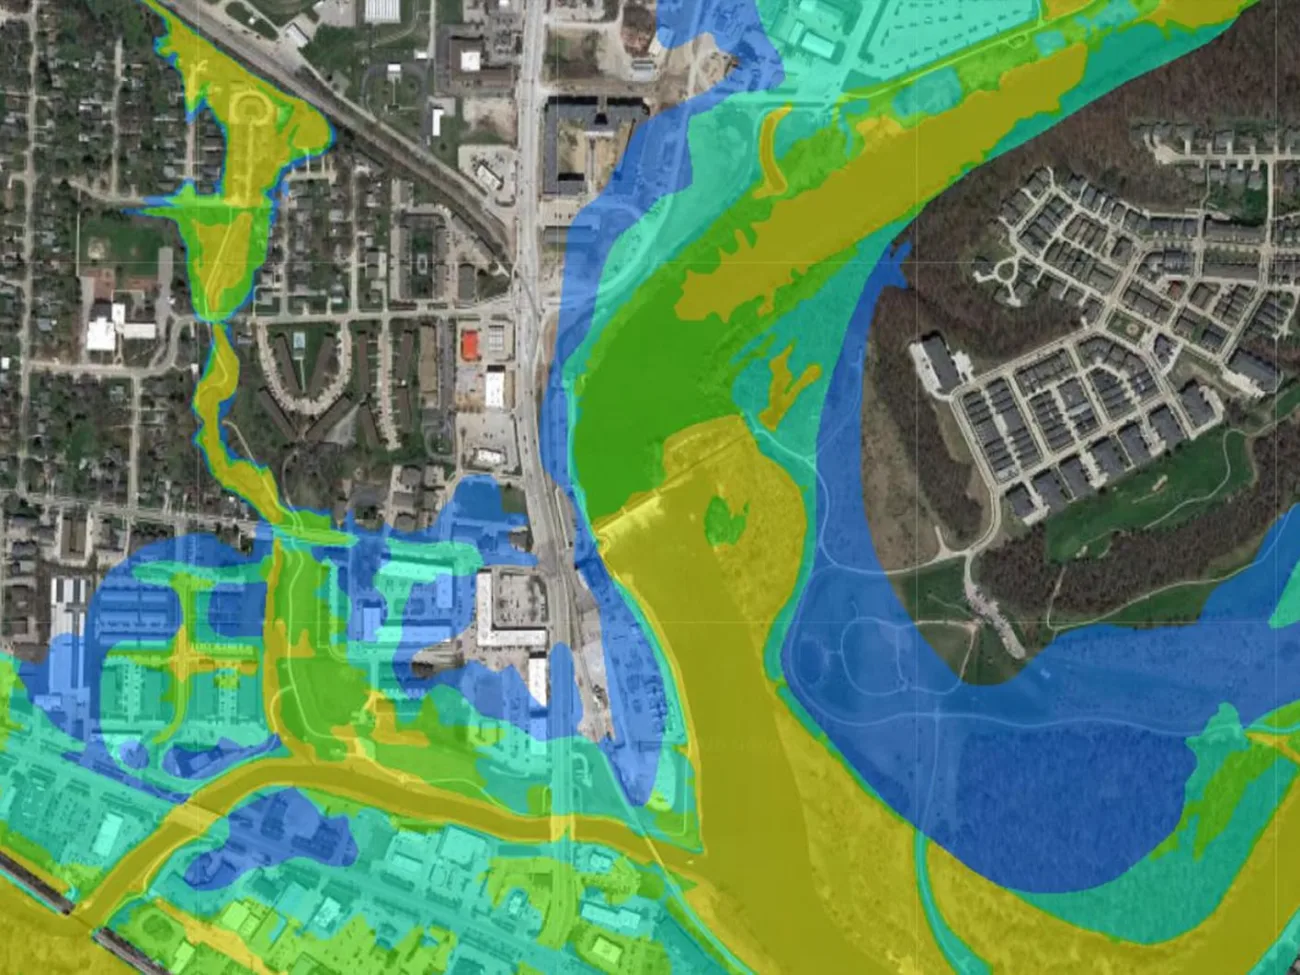
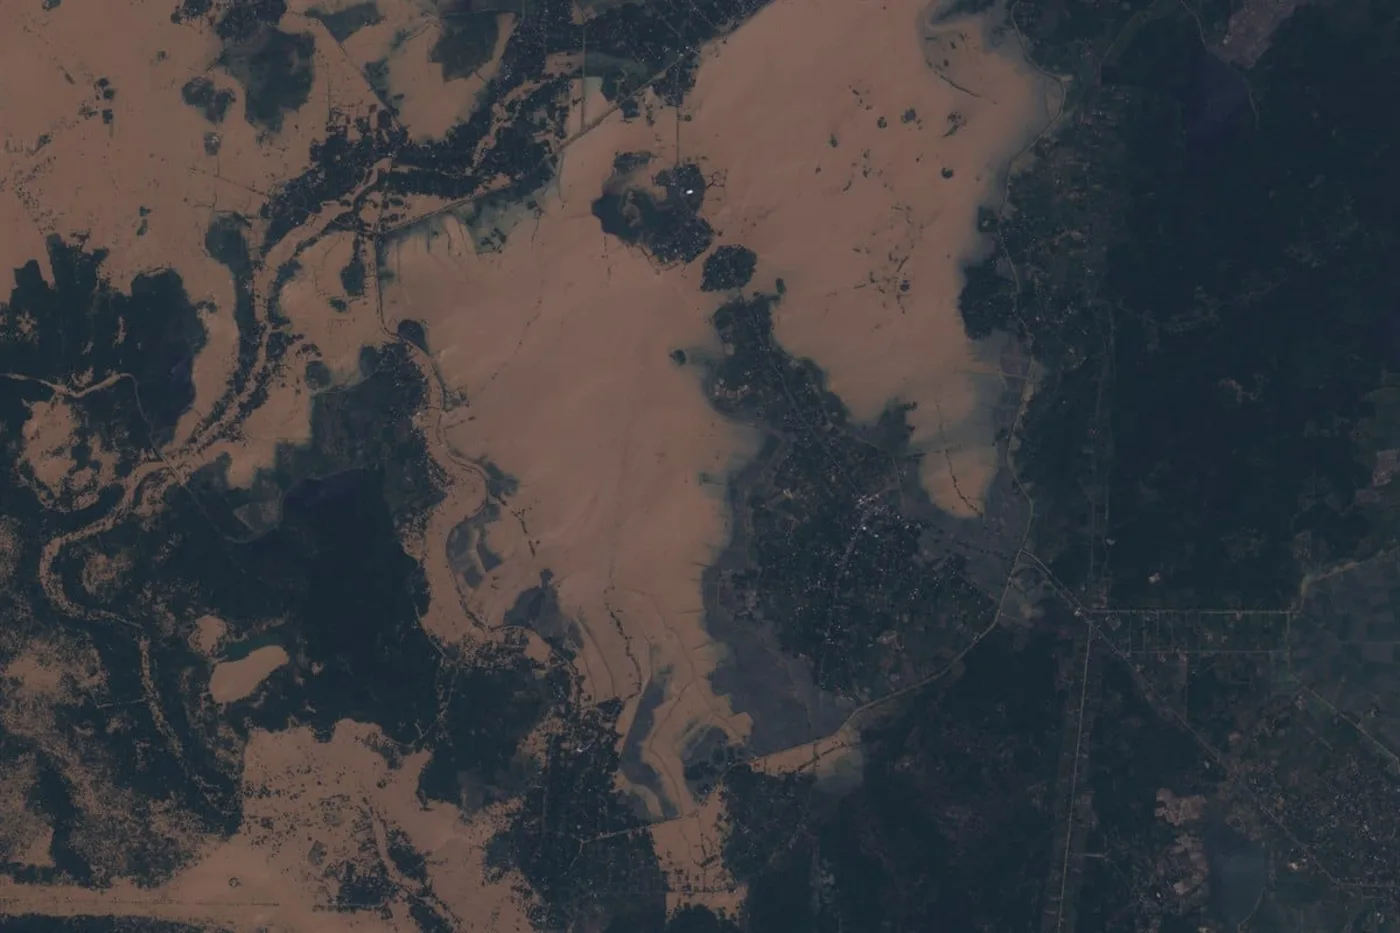
SAR, the same GF-3 and LT-1 constellations covered above, extracts a flood's exact waterline through the storm clouds that caused it, and an inundation-depth model built on that extent turns directly into an indemnity calculation, since the fraction of an insured field actually underwater is the number the payout depends on.
04. Fire
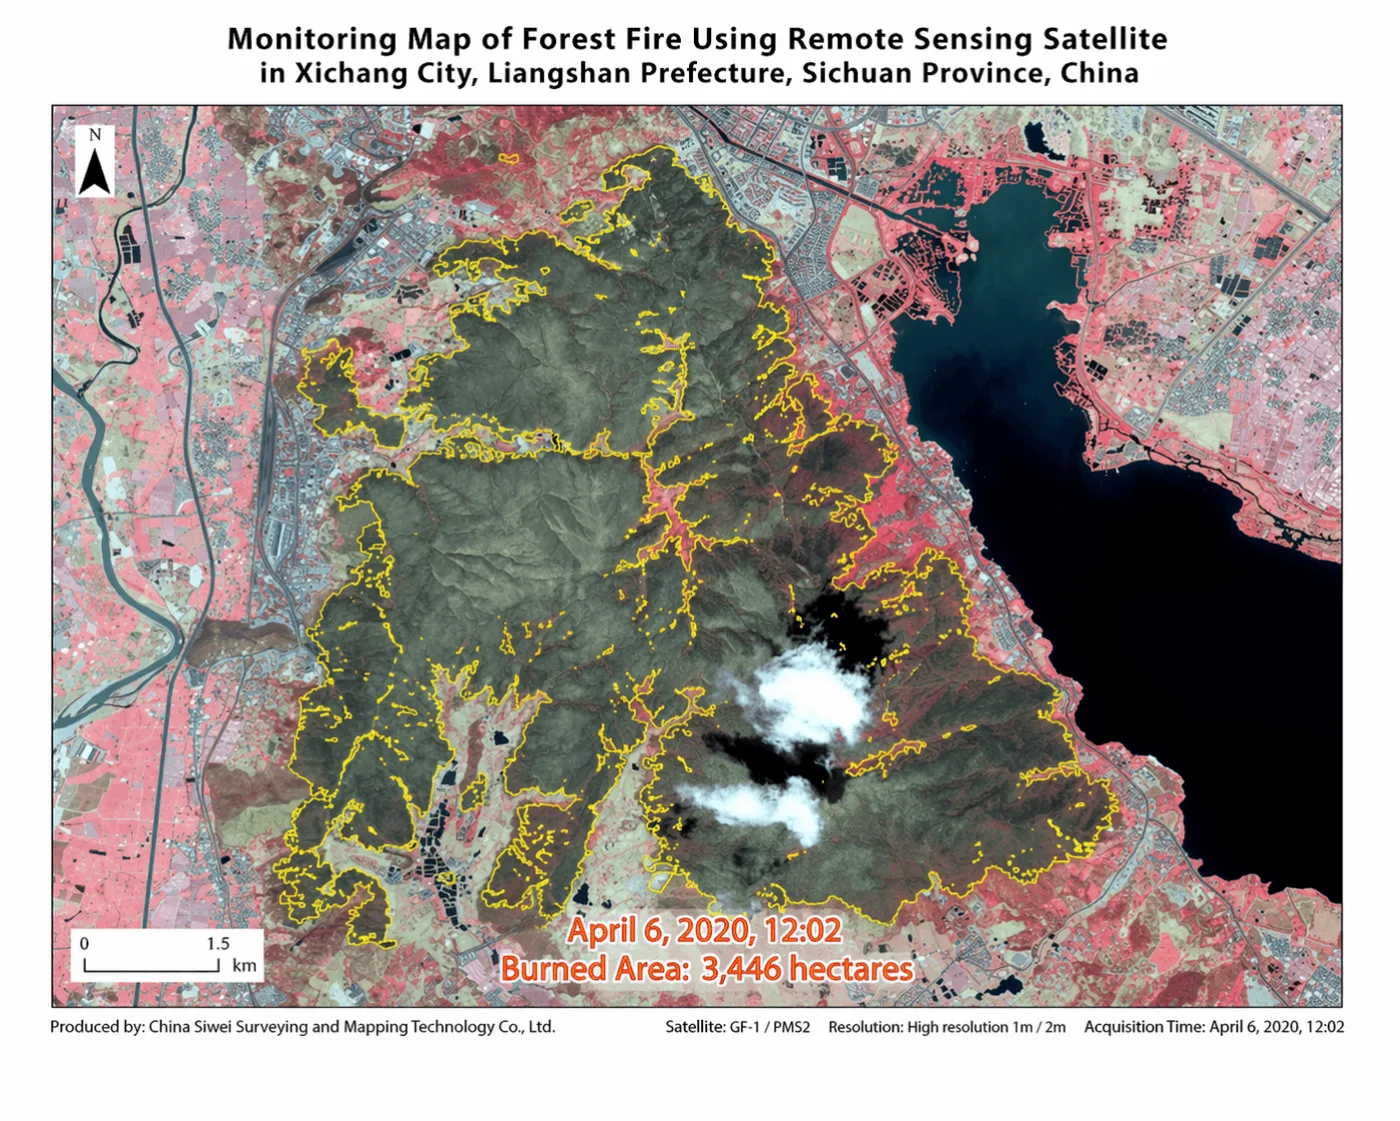
A burned-area boundary drawn from a post-fire satellite pass gives an exact hectare count instead of an estimate, the same method that mapped a 3,446-hectare burn scar around Xichang, China, in 2020 at 1 to 2 m resolution the day after the fire moved through.
05. Hurricane and wind damage
A hurricane rarely damages a crop through wind alone, storm surge and rainfall-driven flooding usually do the larger share of the damage, and the same SAR-derived inundation mapping used for a river flood applies directly to a coastal or riverine flood a cyclone leaves behind. Wind-flattened, or lodged, cereal crops also change how a field scatters radar return, giving SAR an independent read on wind damage even where no flooding occurred at all.
AI Yield Proxies That Replace Missing Ground Records
Every source above feeds a model, and the model is what actually replaces the missing yield record. Two different modeling approaches exist, and only one of them works when a county has no yield history at all.
- Statistical models learn the relationship between spectral signals and yield from years of local ground-truth harvest data, which is exactly the input a data-sparse county does not have.
- Biophysical models simulate crop growth directly from spectral, weather, and soil inputs using known plant-physiology relationships, so they can generate a defensible yield estimate even where no local yield history exists to train against.
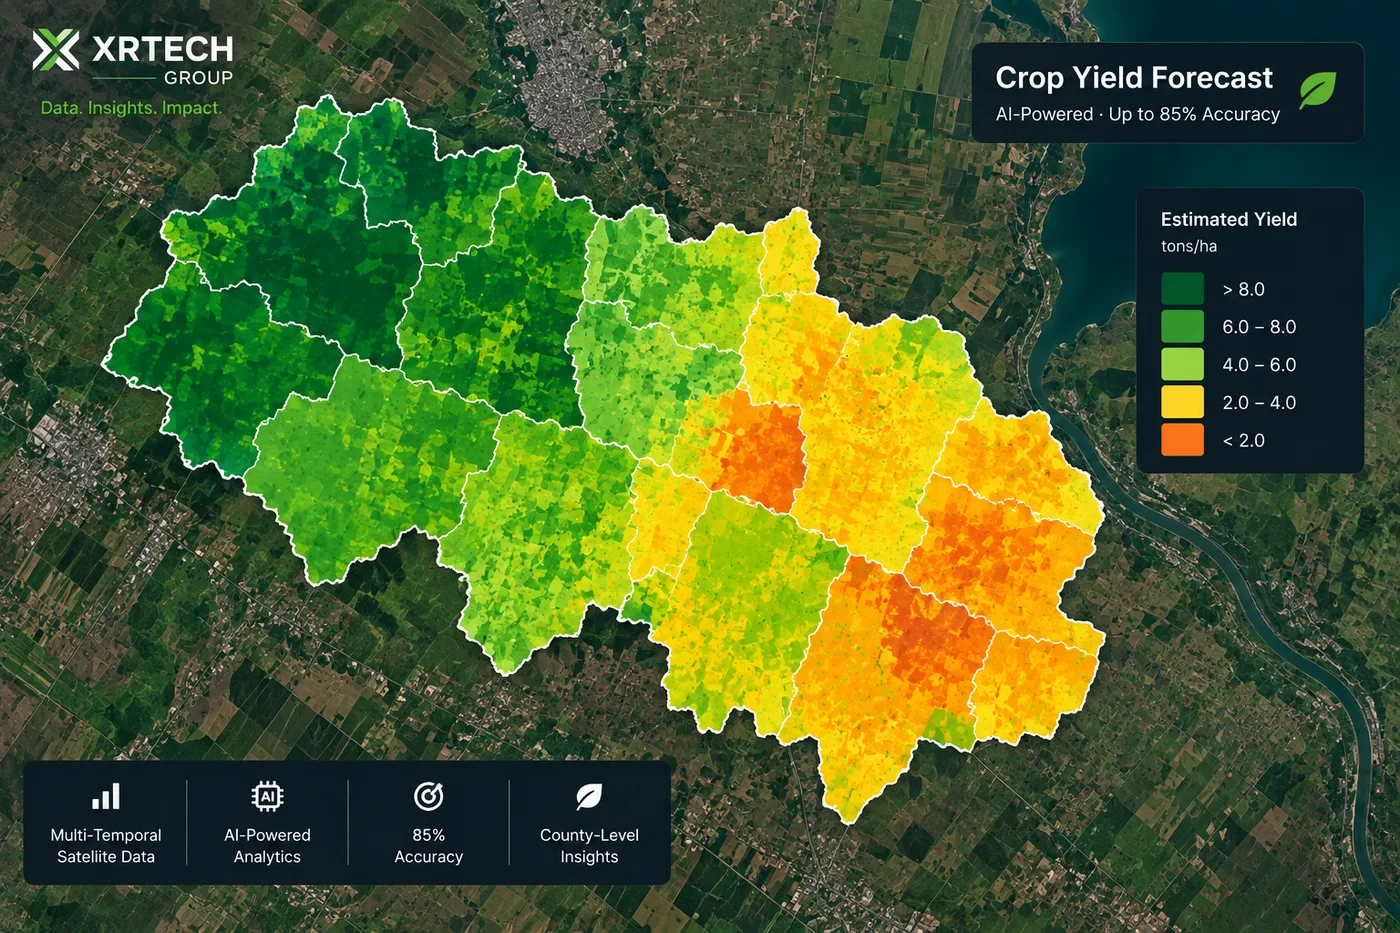
Recent published results show how far that spectral signal alone can carry a yield estimate. A 2026 study combining satellite solar-induced fluorescence with meteorological data explained 78% of the variance in county-level corn and soybean yields across the US Midwest, and switching from standard vegetation indices to solar-induced fluorescence improved drought-related yield-loss detection by 23%. A separate multi-modal deep learning model fusing Landsat, climate, and soil data across more than 70 crop types in California reached an R-squared of 0.76. The general accuracy ceiling for AI-driven yield models once enough ground-truth data exists to train against, up to roughly 85% at the county level, is covered in full in our guide to yield estimation with satellite imagery, the figures above are specifically what a model can still achieve without that local training data.
Underwriting a county with thin yield data?
Search our multi-decade optical, SAR, and hyperspectral archive over your area of interest, or request a custom NDVI baseline and yield-proxy workup. No account needed for a first estimate.
Case Study From Index Insurance Programs Already Doing This

ACRE Africa and the R4 Rural Resilience Initiative
ACRE Africa underwrites smallholder farmers in Kenya and neighboring markets using satellite monitoring in place of the individual farm-level yield history those farmers have never had recorded, with mobile-money payouts settled automatically once a satellite-derived trigger is met. Kenya's agricultural insurance premiums reached roughly $15.7 million in 2025, up from about $9.2 million in 2024, with roughly $1.6 million in claims already settled that year. The WFP and Oxfam America-backed R4 Rural Resilience Initiative runs the same NDVI-based index approach across 10 African countries, targeting 1.4 million households, about 7.5 million people, across 25 countries by 2025. In the driest program areas, Senegal, Mali, Ethiopia, northern Nigeria, and northeastern Kenya, satellite NDVI is the primary index used with no rainfall gauge network required at all, while wetter program countries blend it with rainfall data.
- Satellite NDVI substitutes entirely for missing farm-level yield history in the driest program regions
- Payout triggers run on a rolling seasonal decline, commonly a drop of around 30% from the multi-year norm for that period
- Mobile-money integration settles a claim automatically once the satellite trigger fires, without a field adjuster visiting every farm
Key takeaways
- A county's missing yield history gets reconstructed from Landsat's archive back to 1982 and Sentinel-2, turned into a Vegetation Condition Index that benchmarks the current season against decades of the same dekad.
- Wide-swath satellites such as CBERS-04/04A and GF-6 cover an entire county in one pass, and GF-6's Red Edge bands catch canopy stress before standard NDVI saturates.
- SAR satellites GF-3 and LT-1 keep the record unbroken through cloud and monsoon, GF-3 with 12 imaging modes down to 1 m, LT-1 with L-band's deeper canopy penetration on a 4 to 8 day revisit.
- Biophysical AI yield models, unlike statistical ones, can generate a defensible estimate with no local ground-truth history at all, recent published models explain 76 to 78% of yield variance from spectral and weather data alone.
- ACRE Africa and the R4 Rural Resilience Initiative already underwrite millions of smallholder farmers this way, with satellite NDVI as the sole index in the driest, least-recorded regions.
- Drought, disease, pest, flood, fire, and hurricane damage each leave a distinct satellite signature, a rolling NDVI decline, a Red Edge stress anomaly, a SAR-mapped waterline, a burned-area boundary, or a radar backscatter change from wind-lodged crops, so a multi-peril model needs more than one sensor to tell them apart.
Frequently asked questions
What satellite data is most reliable for underwriting crop risk with incomplete yield records?
A combination is most reliable, multi-decade optical archives from Landsat and Sentinel-2 to reconstruct a vegetation baseline, wide-swath regional satellites such as CBERS-04 and GF-6 for county-wide biomass tracking, SAR satellites such as GF-3 and LT-1 for all-weather continuity, and very-high-resolution or hyperspectral imagery for field-level verification. AI yield models then fuse all four into a single risk estimate.
How do insurers build a yield baseline without historical records?
They use decades of existing satellite imagery the county was already covered by, calculating a Vegetation Condition Index that compares the current season's NDVI to the historical minimum and maximum for the same period of the year across 20 or more growing seasons. This produces an objective baseline without requiring a single reported harvest weight.
What is the Vegetation Condition Index and how is it used in crop insurance?
The Vegetation Condition Index, developed by Kogan in 1995, scales a location's current NDVI against its own historical minimum and maximum for the same dekad, isolating a weather-driven anomaly from the normal seasonal baseline. Real index-insurance programs set payout triggers directly on this kind of rolling decline, commonly around a 30% drop from the multi-year norm.
Why is SAR important for crop risk underwriting?
Synthetic Aperture Radar transmits its own microwave signal and reads the return regardless of cloud cover, haze, or darkness, which matters because the growing seasons and disaster events an underwriter most needs data on, monsoon rains and storm damage, are exactly when optical satellites are most likely to be blocked by cloud.
Can satellite-based index insurance work without any ground yield data at all?
Yes. Programs such as ACRE Africa and the R4 Rural Resilience Initiative already underwrite smallholder farmers in Senegal, Mali, Ethiopia, northern Nigeria, and northeastern Kenya using satellite NDVI as the sole index, with no rainfall gauge network or farm-level yield history required.
What resolution satellite imagery is used to verify individual field-level crop risk?
Very-high-resolution sensors such as SuperView-2, resolving to 0.42 m panchromatic and 1.68 m multispectral with Red Edge and dual near-infrared bands, and hyperspectral sensors such as Wyvern and GF-5B, sampling hundreds of narrow bands from 400 to 2500 nm, are used to verify soil fertility, early chlorophyll stress, and canopy water content on a specific insured field.
How accurate are satellite-based crop yield estimates without local training data?
Recent published biophysical models, which do not require local ground-truth history, explain 76 to 78% of yield variance using spectral and weather data alone. Once enough local ground-truth data exists to train a statistical model, accuracy rises further, up to roughly 85% at the county level, covered in full in our guide to yield estimation with satellite imagery.
What does satellite-based crop insurance underwriting cost compared to traditional methods?
Exact figures vary by provider and program, but satellite-based crop-cutting integration is reported to cut manual sampling costs by roughly 40% and detect a loss event within about 48 hours, compared to up to two weeks for a traditional manual adjustment cycle.
What crop perils can satellite imagery detect for insurance underwriting?
Drought shows up as a rolling NDVI decline against a multi-decade baseline, disease and pest outbreaks appear as a Red Edge or SWIR canopy stress signature before visible symptoms, flood and hurricane-driven inundation get mapped by SAR as an exact waterline and depth model, fire damage is drawn as a precise burned-area boundary from a post-fire pass, and wind-flattened crops change how a field scatters radar return even without flooding. Each peril leaves a distinct signature, so a multi-peril underwriting model combines several of these sensors rather than relying on one.
Sources and further reading
- USGS Landsat archive specifications, continuous coverage since 1982
- ESA Copernicus, Sentinel-2 mission specifications, resolution, and revisit cycle
- Kogan, F., 1995, and subsequent literature, Vegetation Condition Index methodology for drought and vegetation anomaly monitoring
- eoPortal, Gaofen-3 (GF-3) and LT-1 / Lutan-1 SAR constellation mission specifications
- World Food Programme, R4 Rural Resilience Initiative program data
- ACRE Africa and Kenya agricultural insurance market reporting, 2025-2026
- 2026 peer-reviewed studies on satellite solar-induced fluorescence and multi-modal deep learning for county-level crop yield estimation
Need a risk baseline for a data-sparse county?
Get an NDVI historical baseline, SAR-based flood and moisture record, and AI yield proxy over your area of interest, no local yield history required. No account needed to get a first estimate.