Access Portal

Home › Solutions › Oil & Gas

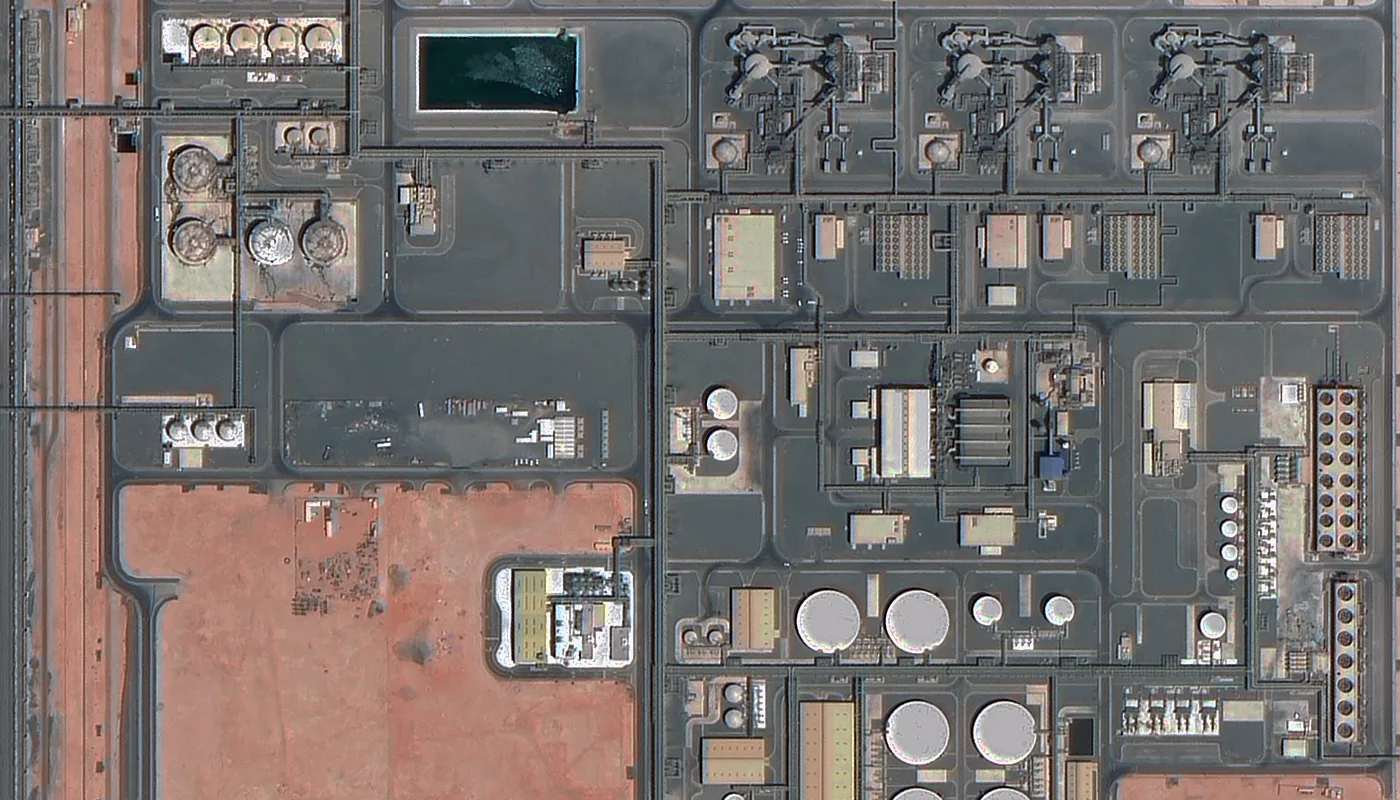
High-resolution satellite imagery of an oil and gas processing facility
SATELLITE MONITORING FOR OIL & GAS

Satellite Imagery for Oil & Gas Monitoring

Monitor pipelines, well pads, refineries, and storage terminals with high-resolution optical, SAR, and other satellite data. Track construction, flag encroachment and spills early, and prioritize inspections across upstream, midstream, and downstream assets.

Overview

XRTech Group delivers satellite imagery for oil and gas operators worldwide on a single platform, one source of optical, SAR, hyperspectral, and DEM data spanning upstream exploration, midstream pipeline networks, and downstream refining, storage, and shipping, from first survey through emergency response.

AI-annotated satellite imagery of a coastal refinery and tank farm complex

What is satellite imagery used for in oil and gas?

Satellite imagery is used in the oil and gas industry to monitor remote assets, including pipelines, well pads, refineries, storage facilities, and the land around them. Comparing optical, SAR, hyperspectral, and DEM imagery captured over time helps operators identify construction activity, encroachment, ground movement, environmental change, and oil spills, so field teams can prioritize where an on-site inspection is actually needed. For the sensor-by-sensor mechanics behind pipeline-specific monitoring, including InSAR deformation thresholds and methane detection, see our guide to oil and gas pipeline monitoring with remote sensing.
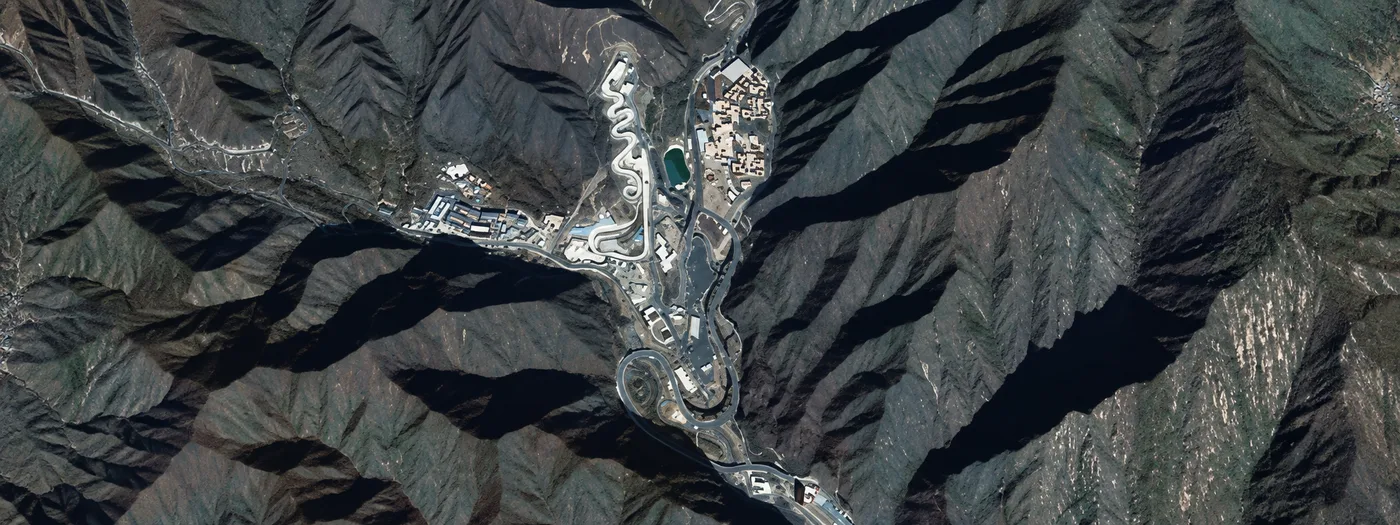
Satellite imagery of a remote facility and access roads across mountainous terrain

How Satellite Imagery Supports the Oil & Gas Lifecycle

Satellite imagery supports the oil and gas lifecycle from upstream exploration through midstream transport to downstream refining, storage, and emergency response.

  1. Upstream — Exploration, well pad siting, and early construction tracking
  2. Midstream — Pipeline corridor monitoring, encroachment, and ground movement
  3. Downstream — Refinery, storage tank, and terminal monitoring
  4. Environmental — Oil spill detection, methane monitoring, and land or vegetation change
  5. Emergency Response — Fire, flooding, and disaster-response tasking
25cmHighest optical resolution
±3mDEM vertical accuracy (RMSE)
<24 HrsDisaster-response imagery
90+ / 4 DaysScenes in past spill emergencies

Solutions

Satellite-Based Solutions for Oil & Gas Operations

From exploration to emergency response, satellite data and AI analytics support every stage of the asset lifecycle.
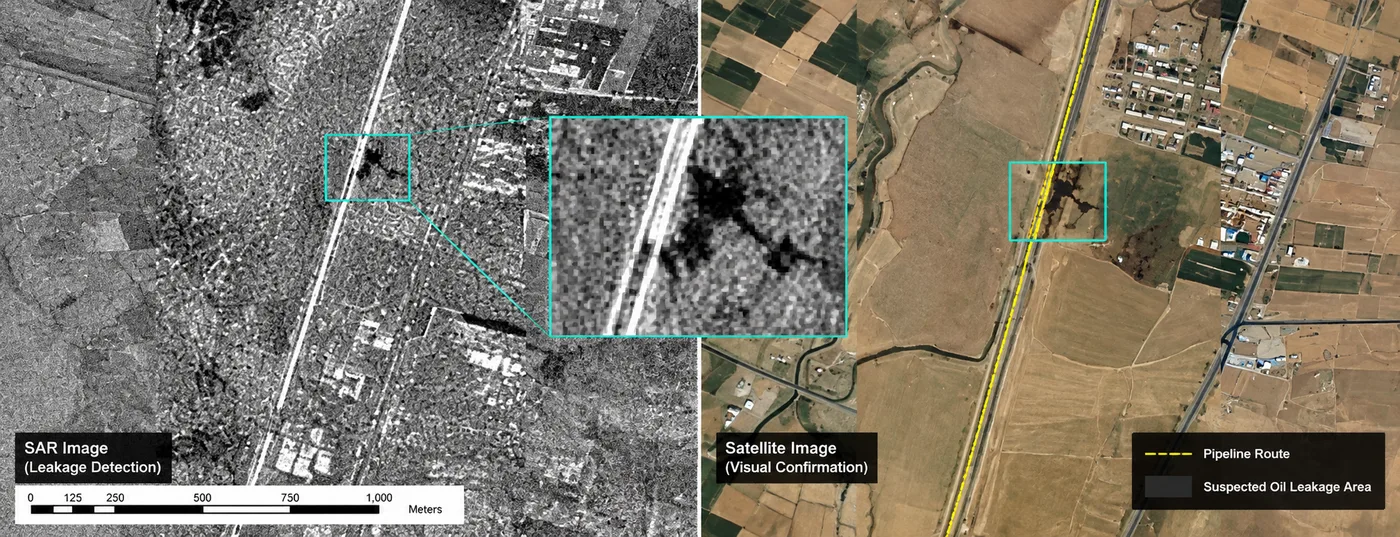
SAR and satellite imagery used to detect and visually confirm a suspected oil pipeline leakage area

Pipeline shows as a highlighted linear feature; oil leakage appears as dark patches connected to the pipeline, pinpointing leak points and spill extent.

01 — SOLUTION

Pipeline Monitoring With Satellite Imagery

Pipeline networks spanning vast or remote terrain are continuously watched using multi-source remote sensing and AI analytics.
  • Millimeter-Level Deformation (InSAR): LT-1 SAR and GF-3 SAR detect ground movement, land subsidence and soil shifts along pipeline corridors, including buried and seabed sections, before structural failures occur.
  • Geological Disaster Risk Monitoring: Landslide susceptibility and terrain-stability mapping along the pipeline route flags geohazard-prone segments so at-risk sections get inspected before a slope failure damages the line.
  • Encroachment & Construction Detection: Automated AI change detection flags unauthorized third-party activity, new access roads, or illegal building encroachment inside pipeline buffer zones, securing the corridor perimeter.
  • Multi-Data Sensor Fusion: High-resolution optical imagery for visual inspection is combined with all-weather SAR radar for persistent surveillance through cloud, haze, or rain.
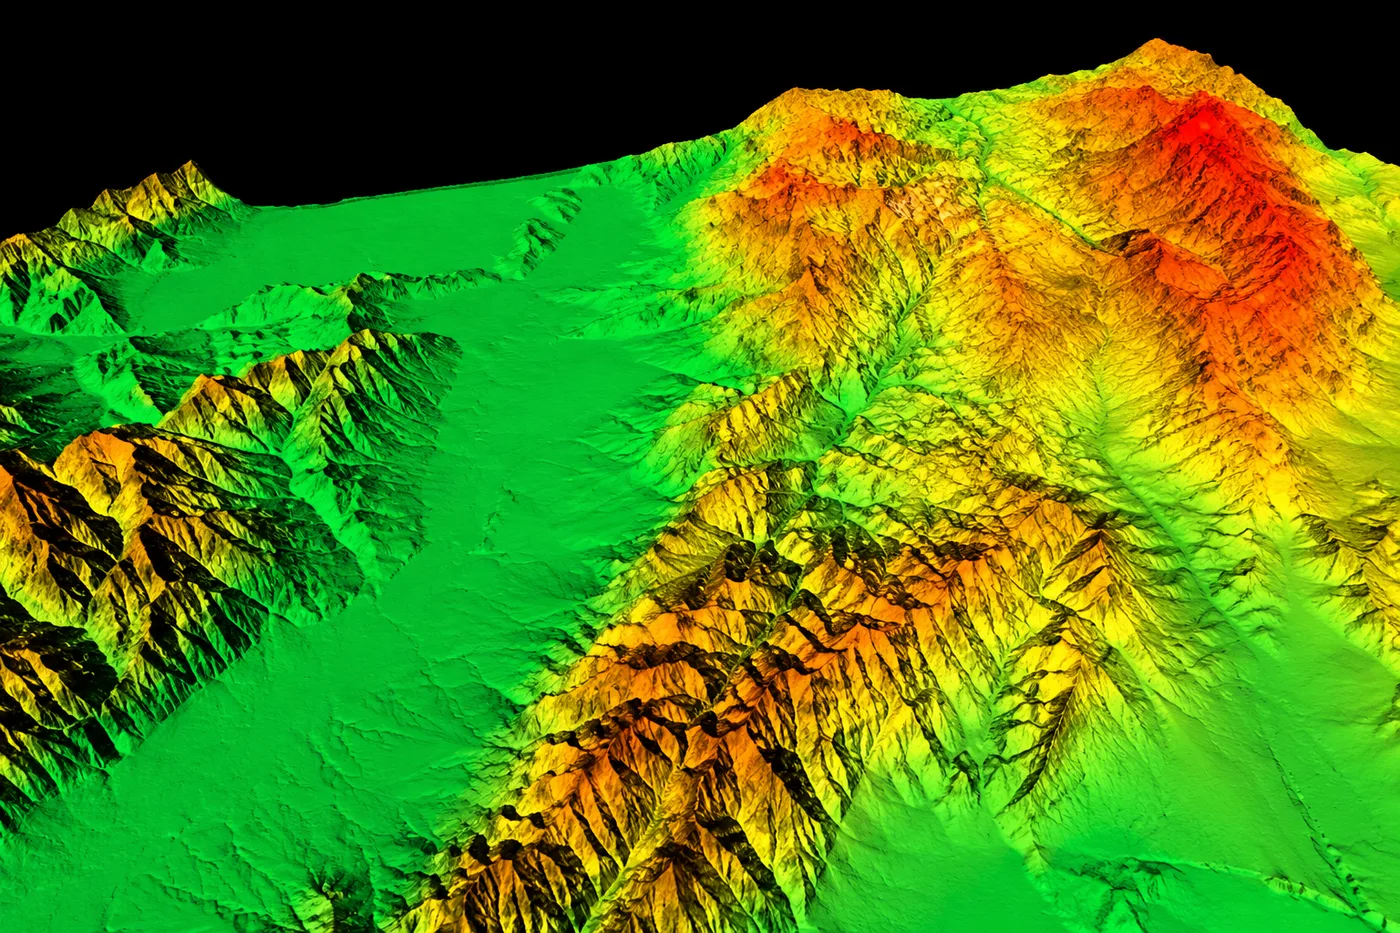
Digital Elevation Model (DEM) of terrain surrounding an oil and gas site, used for 3D area modeling
02 — SOLUTION

Exploration & Site Selection With Satellite Imagery

Before breaking ground, satellite imagery provides surface information that supports early-stage geological and logistical planning, not a way to see underground reserves directly.
  • 3D Area Modeling: Digital Orthophoto Maps combined with DEM/DSM data at ±3m vertical accuracy build realistic 3D scenes for site selection, well-pad placement, and corridor planning.
  • Geological & Spectral Mapping: Hyperspectral (400–2500nm) and SWIR sensors evaluate surface lithology, soil structure and mineral composition for geological assessment.
  • Natural Oil Seep Detection: Multispectral and hyperspectral imagery identifies naturally occurring oil and gas seeps at the surface, surfacing new exploration leads that geologists can weigh alongside subsurface data before drilling.
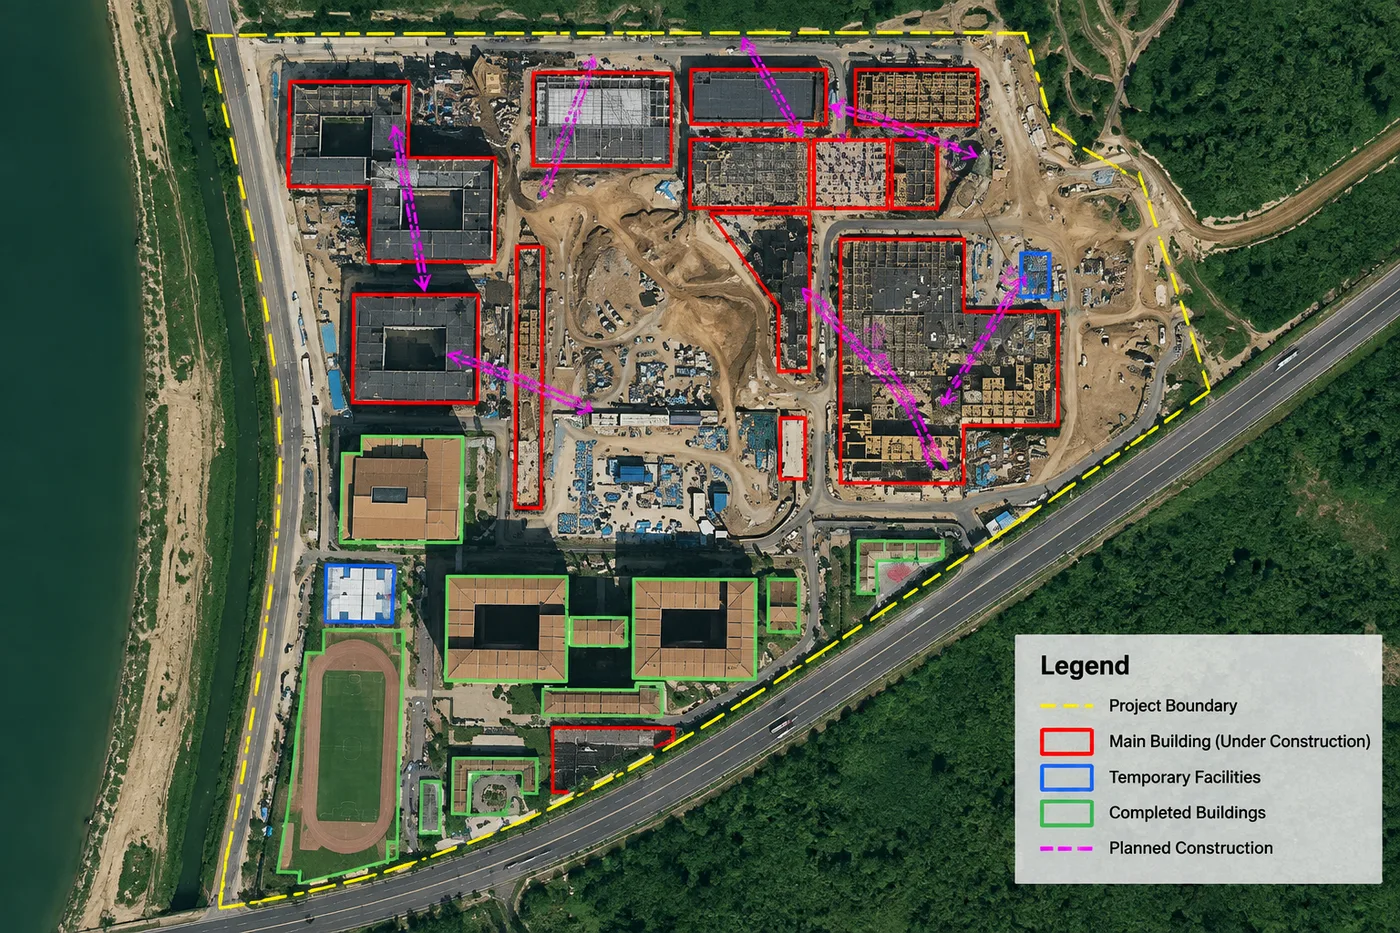
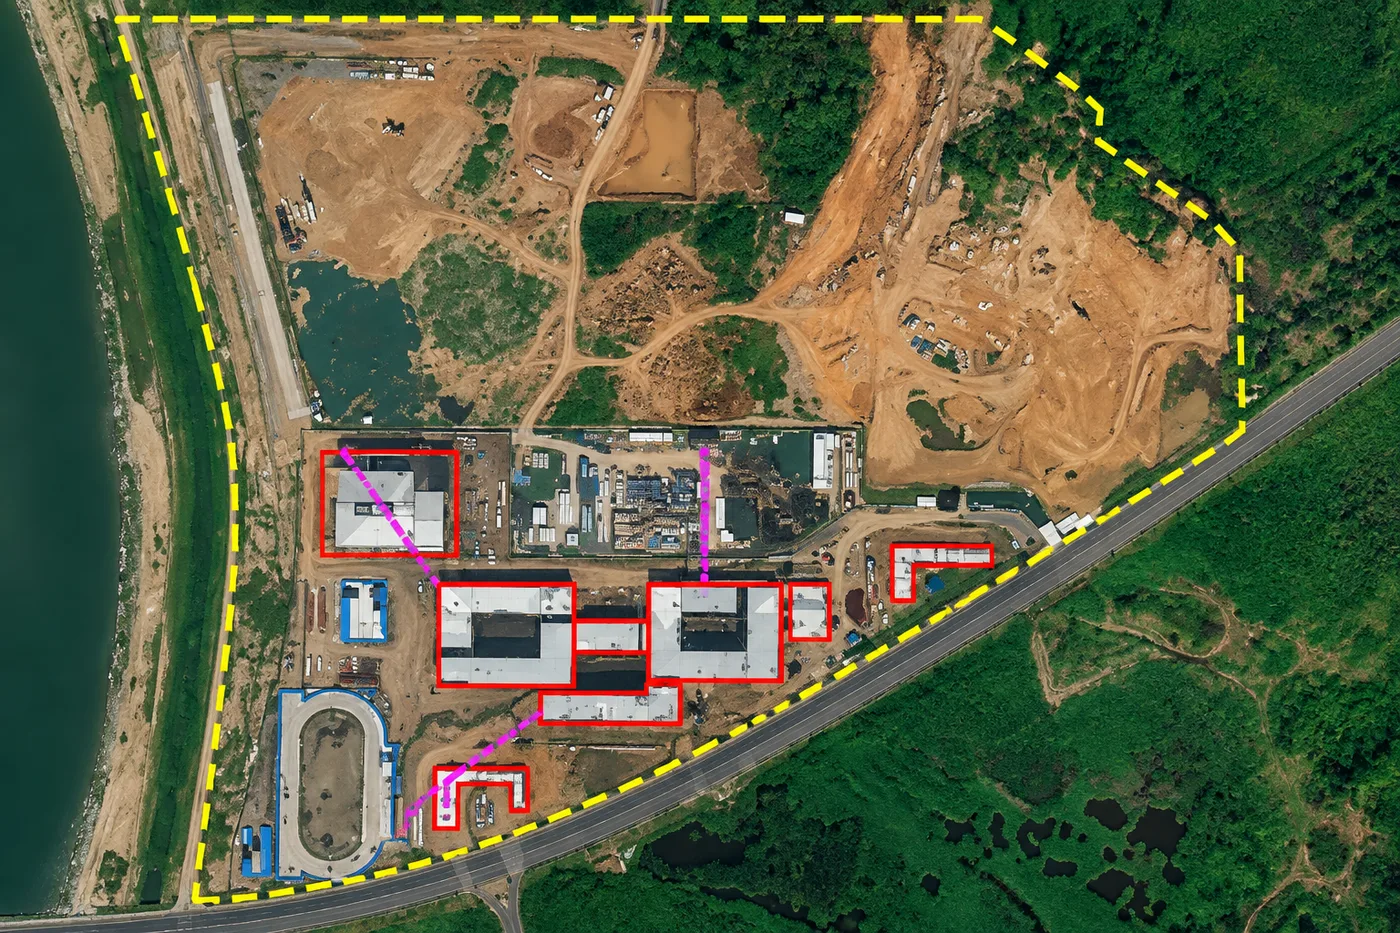
Satellite imagery of an oil and gas facility under construction, with AI-tagged building phases: under construction, completed, and planned
03 — SOLUTION

Facility & Construction Monitoring With Satellite Imagery

Remote tracking of refineries, offshore platforms and pipeline construction milestones keeps projects on schedule and budget.
  • Visual Stage Tracking: Sub-meter imagery down to 25–30cm tracks foundations, trenching, material storage and structural development at every build phase.
  • AI Change Detection: Automatically measures built-up progress across construction phases, cutting down on frequent, costly physical site visits.
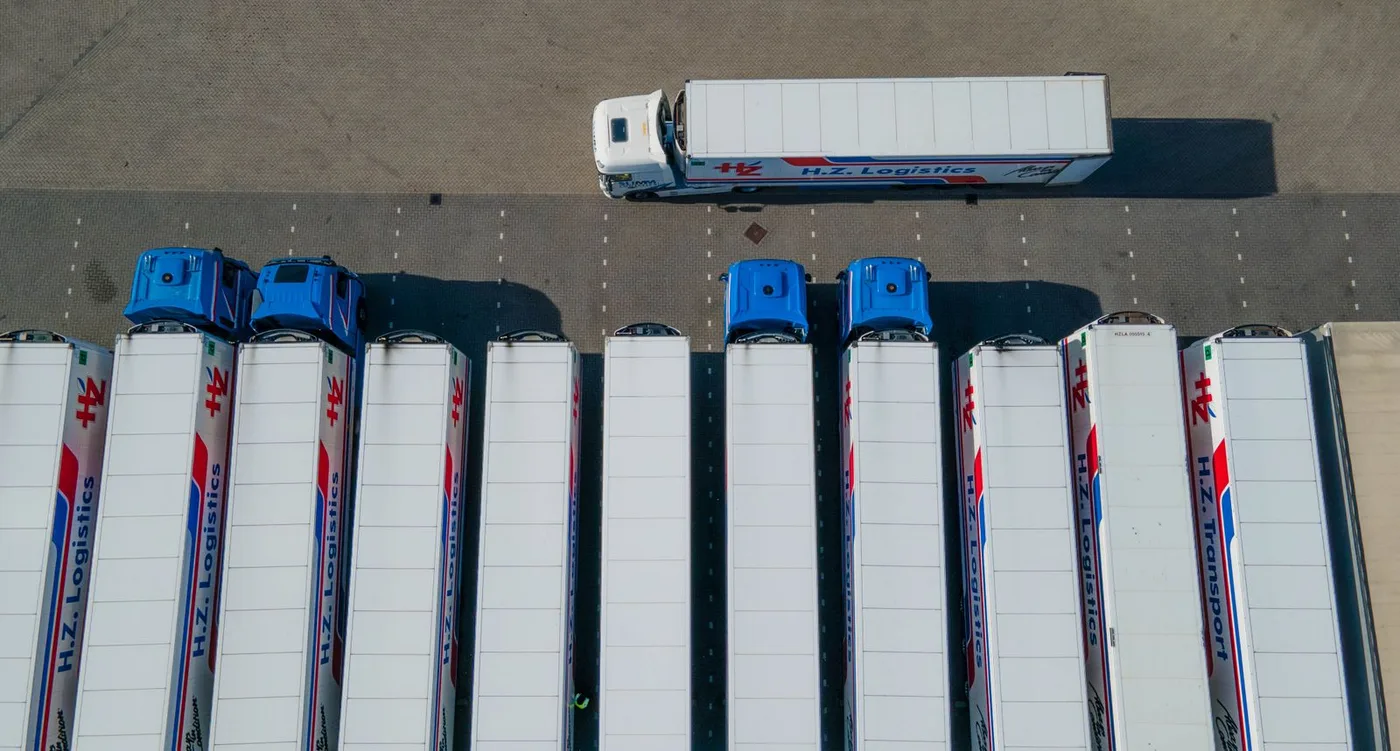
Top-down satellite-style view of trucks and fleet vehicles at an industrial site, the kind of imagery used for AI vehicle and equipment detection
04 — SOLUTION

Equipment & Vehicle Activity Monitoring

AI-powered object detection quantifies fleet activity and equipment presence across well pads, tank farms, and refineries without deploying ground teams.
  • Fleet & Heavy Equipment Counts: AI models detect and count trucks, rigs and heavy machinery across a site from each new capture, benchmarked against historical activity levels.
  • Production Trend Estimation: Vehicle and equipment density at well pads and storage facilities serves as a proxy signal for output and throughput changes ahead of official reporting.
  • Activity Hotspot Mapping: Recurring vehicle and equipment clusters flag active work zones, helping validate site operations and surface unusual or unauthorized activity.
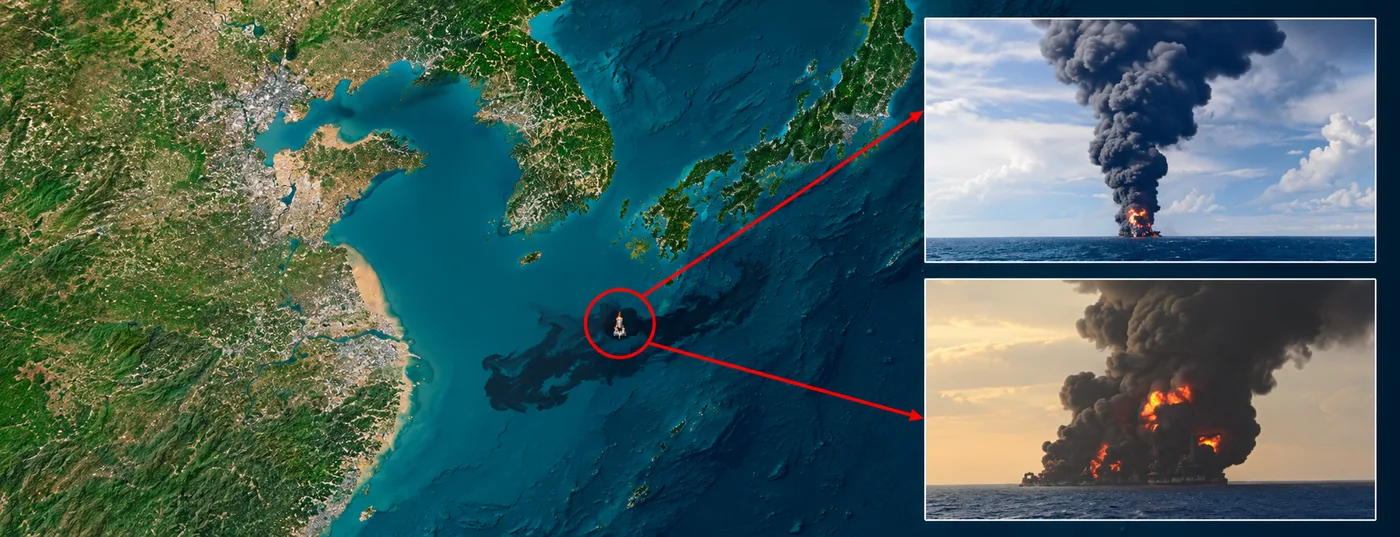
Satellite detection of a marine oil spill and vessel fire, with close-up photos confirming the environmental hazard
05 — SOLUTION

Environmental & Methane Monitoring

Satellites deliver objective data to support sustainability initiatives and regulatory compliance, with different sensors suited to different environmental questions.
  • Methane & GHG Monitoring: Specialized multispectral, hyperspectral and thermal-infrared sensors detect, measure and track atmospheric methane emissions and industrial GHG releases, an approach supported by a growing body of peer-reviewed research on satellite-based methane detection and source attribution around oil and gas infrastructure.
  • Thermal Anomaly Detection: Thermal-infrared imagery identifies localized temperature anomalies around processing facilities and pipeline junctions that can indicate a leak or equipment issue worth a closer inspection.
  • Site Rehabilitation & Vegetation Health: Tracks long-term land degradation, water contamination and forest restoration around operational assets.
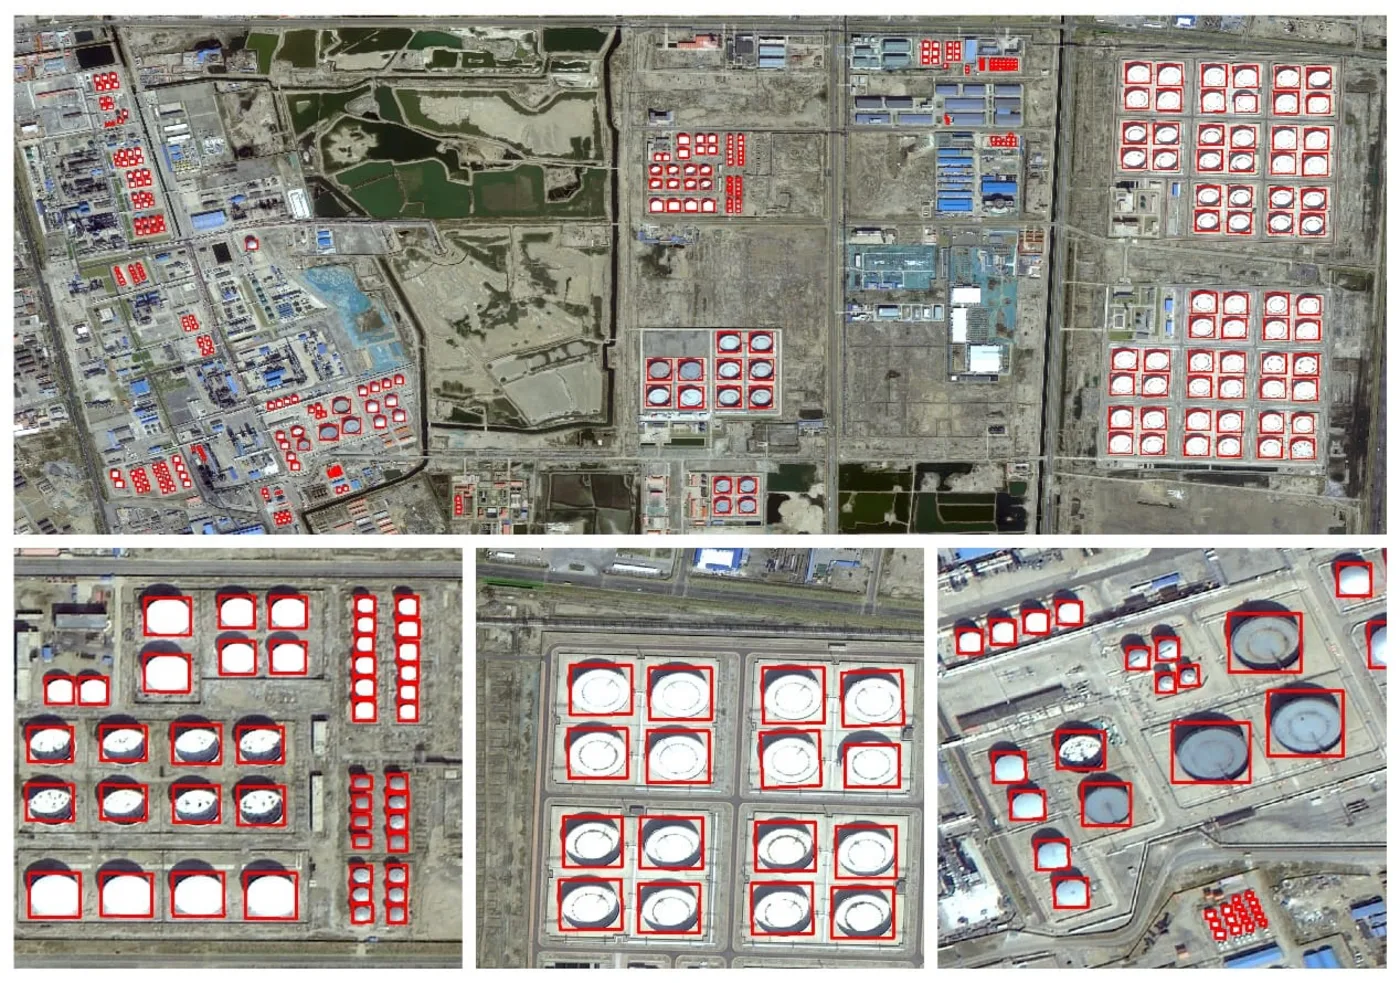
AI-detected floating-roof oil storage tanks across a refinery tank farm, satellite imagery
06 — SOLUTION

Crude Oil Storage & Supply Chain Monitoring

Satellite analytics provide strategic business intelligence for energy trading, market forecasting, and logistics.
  • Storage Tank Inventory Tracking: High-resolution optical and SAR imagery measures floating-roof positions on crude oil storage tanks worldwide, supporting estimates of changes in storage levels from repeated observations.
  • Maritime Logistics & Tanker Monitoring: Monitors port traffic, tracks oil tanker movement, calculates vessel drafts, and identifies maritime transit routes for global supply-and-demand insight.
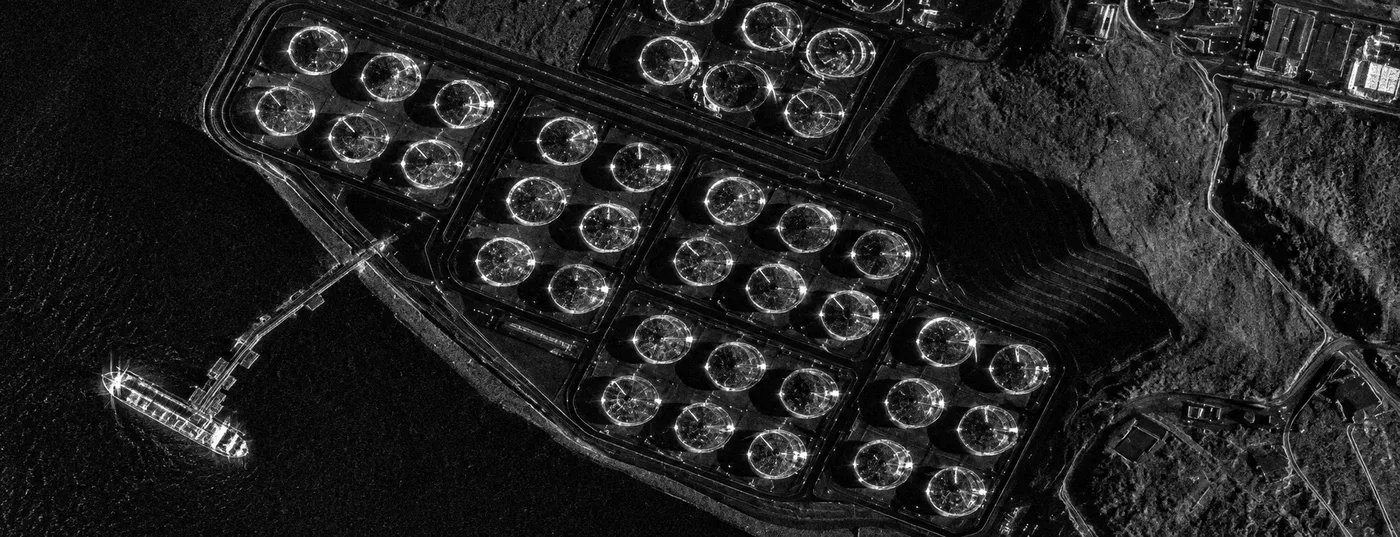
All-weather SAR satellite image of a coastal oil storage tank farm and tanker at night, demonstrating cloud- and dark-penetrating monitoring
07 — SOLUTION

Oil Spill Detection & Emergency Response

During disasters, immediate satellite tasking delivers fast situational awareness.

  • All-Weather Oil Spill Detection: C-band SAR such as Gaofen-3 penetrates darkness, storm clouds and smoke to locate marine oil slicks and track movement alongside ocean-current models. Past emergency deployments processed over 90 scenes within 4 days to direct cleanup.
  • Drilling Platform Fire & Thermal Incident Monitoring: Thermal-infrared and optical tasking over an offshore platform or well-site fire tracks the burn extent and smoke plume in near real time, supporting evacuation and containment decisions.
  • Natural Disaster Response: Rapidly assesses damage from earthquakes, flooding or landslides, delivering analysis-ready imagery in under 24 hours to coordinate response.

Fleet

Satellite Constellations & Technical Specifications

Each mission is matched to a specific oil and gas task, from centimeter-level facility inspection to wide-area regional monitoring.

Satellite / Sensor CategoryFeatured ConstellationsNative ResolutionKey Oil & Gas Application
Ultra-High Resolution OpticalSuperView Neo-1 (25cm), TripleSat Constellation, BJ3N / Beijing-3B, SuperView-2 (40cm), SuperView-1 (50cm)25cm – 50cmFacility inspection, pipeline encroachment detection, vehicle tracking
All-Weather Radar (SAR)GF-3 SAR (C-band), LT-1 SAR (L-band)1m – 3mInSAR subsidence and pipeline deformation, oil spill detection through cloud
Wide-Swath OpticalGF-6 (2m), GF-1 (8m), GF-4 (50m geostationary)2m – 50mRegional environmental monitoring, rapid revisit tracking
Hyperspectral & ThermalGF-5B, ZY-1 02D, Wyvern (400–2500nm)5.3m – 30mMaterial identification, gas emission detection, geological exploration

Deliverables

The Outputs We Deliver

Every engagement includes raw data layers, a decision-ready report, and an interactive map, not just imagery.

Original Data Layers

Raw GEOJSON, KML, or SHP datasets delivered ready to upload into ArcGIS, QGIS, or your own GIS environment.

Decision-Ready PDF Report

A summarized report of key findings, changes, and risk flags for your site, ready to share with stakeholders or regulators.

Interactive Smart Map

A cloud-based, zoomable map with 3D view for visualizing pipeline corridors, facilities, and detected changes across your assets.

Sensor Guide

What Imagery Do You Need?

A quick match between a common oil and gas monitoring requirement and the imagery type and resolution it typically calls for.

RequirementRecommended ImageryTypical Resolution
Pipeline encroachmentHigh-resolution optical25–50cm
Ground movement or subsidenceSAR / InSARSensor dependent
Tank farm monitoringOptical or SARSub-meter
Oil spill detectionSARSensor dependent
Facility constructionHigh-resolution optical25–50cm
Regional environmental monitoringMultispectral2m–10m+

Pricing & Delivery

Data Delivery & Pricing

Transparent per-km² pricing for archive and new-tasking imagery, delivered in the GIS format your team already works in. Not sure what you need? Tell us your asset and monitoring requirement and we'll recommend the right imagery.

Standard Archive

Existing imagery, 90+ days old — ready to download within minutes

Super High Resolution (25-30cm)$20/km²
Very High Resolution (31-50cm)$13/km²
High Resolution (51-80cm)$5/km²

Minimum order area 25km² per scene.

New Satellite Tasking

Fresh capture of your exact location and date range

Super High Resolution (25-30cm)$30/km²
Very High Resolution (31-50cm)$20/km²
High Resolution (51-80cm)$8/km²

Minimum order area 100km² per scene. Priority and emergency collection tasking available for time-critical inspections.

Case Examples
Satellite Monitoring in Practice

AI-tagged satellite monitoring of oil and gas infrastructure used to rank pipeline segments by inspection priority
Pipeline Safety

Prioritizing Pipeline Inspections with Risk Scoring

InSAR deformation data combined with AI risk scoring ranks pipeline segments by hazard likelihood, turning thousands of kilometers of corridor into a short, prioritized list of sites for ground crews to visit first.
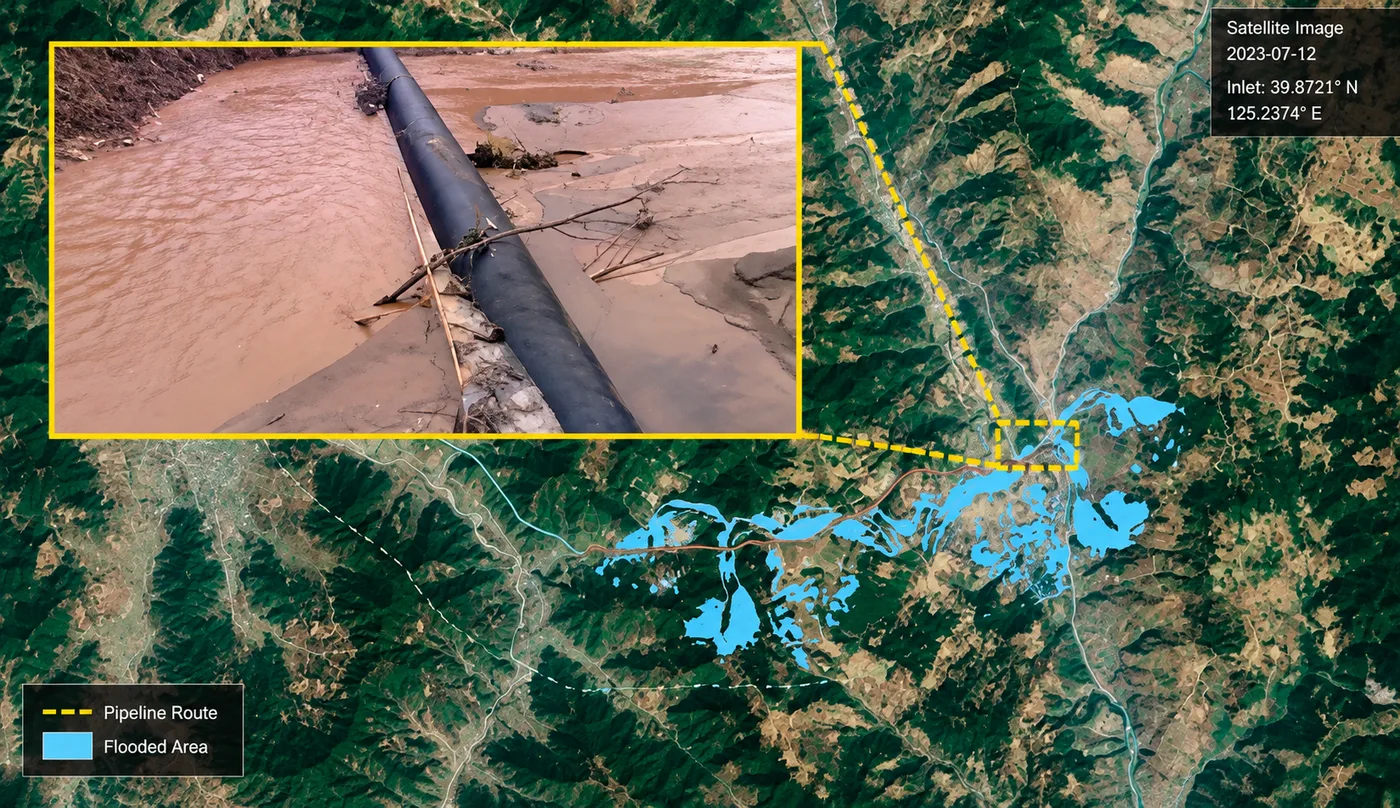
Satellite mapping of flood inundation along an oil and gas pipeline corridor, with a ground photo confirming pipeline exposure
Emergency Response

Storm-Season Corridor Risk Briefings

During monsoon season, repeat all-weather tasking over a pipeline corridor produces a same-week briefing on newly exposed or waterlogged sections, letting operators sequence repair crews before a ground survey is even possible.
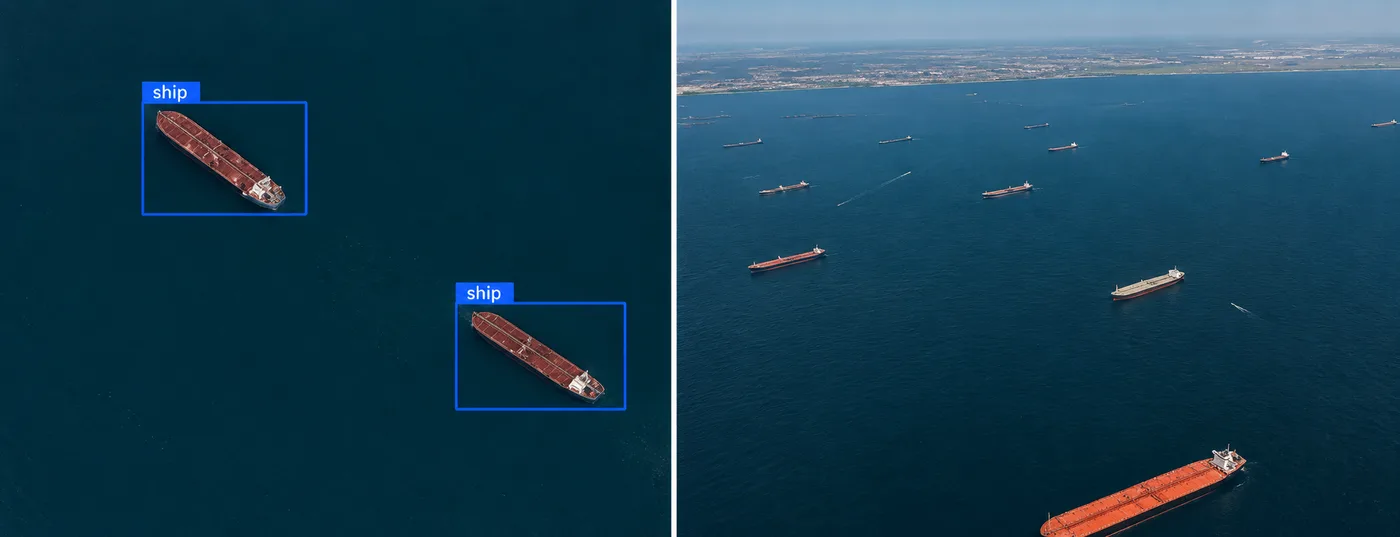
AI-detected oil tankers at a port terminal, satellite imagery alongside an aerial reference photo
Supply Chain Intelligence

Reading Crude Flows Independent of Self-Reported AIS

Counting tankers and measuring hull waterlines at ports and offshore anchorages gives traders an independent read on crude and product movement that does not rely on vessels broadcasting accurate AIS data.

Why Satellite Monitoring

Application Benefits

Increase Efficiency

Full-coverage monitoring detects problems in time, at regional scale.

Reduce Costs

Cuts field-inspection labor while gathering more data, faster.

Enhance Safety

Early warning on hazards helps prevent accidents before they escalate.

Protect the Environment

Real-time tracking of environmental change and pollution incidents.

Improve Decision-Making

Data and analysis results support faster, more accurate operating decisions.

Frequently Asked Questions

What is satellite imagery used for in oil and gas?
Satellite imagery is used to monitor pipelines, well pads, refineries, storage facilities, and the land around them. Comparing optical, SAR, hyperspectral, and DEM imagery over time helps operators identify construction activity, encroachment, ground movement, oil spills, and other conditions worth a closer inspection.
What satellite data does XRTech Group use for oil and gas monitoring?
We combine ultra-high-resolution optical imagery (SuperView Neo-1, TripleSat, BJ3N/Beijing-3B, down to 25cm), all-weather C-band and L-band SAR (GF-3, LT-1) for InSAR deformation and cloud-penetrating surveillance, hyperspectral and thermal sensors (GF-5B, ZY-1 02D, Wyvern) for material and emissions detection, and DEM/DSM elevation data with ±3m vertical accuracy for 3D terrain modeling.
What type of satellite imagery is best for oil and gas monitoring?
It depends on what is being monitored. High-resolution optical imagery suits facility, well pad, and construction monitoring; SAR and InSAR suit all-weather surveillance, oil spill detection, and ground-movement monitoring; hyperspectral and thermal sensors suit material identification and emissions monitoring.
How does InSAR detect pipeline problems before they fail?
Interferometric SAR (InSAR) compares radar signal phase between repeat satellite passes to measure ground movement at the millimeter level. Along a pipeline corridor, this surfaces land subsidence and soil shifts, including on buried and seabed sections, long before the deformation becomes visible on the surface or shows up as a structural failure.
How is satellite imagery used to monitor pipelines?
High-resolution optical imagery tracks visible changes such as encroachment, new access roads, or construction near a pipeline right-of-way, while InSAR compares repeat radar passes to detect ground movement and subsidence along the corridor, often before an issue becomes visible on the surface.
Can satellites detect oil spills at night or through cloud cover?
Yes. C-band SAR satellites such as Gaofen-3 transmit their own microwave signal rather than relying on sunlight, so they can locate marine oil slicks, measure slick boundaries, and track movement through darkness, storm clouds, and smoke, when optical satellites are blind.
Can satellite imagery monitor crude oil storage tanks?
Yes. High-resolution optical and SAR imagery can identify storage tanks in a tank farm and, where tank design and imagery quality allow, track changes in floating-roof position. Repeated observations over time support estimates of storage utilization and activity changes.
How fast can emergency satellite tasking respond to an oil and gas incident?
Analysis-ready imagery for natural-disaster and incident response is typically delivered in under 24 hours. For large-scale marine oil spill emergencies, over 90 satellite scenes have been processed within 4 days in past deployments to direct cleanup operations.
What resolution is needed to monitor pipeline and facility construction?
High-resolution satellite imagery, typically 25–30cm, is used to track foundations, trenching, material staging, and structural progress at each construction phase. Combined with AI change detection, this measures built-up progress over time without frequent physical site visits.
How is oil and gas satellite imagery delivered and priced?
Imagery and value-added products are delivered through a cloud platform in GeoTIFF, SHP, DWG or UTM format, with response times as fast as 1.5 hours and cloud delivery in about 1 hour. Standard archive imagery starts at $5/km² for 51-80cm resolution up to $20/km² for 25-30cm, while new tasking for a fresh capture runs from $8/km² up to $30/km², with priority and emergency tasking available for time-critical inspections.
Can satellites detect vehicles and equipment at an oil and gas site?
Yes. AI object-detection models applied to high-resolution optical imagery count trucks, rigs, and heavy machinery across well pads, tank farms, and refineries. Tracked over time, vehicle and equipment density acts as a proxy signal for production and throughput trends and flags active work zones without deploying ground teams.
What outputs are included with an oil and gas satellite monitoring report?
Each engagement includes original GEOJSON, KML, or SHP data layers ready to upload into ArcGIS or QGIS, a decision-ready PDF report summarizing key findings and risk flags, and a cloud-based interactive smart map with 3D view for visualizing pipeline corridors, facilities, and detected changes.

Ready to monitor your oil & gas assets from orbit?

Search our live archive or request new tasking over your pipeline, facility, or region, optical, SAR, hyperspectral or DEM.
