How Satellites Monitor Mining From Exploration to Closure
On this page
- The Six Stages Satellites Track Across a Mine's Life
- Stage 1, Mapping Mineral Deposits Before a Drill Rig Moves
- Stage 2, Modeling Terrain and Estimating Overburden Before Construction
- Stage 3, Tracking Daily Operations, Stockpiles, and Unauthorized Activity
- Stage 4, Catching Ground Movement Before a Dam or Pit Wall Fails
- Stage 5, Watching Water Quality and Ecosystem Health Around the Site
- Stage 6, Proving Land Rehabilitation After Mine Closure
- Responding Fast When a Landslide, Pit Wall Collapse, or Gas Leak Happens
- Which Satellite Sensor Fits Which Mining Monitoring Need
- Who Actually Uses This Data
- Frequently asked questions
- Sources and further reading
A mine is one of the hardest sites in the world to inspect on foot. Concessions run hundreds of square kilometers, pit walls and tailings dams sit in terrain that is dangerous to walk, and a single ground survey can take a crew months to complete once and then goes stale the moment it is finished. Satellites solve a different problem than a site visit does. They return to the same coordinates on a fixed schedule, in daylight, cloud, or total darkness, and they hand back a measurable record instead of a field note. That record now covers the full mine lifecycle, from the first hyperspectral scan of a concession searching for a gold or copper signature, through 3D terrain models used to plan a pit, millimeter-precision radar that watches a tailings dam wall for movement, and multispectral water and vegetation checks that support the closure report years after production ends.
Quick answer
Satellites monitor mining across six stages of a project. Hyperspectral and multispectral sensors map mineral alteration zones during exploration. Stereo optical imagery builds 3D terrain models for feasibility and pit design. Sub-meter optical satellites track daily pit expansion, stockpiles, and unauthorized activity. Interferometric radar (InSAR) measures ground deformation down to 1 to 2 millimeters to catch tailings dam or slope movement before failure. Multispectral and thermal sensors track water quality and vegetation health around the site. And a multi-decade optical archive documents land rehabilitation after closure. No single sensor covers all six, which is why an active mine typically draws on several satellite types at once.
The Six Stages Satellites Track Across a Mine's Life
Each stage of a mining project asks a different question, and each question points to a different sensor. The table below maps the full lifecycle before the article walks through each stage in detail.
| Stage | What it monitors | Sensor type | Typical question answered |
|---|---|---|---|
| 1. Exploration | Mineral alteration halos, lithology, structural controls | Hyperspectral, multispectral | Where should we drill first? |
| 2. Feasibility | Terrain elevation, overburden volume, access routes | Stereo optical (DEM/DSM/DTM) | How do we design the pit and roads? |
| 3. Operations | Pit expansion, stockpiles, equipment, site disturbance | Sub-meter optical | Is production tracking to plan? |
| 4. Structural safety | Ground deformation on dams, slopes, plants, pipelines | InSAR radar | Is anything moving before it fails? |
| 5. Environmental compliance | Water quality, vegetation health, land disturbance | Multispectral, thermal | Are we meeting our permit conditions? |
| 6. Closure and rehabilitation | Land restoration against a historical baseline | Multi-temporal optical archive | Has the land actually recovered? |
| Cross-cutting, emergency response | Landslides, pit wall collapse, gas or chemical leaks | All-weather SAR, AI fusion | What happened, and how bad is it? |
Stage 1, Mapping Mineral Deposits Before a Drill Rig Moves
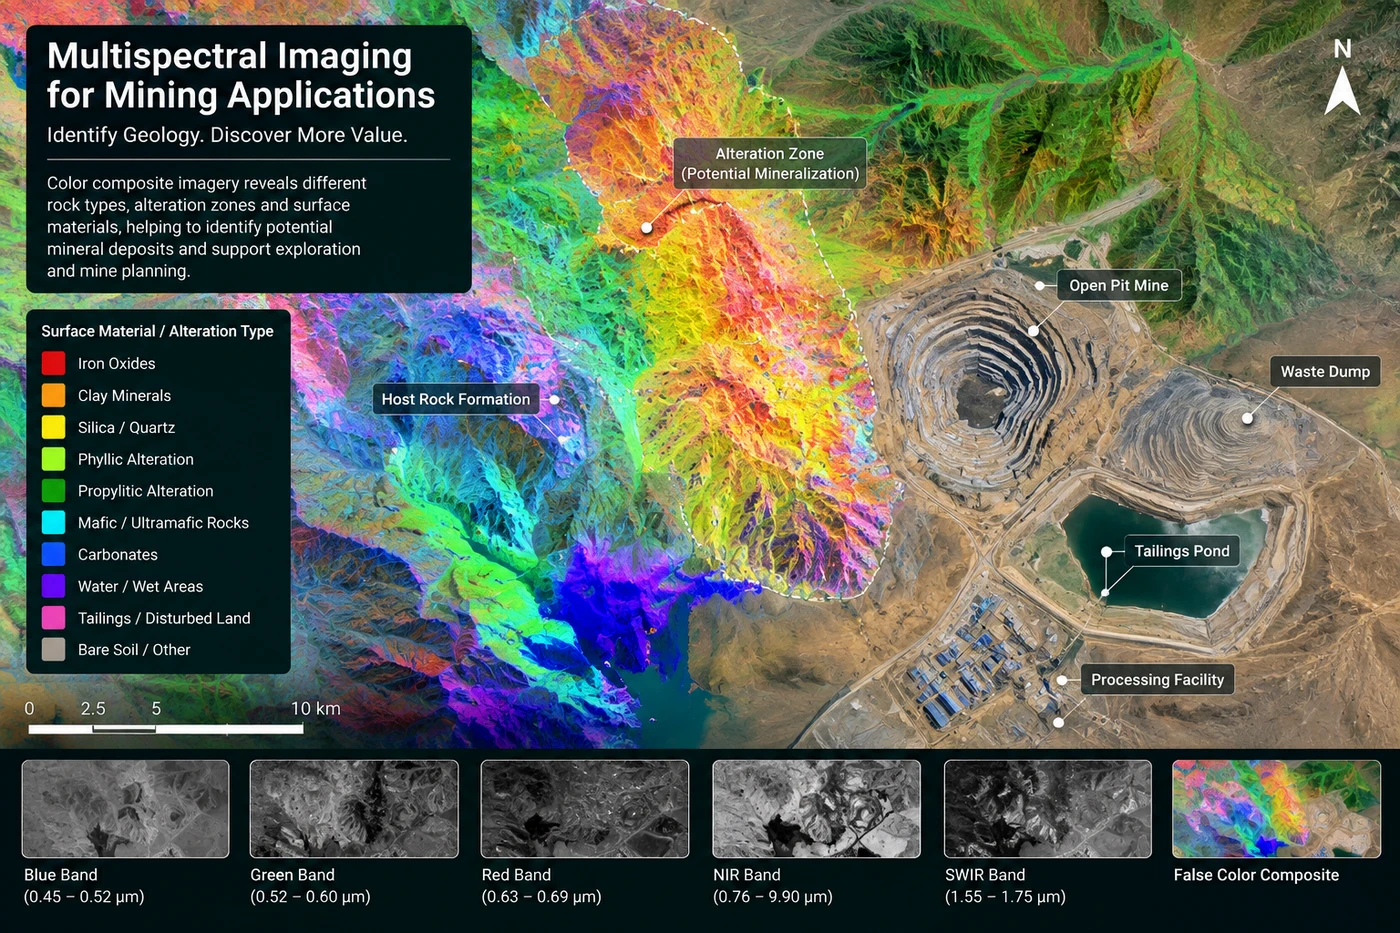
Ore is rarely visible from orbit. What geologists actually look for is the alteration halo a mineralizing system leaves behind, the ring of clay, oxide, and carbonate minerals that forms around a gold, copper, or base-metal deposit. Hyperspectral satellites such as GF-5 and GF-5B read that halo directly, splitting reflected sunlight into 330-plus narrow bands between 400 and 2500 nanometers to identify specific minerals such as kaolinite, sericite, and hematite rather than just a generic color anomaly. ZY-1 02D and 02E pair a 166-channel hyperspectral camera with a 2.5 m panchromatic sensor for sharper spatial context, and the Wyvern constellation adds 31-band VNIR data at 5.3 m resolution.

Deep learning platforms then fuse that spectral data with digital elevation models and known fault structures to produce a ranked, GPS-coded probability map, cutting the time to a first drill target from months of ground survey to a few days of desk analysis. This is the part of the mining lifecycle satellites cover in the most depth, and it earns its own full breakdown, including satellite specs, real field results from West Africa, Tanzania, and Chile, and cost comparisons against ground-first exploration, in our complete guide to hyperspectral mineral exploration. For how the spectral and structural data layers actually combine into that probability map, plus accuracy figures and a fresh 2026 case study, see how satellites detect minerals and target prospects.
Stage 2, Modeling Terrain and Estimating Overburden Before Construction
Once a target is confirmed, the next question is not what is underground, it is what the surface looks like. High-resolution optical satellites captured in stereo, the same ground point imaged from two different orbital positions, are processed into Digital Elevation Models, Digital Surface Models, and Digital Terrain Models. Engineers use that 3D basemap to evaluate slope and drainage across a proposed pit, calculate how much overburden has to be moved before ore is reached, route haul roads around the steepest terrain, and pick a drill-pad layout, all before a single access road is cut.
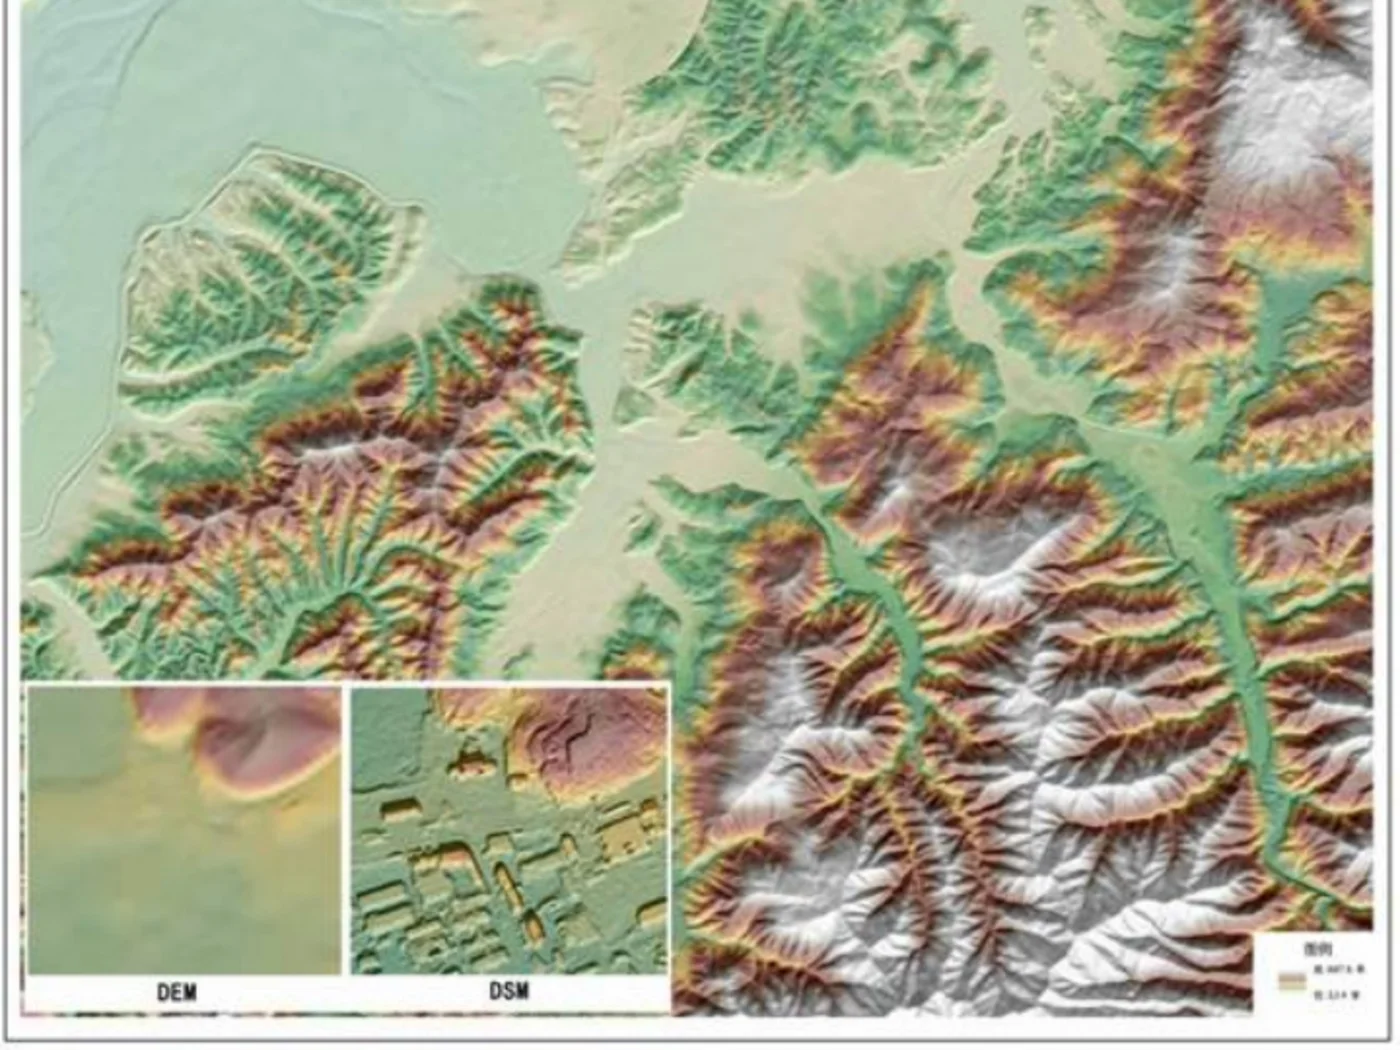
The resulting Digital Orthophoto Map also becomes the baseline everything else in this article gets measured against. A pit's excavation volume, a tailings dam's crest elevation, and a closure report's land-restoration claim are all comparisons against this early terrain model, not just a single-purpose deliverable.
Stage 3, Tracking Daily Operations, Stockpiles, and Unauthorized Activity
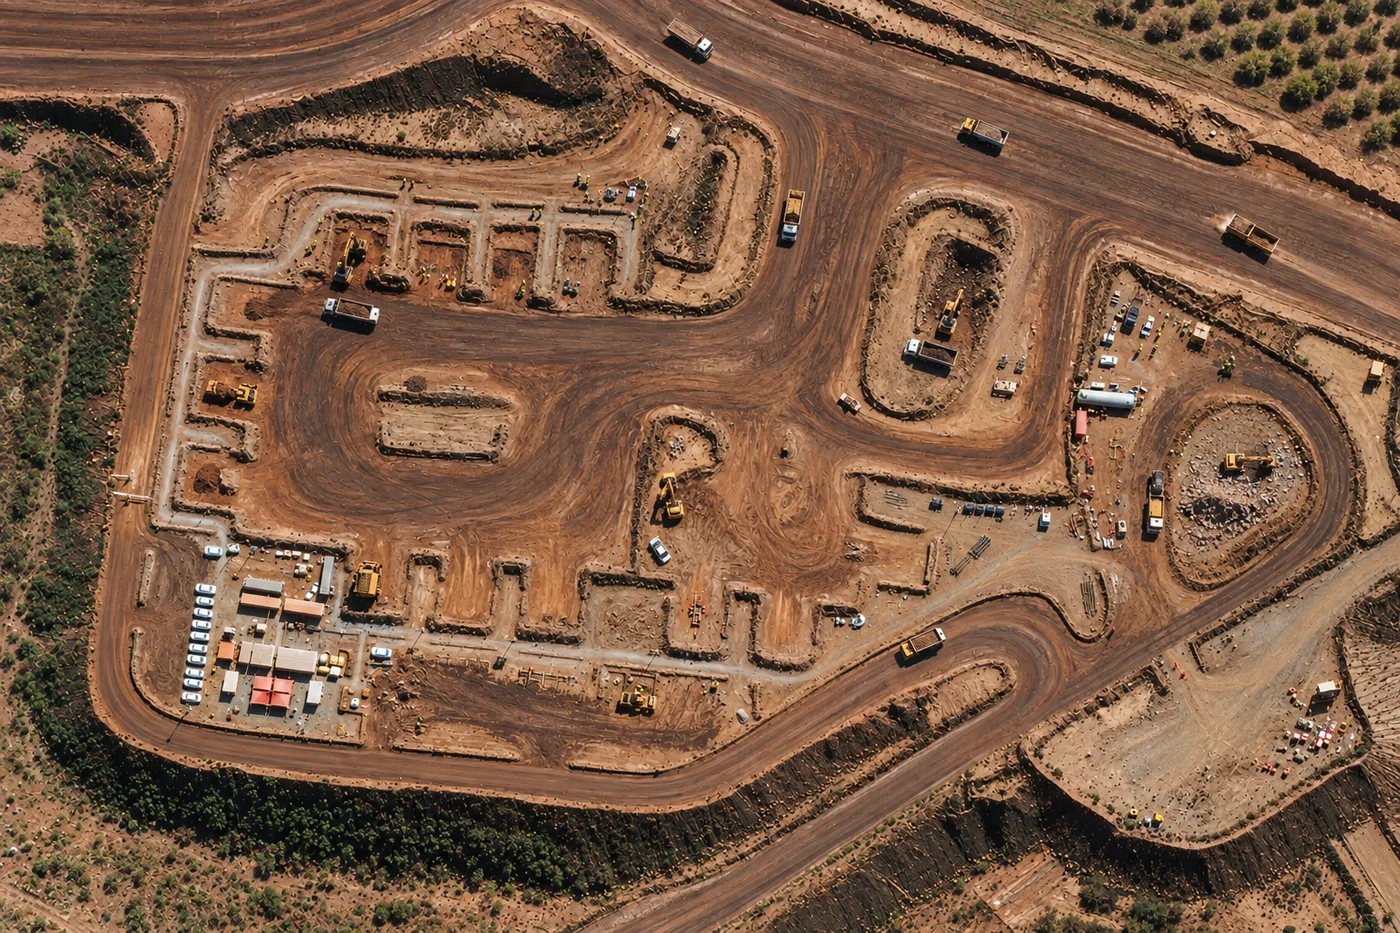
Once a mine is producing, the operational question shifts to whether the site is actually running to plan. Sub-meter optical constellations, including Superview Neo-1 at 0.3 m and 0.25 m resolution and BJ3N with onboard AI processing, resolve individual haul trucks, excavators, and stockpile shapes clearly enough to measure pit expansion, verify equipment counts, and estimate stockpile volume from orbit on a routine revisit schedule.
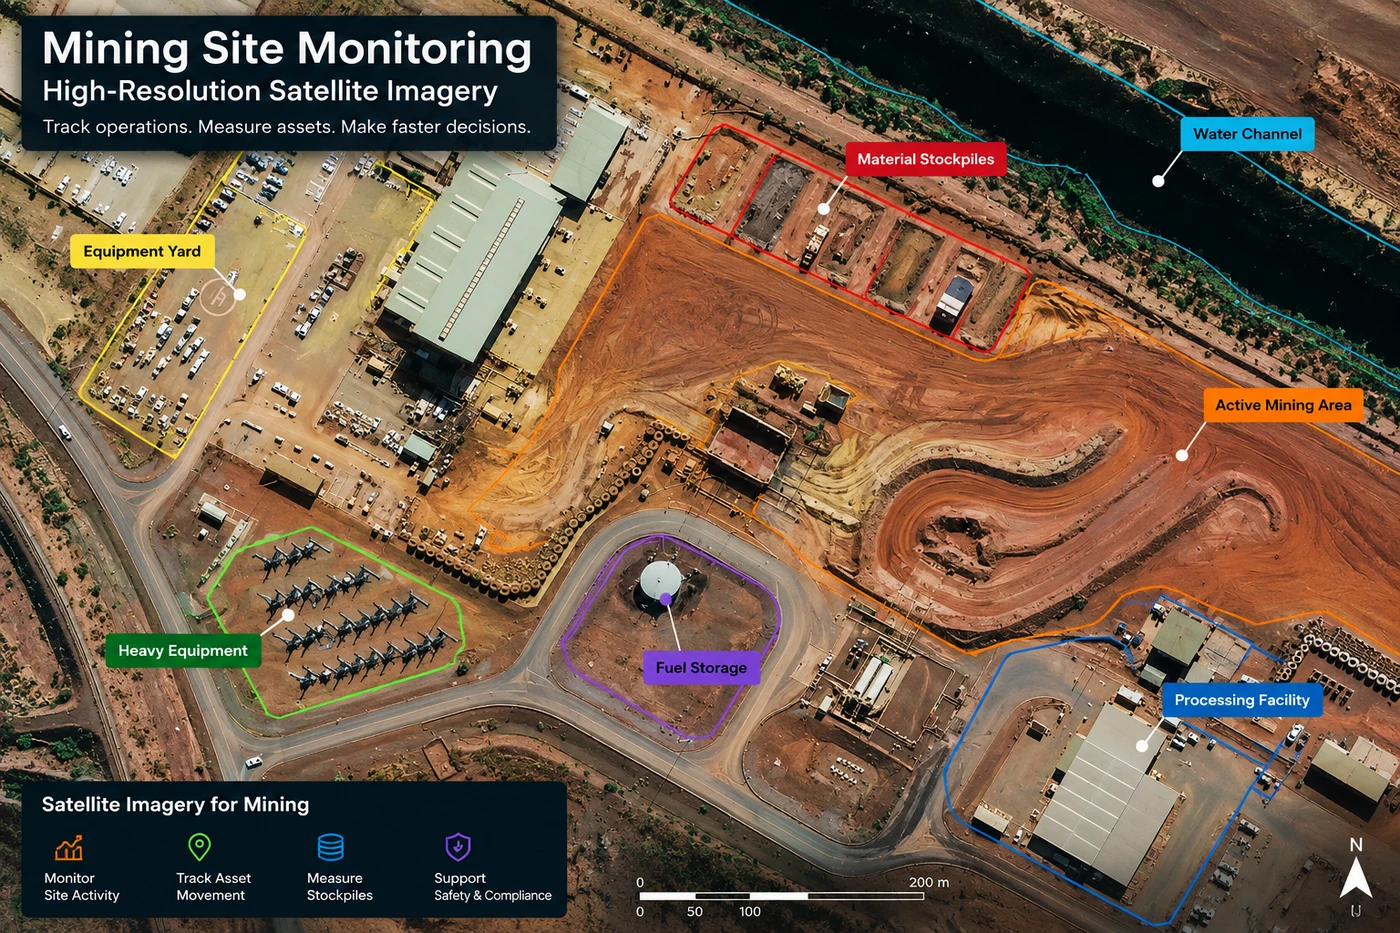
The same imagery does double duty on the compliance side. A change-detection pass comparing this month's footprint against last month's flags disturbance outside a permitted concession boundary, which is the primary remote way regulators and operators catch unauthorized or illegal mining encroachment without sending an inspector into terrain that may not be safe, or legal, to enter.
Stage 4, Catching Ground Movement Before a Dam or Pit Wall Fails
This is the stage where satellite monitoring stopped being a convenience and became a regulatory expectation. On January 25, 2019, the Brumadinho tailings dam in Brazil failed, releasing roughly 11.7 million cubic meters of mine waste and killing more than 250 people. A retrospective satellite radar study published in Communications Earth & Environment found that the dam wall showed deformation inconsistent with normal settlement in the InSAR record before the collapse, movement that was measurable from orbit and, in hindsight, foreseeable. The Global Industry Standard on Tailings Management (GISTM), issued in August 2020 by the ICMM, UNEP, and the Principles for Responsible Investment, followed directly from that disaster and the 2015 Mariana dam failure before it. By the ICMM's 2025 Tailings Progress Report, more than 80% of member-operated tailings facilities classified as Extreme or Very High consequence were already under continuous InSAR monitoring, up from two-thirds of all member facilities overall.
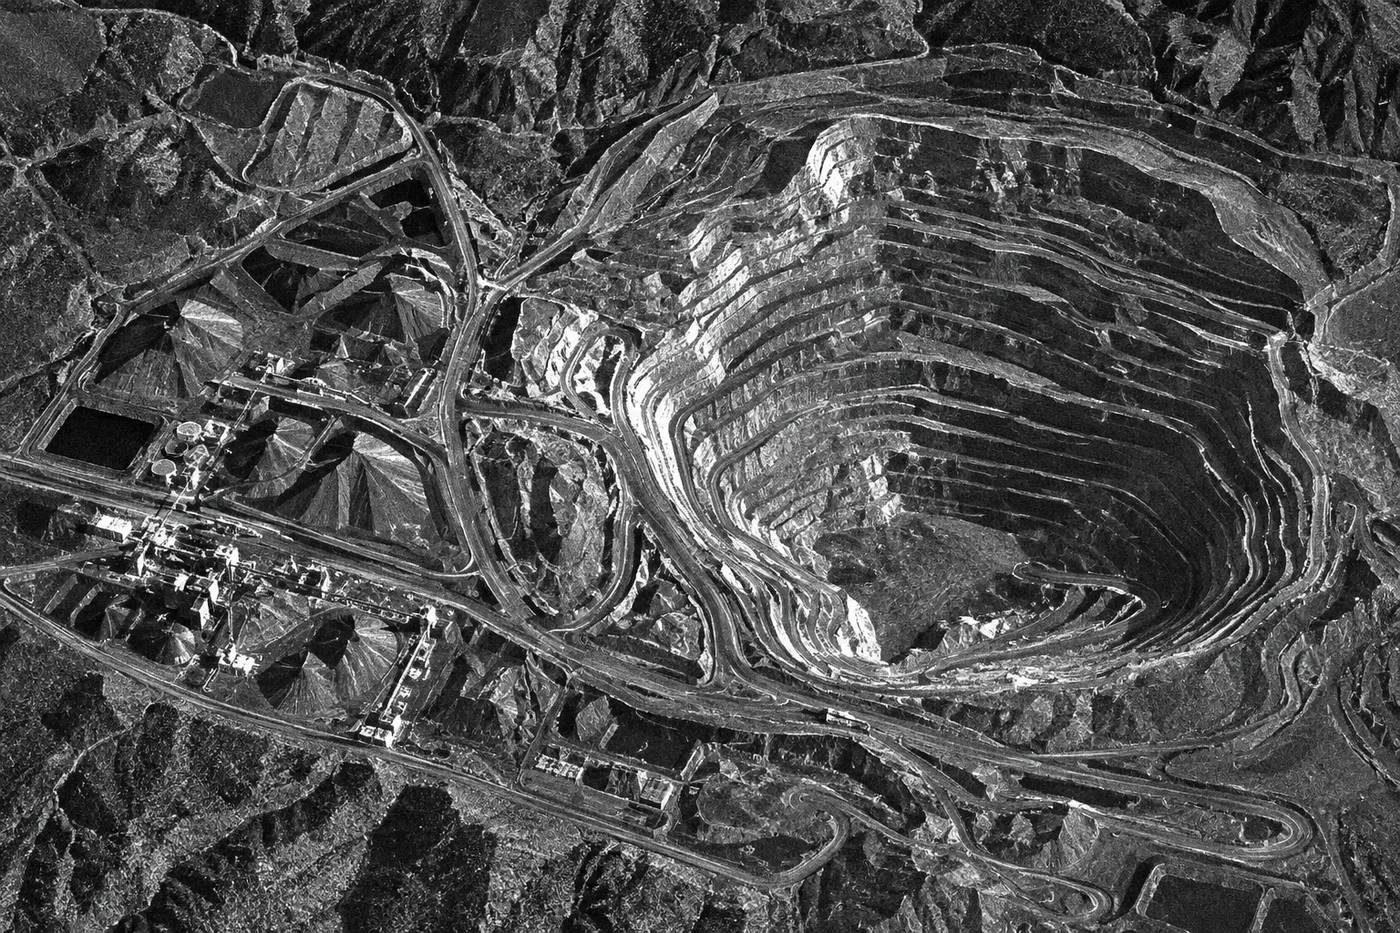
Interferometric Synthetic Aperture Radar works by comparing the phase of radar signals reflected off the same ground point on successive passes. L-band satellites like LT-1 and C-band satellites like GF-3 turn that phase difference into a deformation map precise to 1 to 2 millimeters, fine enough to separate normal settlement from the accelerating movement that precedes failure. Because radar is an active sensor, it images through cloud, smoke, and full darkness, which is the property that makes it usable for continuous monitoring in monsoon regions or polar winters where optical imagery goes dark for months. The same InSAR coverage extends to open-pit slopes, waste rock dumps, processing plants, and pipeline corridors, not just tailings dams, giving a mine a single deformation record across every structure where a slow slope failure could put people or production at risk. For the full case-by-case breakdown of how this and five other satellite-based mechanisms head off fatalities specifically, see our guide to how satellite imagery prevents lethal mining accidents.
Need continuous InSAR coverage over a tailings facility or pit slope?
Search our SAR and hyperspectral archive by coordinates or task new imagery over your concession, then get deformation and mineral maps back in days, not months.
Stage 5, Watching Water Quality and Ecosystem Health Around the Site
A mine's environmental footprint rarely stays inside its permit boundary. Multispectral and hyperspectral sensors analyze the rivers, lakes, and reservoirs downstream of a site for turbidity, suspended solids, chlorophyll shifts, and the color signature of heavy-metal or acid contamination from a tailings pond or waste pile, catching a leak long before it shows up in a scheduled water sample. Multi-temporal vegetation indices such as NDVI and NDRE, first developed from NASA and USGS Landsat research, track canopy health and detect deforestation along a concession's edge, a direct check on whether clearing is staying inside its approved footprint.

None of these readings mean much as a single snapshot. Their value is in the time series, this month's turbidity or NDVI reading plotted against the same location a year or five years earlier, which is exactly what turns a satellite archive into an audit trail a regulator can actually check.
Stage 6, Proving Land Rehabilitation After Mine Closure
Closure obligations do not end when production stops, and neither does the monitoring. Operators compare current site conditions against historical satellite baselines, in some archives going back to 1999, to document that disturbed land is actually revegetating, that pit lakes are stabilizing at a safe water quality, and that waste rock and tailings areas are not still generating runoff years after closure. That comparison is what turns a rehabilitation claim into evidence a regulator can verify without a site visit, and it is often the single fastest way to close out a bonded reclamation obligation.
Responding Fast When a Landslide, Pit Wall Collapse, or Gas Leak Happens
Emergencies do not wait for good weather, and this is where satellite monitoring's other stages converge. A pit wall failure or waste-dump landslide often shows warning deformation in the same InSAR record used for routine dam monitoring, giving a site minutes to hours of lead time in the best case. Once an incident happens, AI-driven response platforms fuse spaceborne radar with aerial and ground sensors to map the extent of a collapse, a spill, or a gas release, coordinating where responders go first without waiting for cloud cover to clear or daylight to return.
Which Satellite Sensor Fits Which Mining Monitoring Need
No mine runs on one sensor type. The table below is a practical reference for matching the right imagery to the right question.
| Sensor type | What it reveals | Example satellites | Best mining use |
|---|---|---|---|
| Hyperspectral | Specific clay, oxide, and carbonate mineral species | GF-5, GF-5B, ZY-1 02D/02E, Wyvern | Exploration and alteration mapping |
| Multispectral optical | Broad color anomalies, vegetation index, land cover | Wide-swath multispectral constellations, SuperView-2 | Reconnaissance, water and vegetation health |
| Sub-meter optical | Individual vehicles, stockpile shape, pit geometry | SuperView Neo-1, BJ3N | Daily operational and asset tracking |
| SAR / InSAR radar | Ground deformation, all-weather imaging | LT-1 (L-band), GF-3 (C-band) | Tailings and slope safety, emergency response |
| Stereo optical (DEM/DSM/DTM) | Elevation, terrain shape, overburden volume | High-resolution stereo satellite pairs | Feasibility, earthworks, pit design |
Who Actually Uses This Data
The same imagery answers a different question depending on who is looking at it. An exploration geologist reads a prospectivity map to rank drill targets. A mine operations manager reads a change-detection pass to check pit expansion against the production plan. An ESG or compliance officer reads a water-quality and InSAR deformation trend to prepare a regulatory filing. An investor, lender, or insurer reads the same InSAR record as an independent risk check on a tailings facility before committing capital, since a satellite archive cannot be edited after the fact the way a self-reported inspection log can. A government land agency or regulator reads a change-detection archive to confirm a concession has not expanded past its permitted boundary. For a deeper look at how each of these roles applies satellite imagery, and how to get coverage over a specific site, see our satellite imagery for mining page.
Numbers that matter
These are the figures that explain why satellite monitoring has become standard practice across the mining industry, not a nice-to-have.
Ground deformation InSAR radar can resolve, precise enough to separate normal settlement from a developing slope or dam failure.
Tailings released in the 2019 Brumadinho dam collapse, the disaster that made satellite deformation monitoring standard industry practice.
Share of Extreme and Very High consequence tailings facilities under continuous InSAR monitoring per the ICMM's 2025 Tailings Progress Report.
Typical turnaround for a hyperspectral prospectivity report and ranked drill targets on a concession under 100 km².
Key takeaways
- Satellites cover six distinct stages of a mine's life, exploration, feasibility, operations, structural safety, environmental compliance, and closure, and no single sensor type covers all six.
- Hyperspectral and multispectral sensors find deposits indirectly, by mapping the mineral alteration halo around a deposit rather than the ore itself.
- InSAR radar resolves ground deformation to 1 to 2 millimeters and works through cloud, smoke, and darkness, which is why it now underpins tailings dam and pit slope safety monitoring industry-wide.
- The 2019 Brumadinho dam collapse, later shown to have had a detectable InSAR precursor signal, directly led to the Global Industry Standard on Tailings Management and today's InSAR compliance requirements.
- Stereo optical imagery builds the 3D terrain model, and later becomes the historical baseline, that overburden estimates, production tracking, and closure rehabilitation claims all get measured against.
Frequently asked questions
How do satellites monitor mining operations?
Satellites monitor mining across six stages, hyperspectral and multispectral imagery maps mineral deposits during exploration, stereo optical imagery builds 3D terrain models for feasibility and pit design, sub-meter optical satellites track daily operations and stockpiles, InSAR radar measures ground deformation on tailings dams and slopes, multispectral and thermal sensors track water and vegetation health, and a multi-decade optical archive documents land rehabilitation after closure.
Can satellites detect illegal or unauthorized mining?
Yes. Change-detection analysis compares recent high-resolution imagery against a site's permitted concession boundary and earlier baseline imagery. Any new excavation, access road, or land clearing outside the approved footprint shows up as a disturbance anomaly, which is how regulators and operators flag unauthorized mining without sending an inspector into the field.
How accurate is InSAR for tailings dam monitoring?
Interferometric Synthetic Aperture Radar (InSAR) can resolve ground deformation to roughly 1 to 2 millimeters by comparing the phase of radar signals reflected off the same ground point on repeated satellite passes. That precision is fine enough to distinguish normal settlement from the accelerating movement that precedes a slope or dam failure.
What satellites are used to monitor mines?
Mining monitoring draws on several satellite types depending on the task, hyperspectral sensors like GF-5, GF-5B, ZY-1 02D/02E, and Wyvern for mineral exploration, sub-meter optical satellites like Superview Neo-1 and BJ3N for daily operations, and radar satellites like LT-1 (L-band) and GF-3 (C-band) for ground deformation and all-weather imaging.
How often do satellites revisit an active mine site?
Revisit frequency depends on the constellation, location, and cloud cover, and ranges from daily for wide-swath monitoring constellations to a scheduled tasking request for sub-meter or hyperspectral imagery over a specific concession. InSAR deformation monitoring typically relies on a consistent revisit cadence over months to build a reliable time series, rather than a single pass.
Can satellite imagery replace ground-based mine inspections?
No. Satellite monitoring narrows down where a ground team needs to go and gives continuous coverage between site visits, but it does not replace physical inspection, drilling, or geochemical assay. It is used to prioritize field resources and catch early warning signs, such as deformation trends, that a periodic ground inspection alone would likely miss.
What is GISTM and how does satellite data support compliance?
The Global Industry Standard on Tailings Management (GISTM) is a tailings facility safety framework issued in August 2020 by the ICMM, UNEP, and the Principles for Responsible Investment, developed in response to the 2015 Mariana and 2019 Brumadinho dam disasters. Satellite InSAR monitoring is now standard practice for GISTM compliance, particularly at facilities classified as Extreme or Very High consequence, since it provides a continuous, independently verifiable deformation record.
Can satellites monitor mining through clouds, smoke, or at night?
Radar satellites can. Synthetic Aperture Radar (SAR) is an active sensor that transmits its own signal and reads the reflection, so it images through cloud cover, smoke, and total darkness. Optical and hyperspectral sensors depend on reflected sunlight and cannot see through cloud, which is why continuous mine monitoring typically pairs radar with optical imagery rather than relying on one alone.
Sources and further reading
- China Siwei and CNSA, GF-5/GF-5B, ZY-1 02D/02E, GF-3, and Superview Neo-1 satellite mission specifications
- Wyvern, hyperspectral constellation spectral band and resolution specifications
- Steyn, M. et al., "Advanced analysis of satellite data reveals ground deformation precursors to the Brumadinho Tailings Dam collapse," Communications Earth & Environment, 2020
- International Council on Mining and Metals (ICMM), Global Industry Standard on Tailings Management and 2025 Tailings Progress Report
- NASA and USGS, Landsat program NDVI and vegetation index research
Ready to put a mine site under satellite observation?
Search our archive for hyperspectral, high-resolution optical, and SAR coverage over your concession, or request new tasking and get results back in days.