Satellite Imagery for Mining Industry & Mine Monitoring
Satellite imagery for the mining industry supports every stage of the mine lifecycle, from mineral exploration and open-pit monitoring to tailings dam safety and site rehabilitation. High-resolution optical, hyperspectral, multispectral, and SAR data help exploration teams, mine operators, and ESG teams see change across a site long before it shows up on the ground.
XRTech Group delivers mining satellite imagery and the analytics built on top of it on a single platform, one source of high-resolution optical, hyperspectral, multispectral, SAR, and elevation data spanning exploration, active operations, environmental compliance, and closure. Search or task imagery over your own tenure or site, then turn it into mineral-probability maps, volumetric reports, deformation alerts, and rehabilitation evidence.
What is mining satellite imagery?
Mining satellite imagery is satellite-derived Earth observation data, optical, multispectral, hyperspectral, SAR, and elevation data, used to identify mineral deposits, monitor pits, stockpiles, and tailings infrastructure, track environmental impact, and verify rehabilitation across a mine site or exploration tenure. High-resolution and hyperspectral satellite imagery for mining lets exploration and operations teams compare a site against itself over time, instead of relying on periodic drone flights or ground visits alone.
How is satellite imagery used in mining?
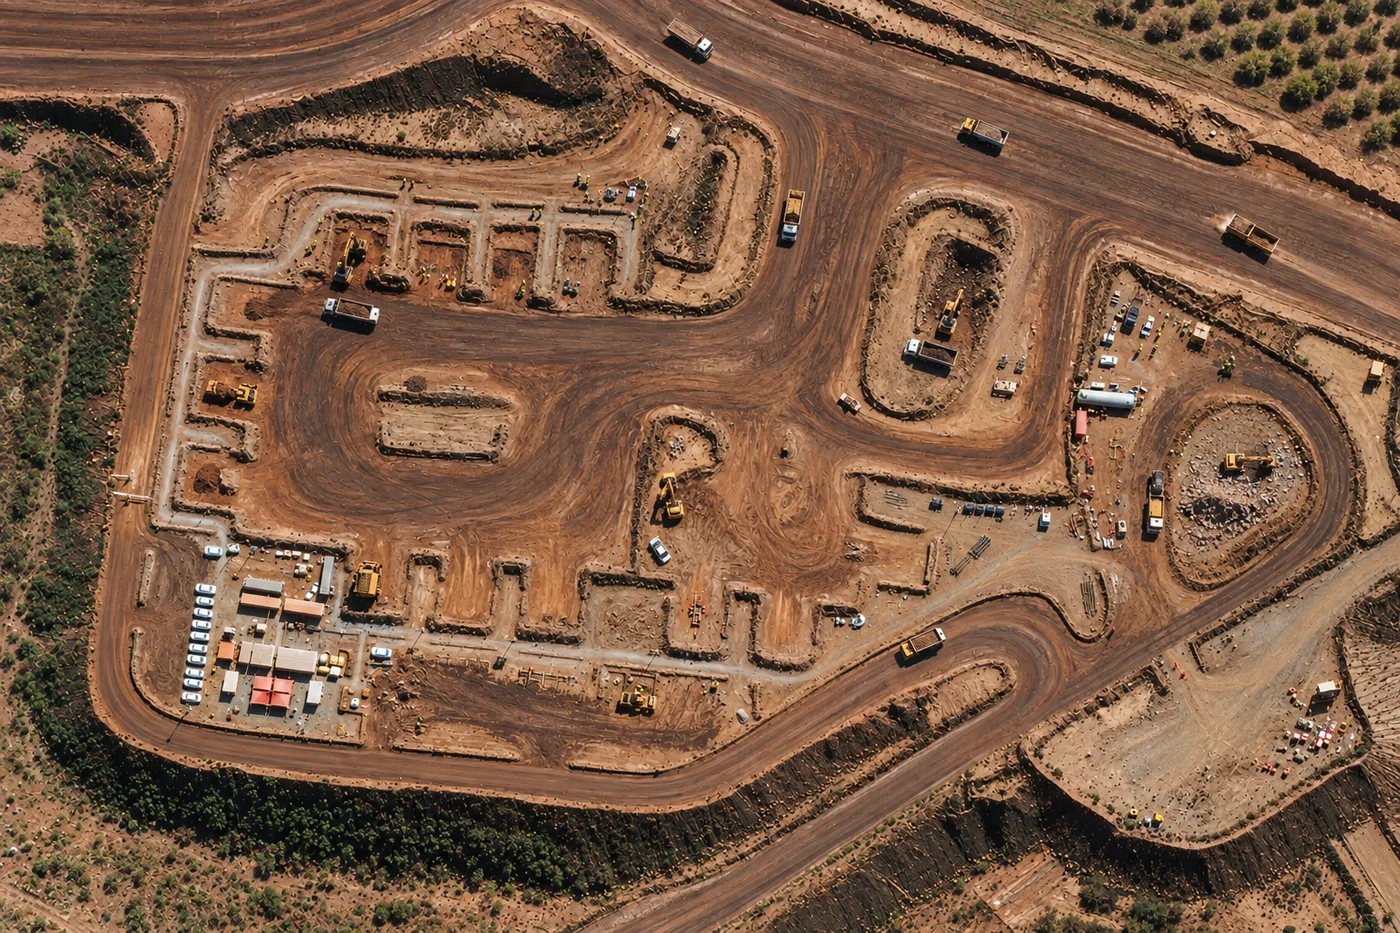
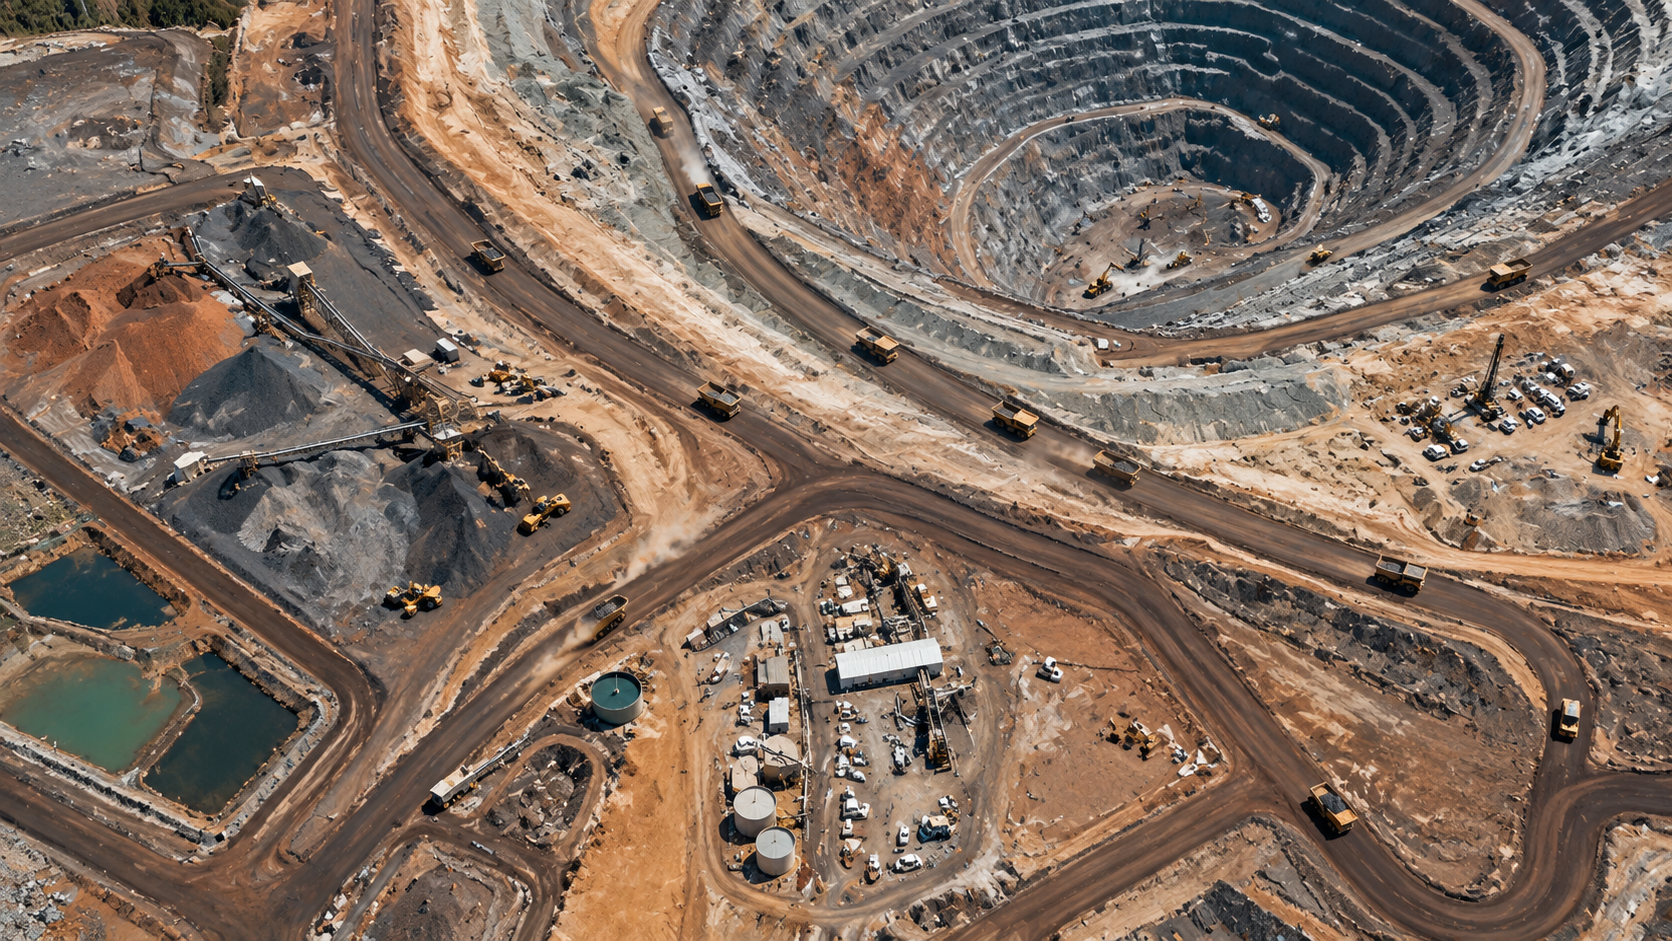
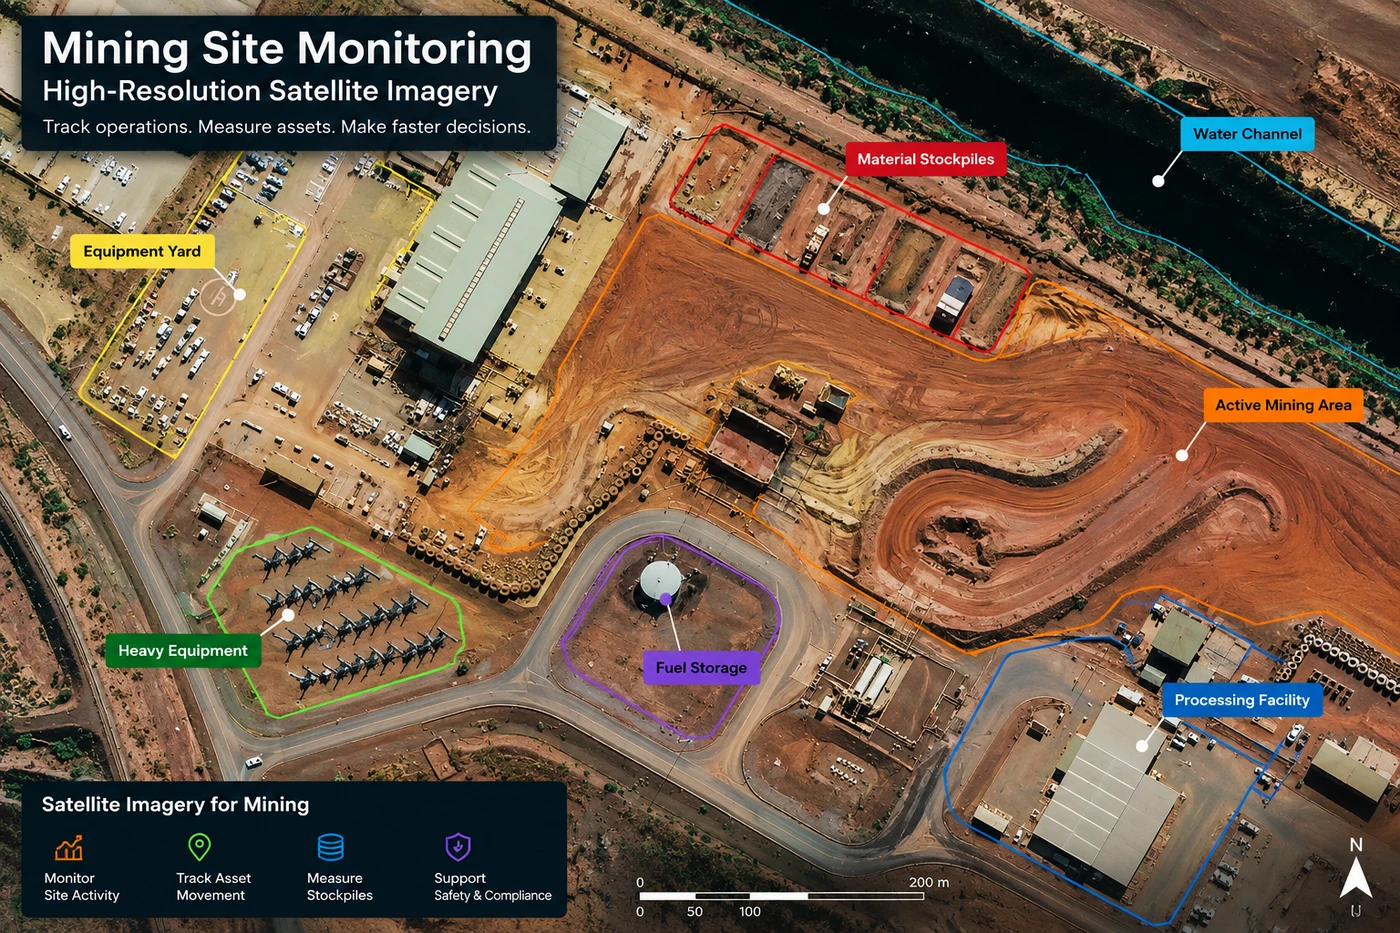
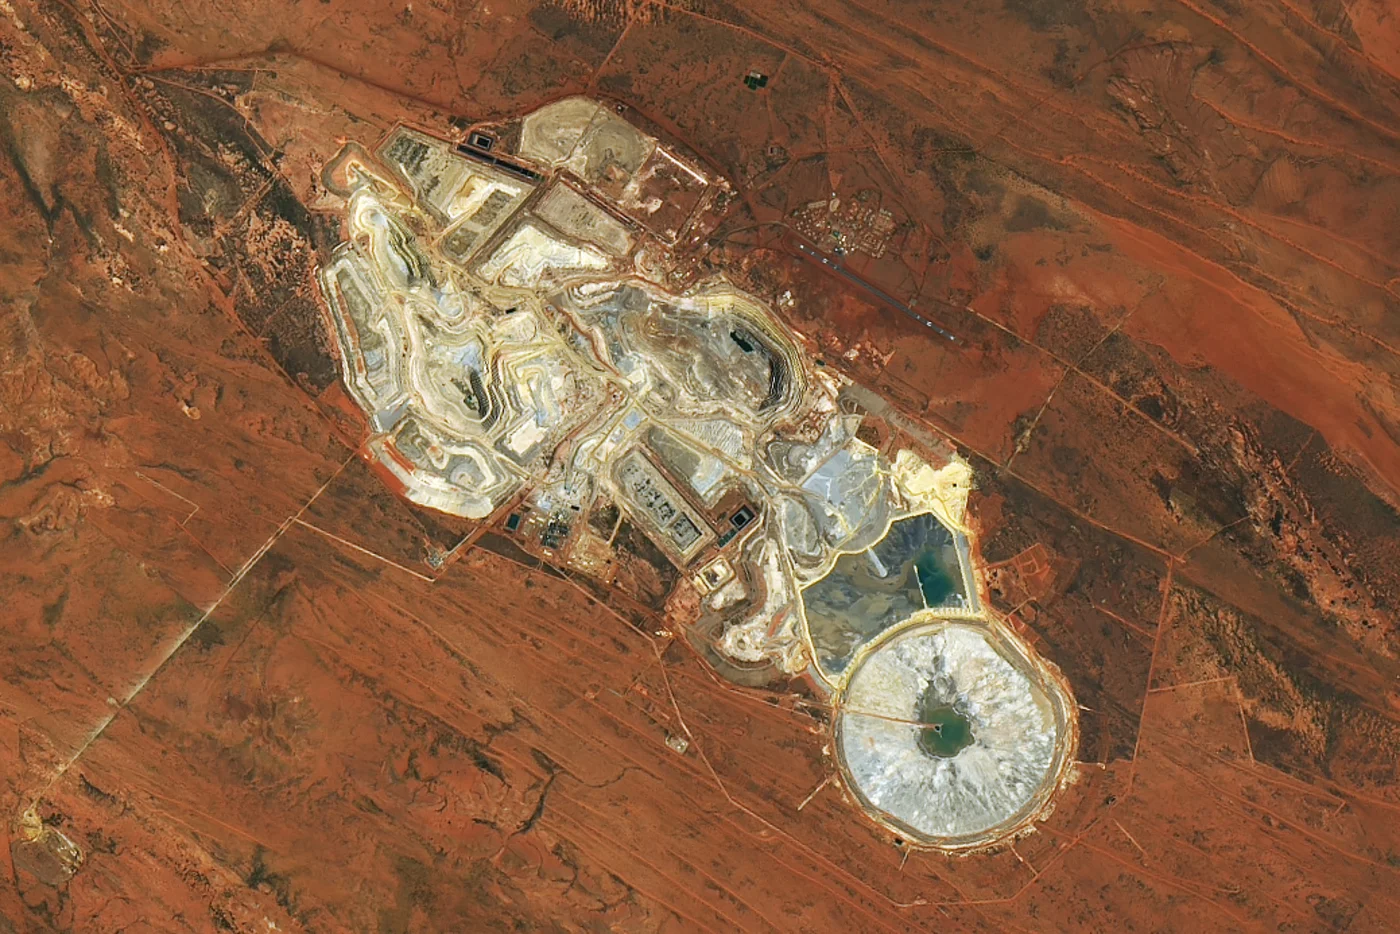
Satellite imagery is used in mining to map mineral targets and alteration zones, monitor open-pit progression and stockpile volumes, track tailings dam and slope stability, verify environmental compliance and rehabilitation, detect unauthorized activity, and watch the roads, rail, and ports that connect a site to market. A single high-resolution capture can separate equipment yards, stockpiles, active mining areas, and processing facilities into one site-wide operational picture, and comparing captures over time turns that picture into a trend.
30cmNative high-resolution optical detail
0.5mStereo-derived DEM/DSM for volumetrics
WeeklyTasking cadence for active pits & tailings
20+Satellite constellations, optical to hyperspectral
Mine Lifecycle
How Satellite Imagery Supports the Mining Lifecycle
Satellite imagery supports the mining lifecycle from early exploration through active operations to closure and rehabilitation, one dataset instead of a different record for every stage.
Explore — Hyperspectral and multispectral imagery map alteration minerals and structural targets across a tenure, narrowing where a ground program actually needs to go.
Develop & Permit — High-resolution optical and DEM data support site layout, access-road planning, and the baseline environmental record a permit application needs.
Operate — Scheduled optical, SAR, and elevation captures track pit progression, stockpile volumes, haul roads, and tailings dam stability through the life of the mine.
Close & Rehabilitate — Multi-year vegetation-index time series and disturbance-footprint mapping give regulators and investors defensible evidence of rehabilitation progress.
Process
How It Works
From a defined area of interest to analysis-ready products in your GIS, one pipeline for every capture.
Define Your Area & Question — Upload a shapefile, KML, or GeoJSON for your tenure or site and tell us the question, exploration targeting, monthly stockpiles, or quarterly rehabilitation. We match sensor, cadence, and processing to it.
Task or Pull From Archive — We search archive imagery across 20+ constellations and task the right sensor for a fresh capture where the archive falls short, all within your budget.
Process to Analysis-Ready Products — Captures are orthorectified, atmospherically corrected, and pansharpened into analysis-ready imagery, then used to derive elevation models, alteration maps, change layers, and vegetation time series.
Deliver to Your Stack — Products land in ArcGIS, QGIS, S3, or SFTP, in the format your platform expects, timestamped and attributable with no conversion step.
Examples
Mining Satellite Images
A sample of the imagery and derived data mining teams work with, from mineral-composition maps built for exploration to elevation models used for stockpile volumes.
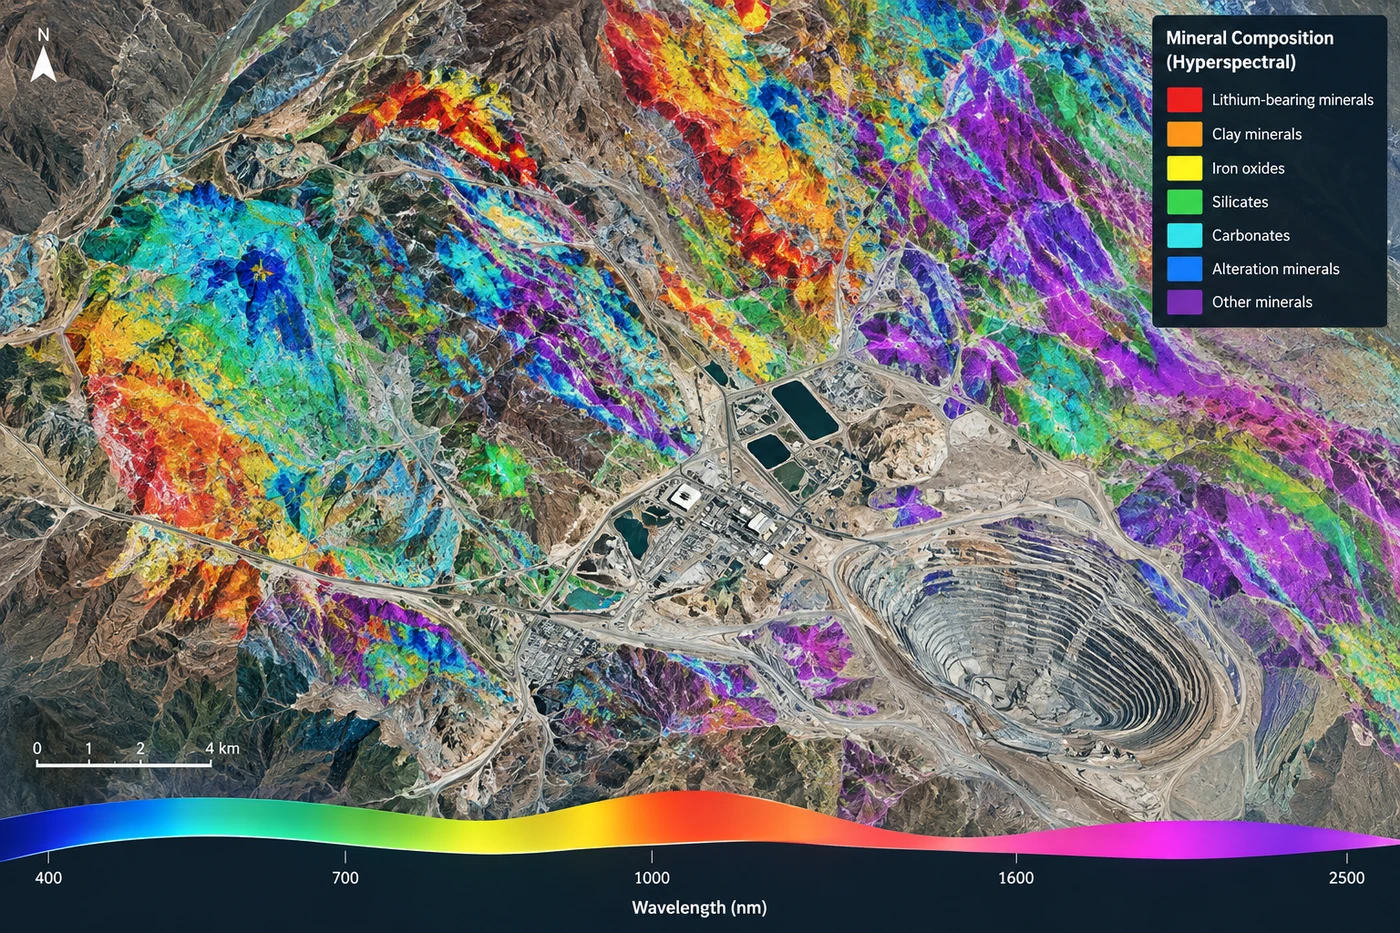
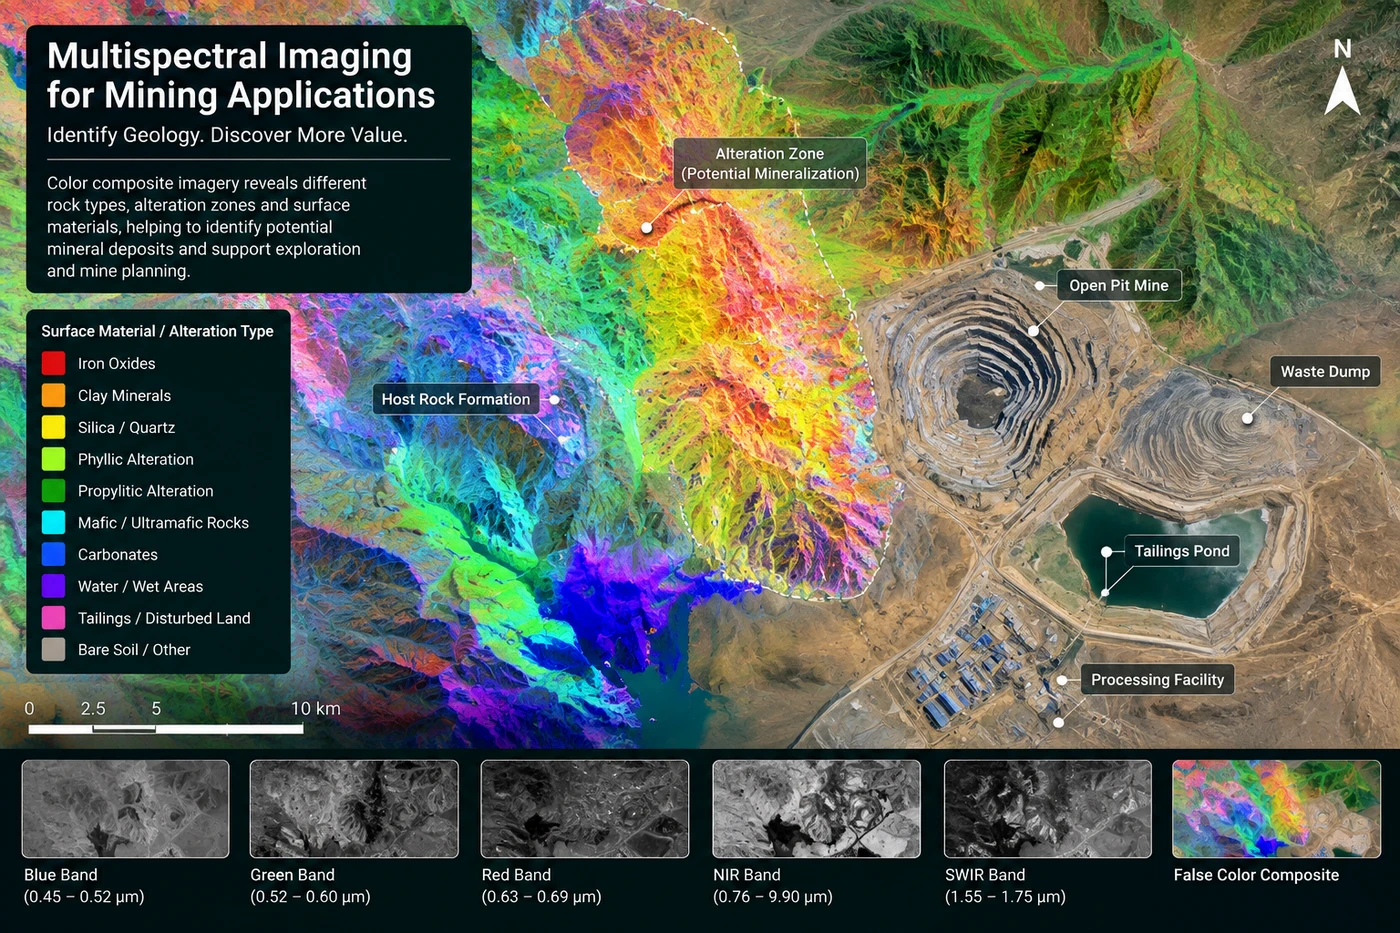
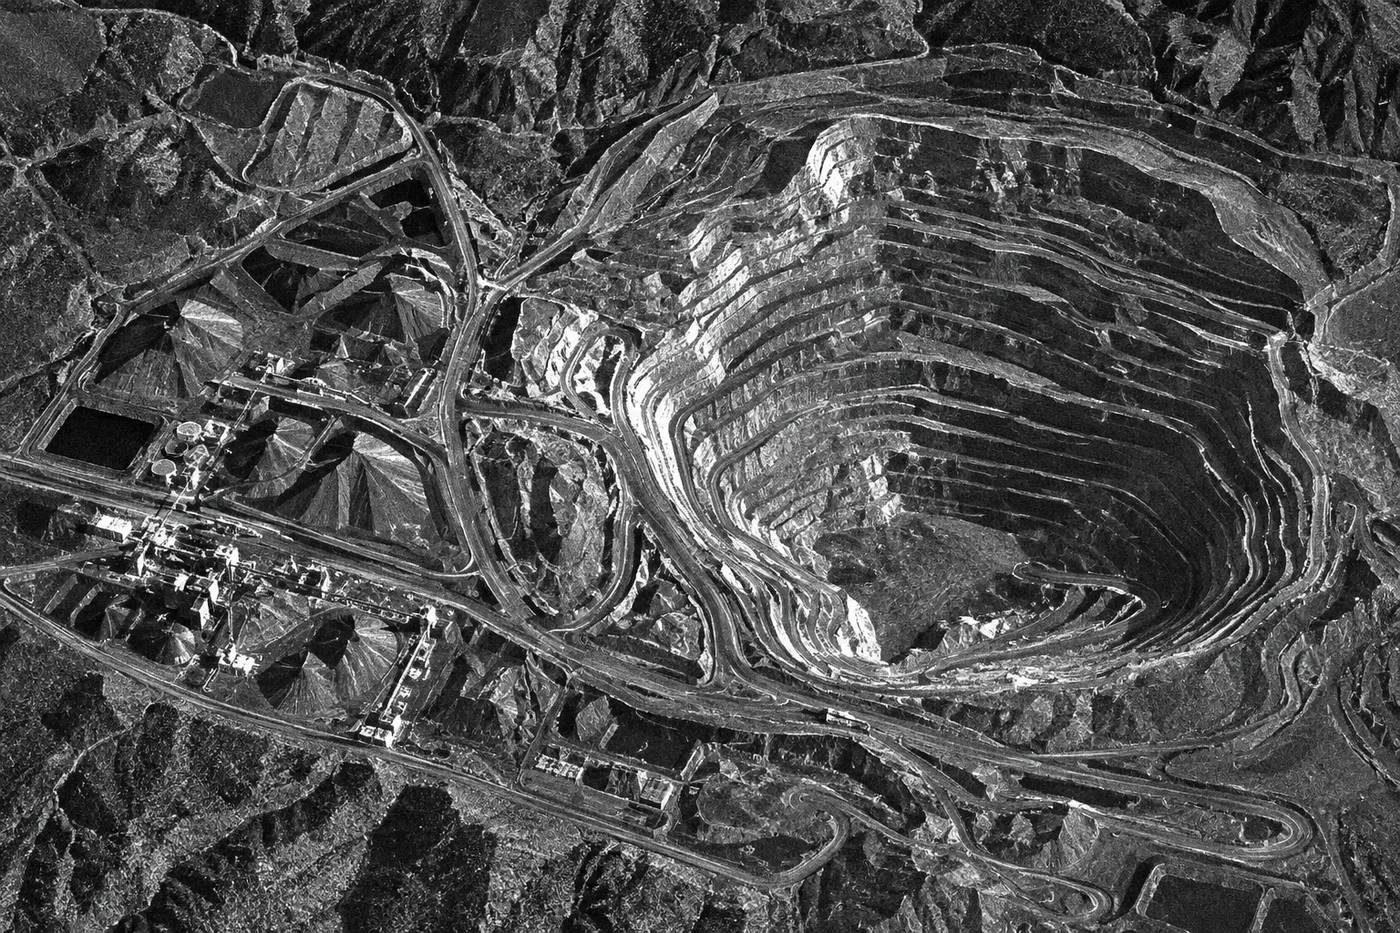
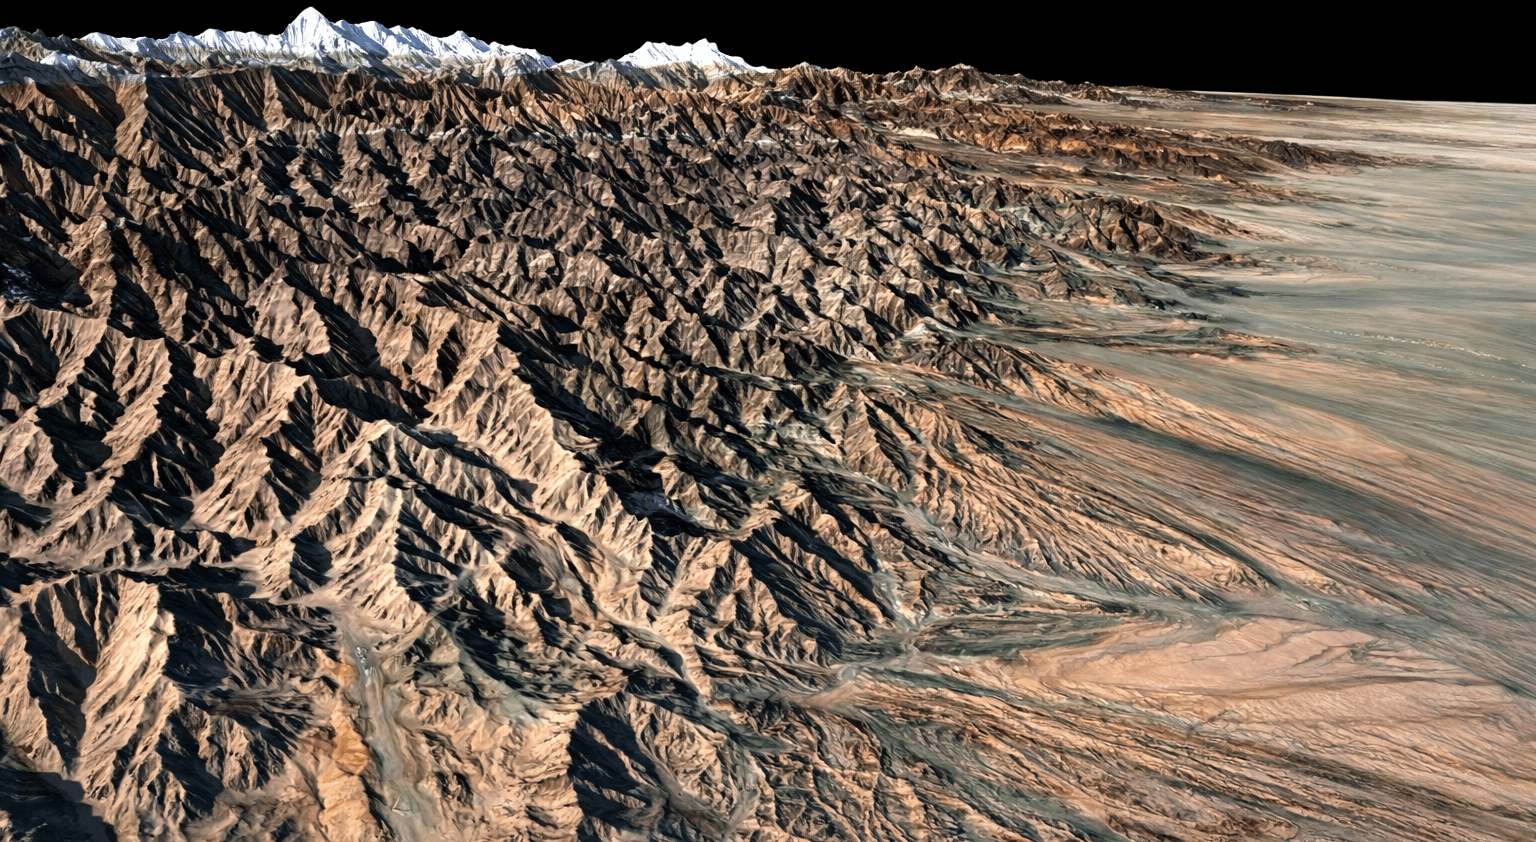
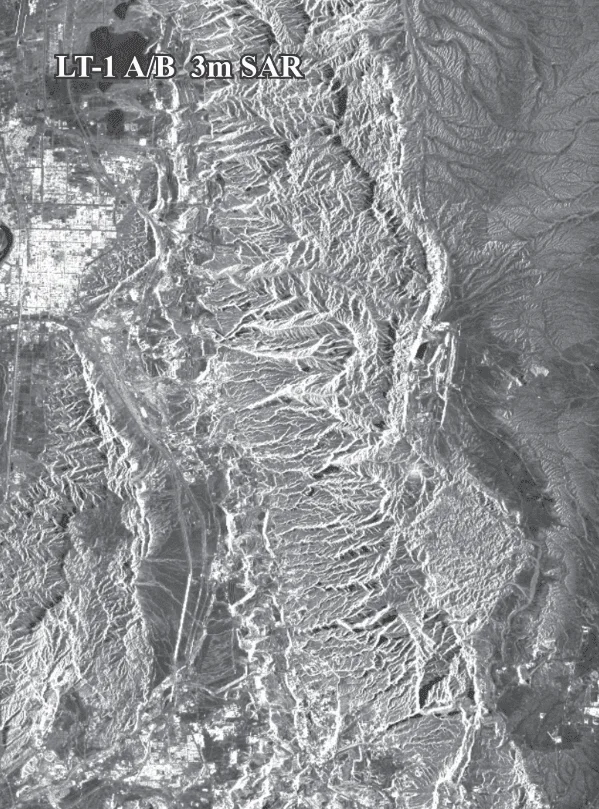
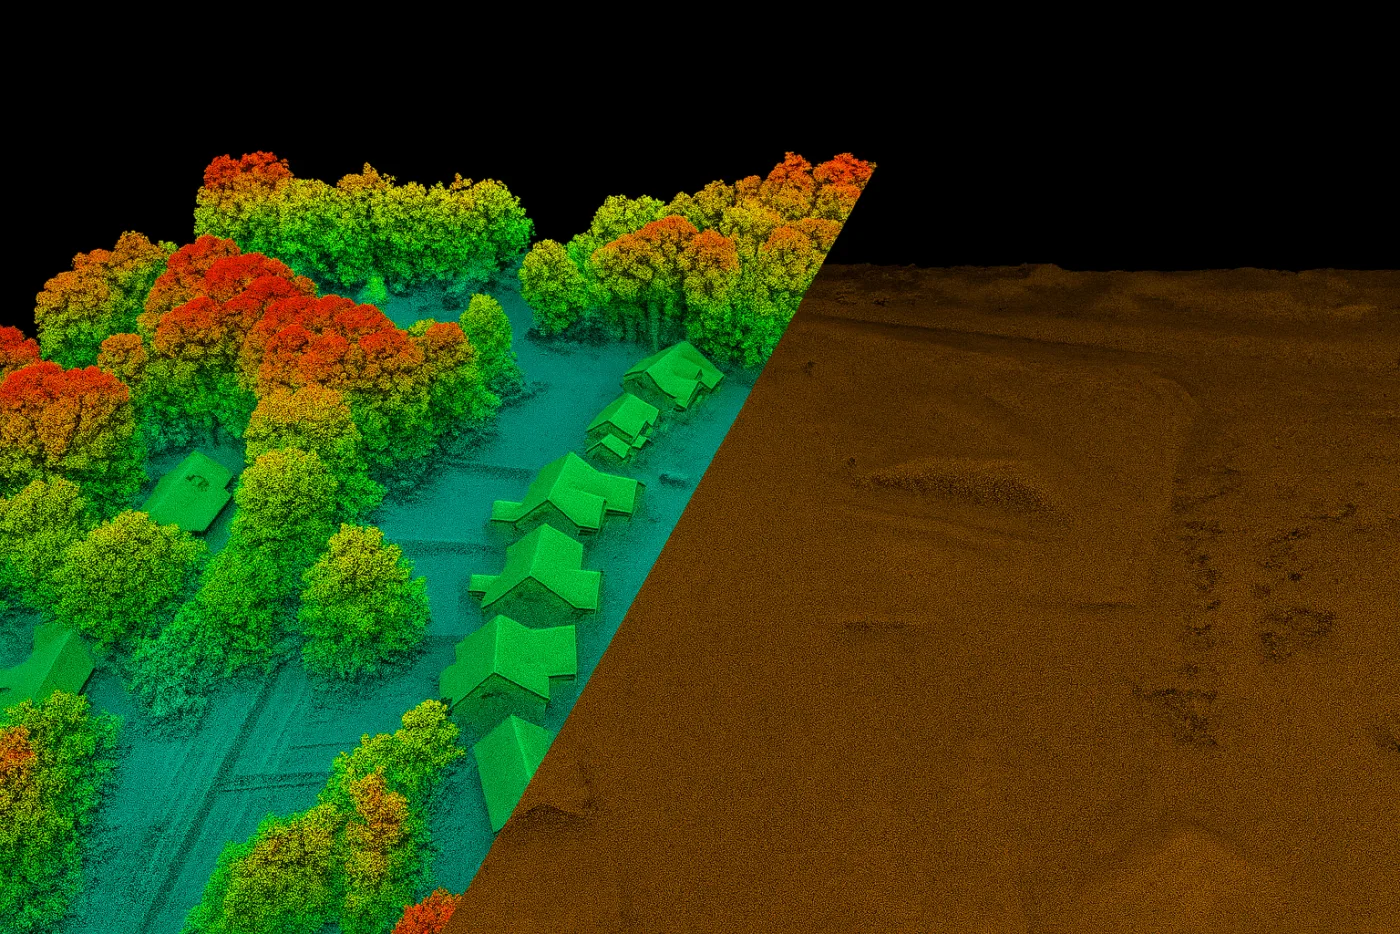
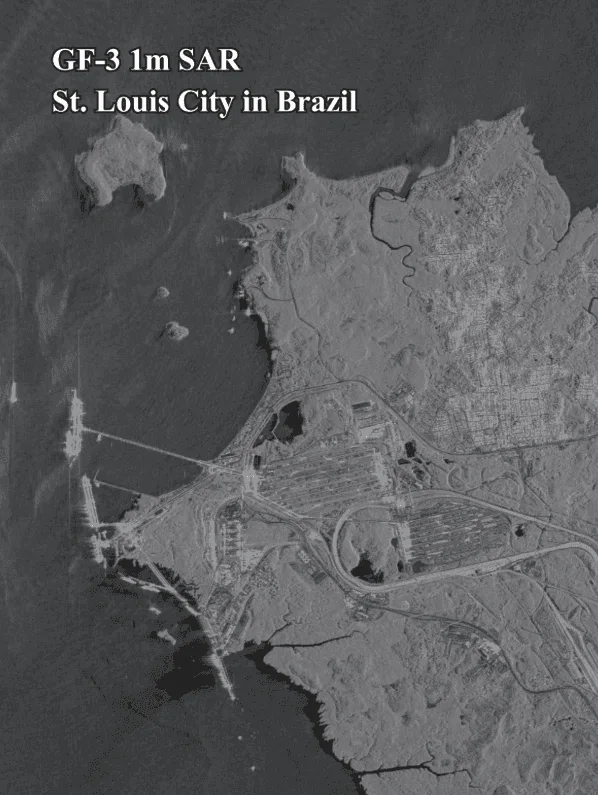
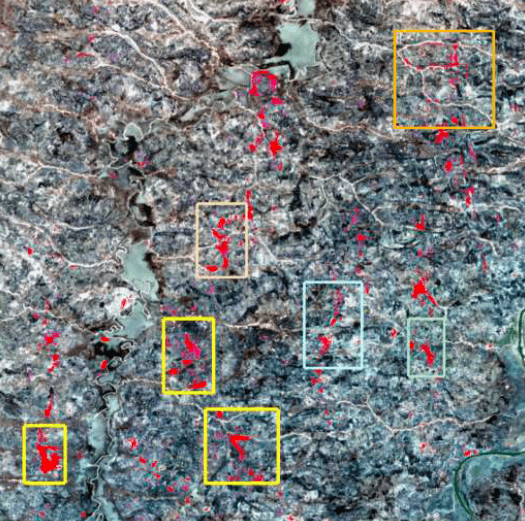
Hyperspectral imagery separates lithium-bearing minerals, clays, iron oxides, and other alteration signatures across an exploration tenure.Multispectral band combinations pick out alteration zones and host rock formations surrounding an active open-pit operation.SAR captures the same pit geometry day or night and through cloud cover, when optical tasking is not an option.A stereo-derived digital elevation model turns pit walls and stockpile faces into measurable volumes.
Who It's For
Who Uses Mining Satellite Imagery?
The same imagery supports different decisions depending on who is looking at it.
Exploration Geologists
Screen a tenure for alteration and structural targets before committing a drill budget to the ground.
Mine Operations & Site Managers
Track pit progression, stockpiles, and haul roads across a site without a drone flight for every update.
ESG & Sustainability Teams
Build a timestamped, multi-year rehabilitation record that holds up under an ESG or JORC-aligned audit.
Government & Regulatory Agencies
Verify permitted boundaries, flag unauthorized digging, and track environmental compliance across a region.
Investors, Insurers & Lenders
Get an independent, repeatable view of site activity and risk without relying on operator-reported figures alone.
Solutions
Satellite-Based Solutions for Mining Operations
From exploration to mine-to-port logistics, satellite data and AI analytics support every stage of the mining operation.
01 — SOLUTION
Mineral Exploration & Targeting
Before a drill rig ever moves, hyperspectral and multispectral imagery narrow a large tenure down to a short list of the strongest targets.
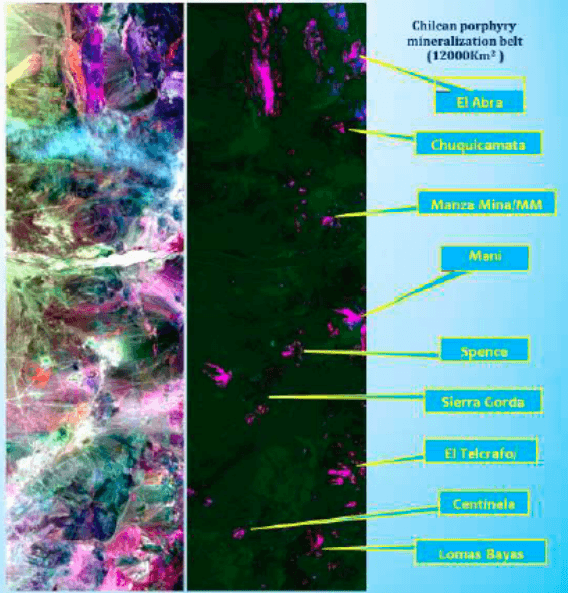
Hydrothermal Alteration Mapping: Hyperspectral sensors covering 400–2500nm separate hydroxyl-bearing clays and micas such as sericite, kaolinite, and illite from iron oxides like hematite, goethite, and jarosite, and from mafic alteration minerals such as chlorite and epidote, the mineral halos that typically surround porphyry copper, epithermal gold, and VMS deposits.
Structural & Fault Mapping: Band ratios and principal component analysis, combined with DEM-derived terrain products, delineate fault intersections and shear zones that control where fluids and mineralization concentrated.
Multi-Commodity Coverage: The same workflow supports targeting for precious and base metals like gold, copper, and iron ore, and for critical and battery minerals including lithium and rare earth elements, alongside industrial minerals such as fluorite.
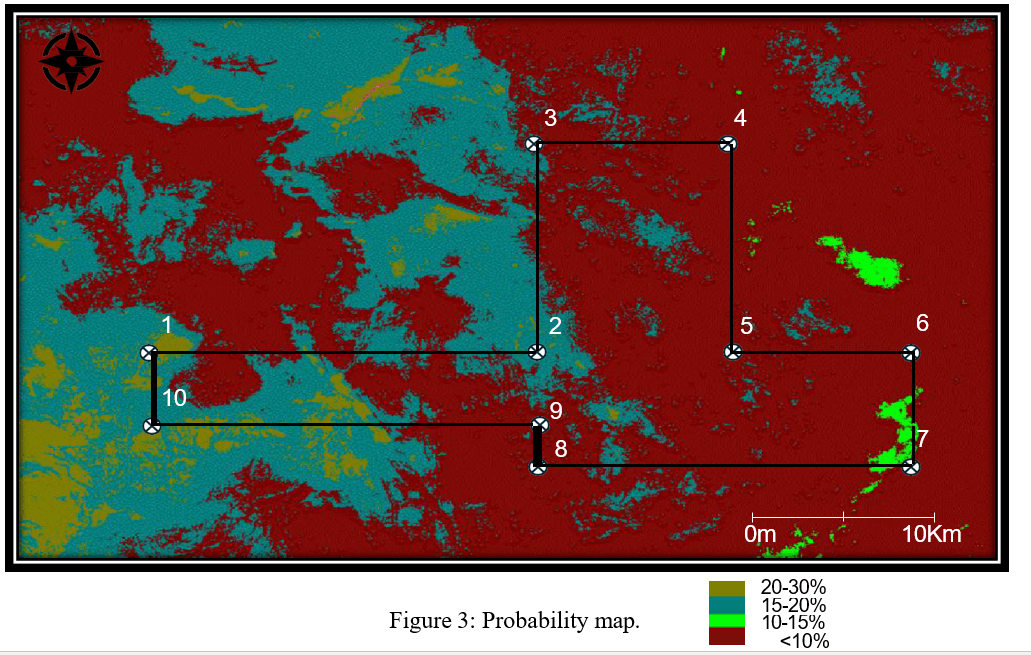
AI-Assisted Spectral Matching: Deep-learning classification fuses remote sensing layers with ground-truth sample signatures to produce location-specific mineral-probability maps, cutting exploration screening time well below a traditional ground survey alone.
02 — SOLUTION
Open-Pit & Stockpile Monitoring
Scheduled captures over an active site turn a series of images into a measurable record of exactly how the operation is changing.
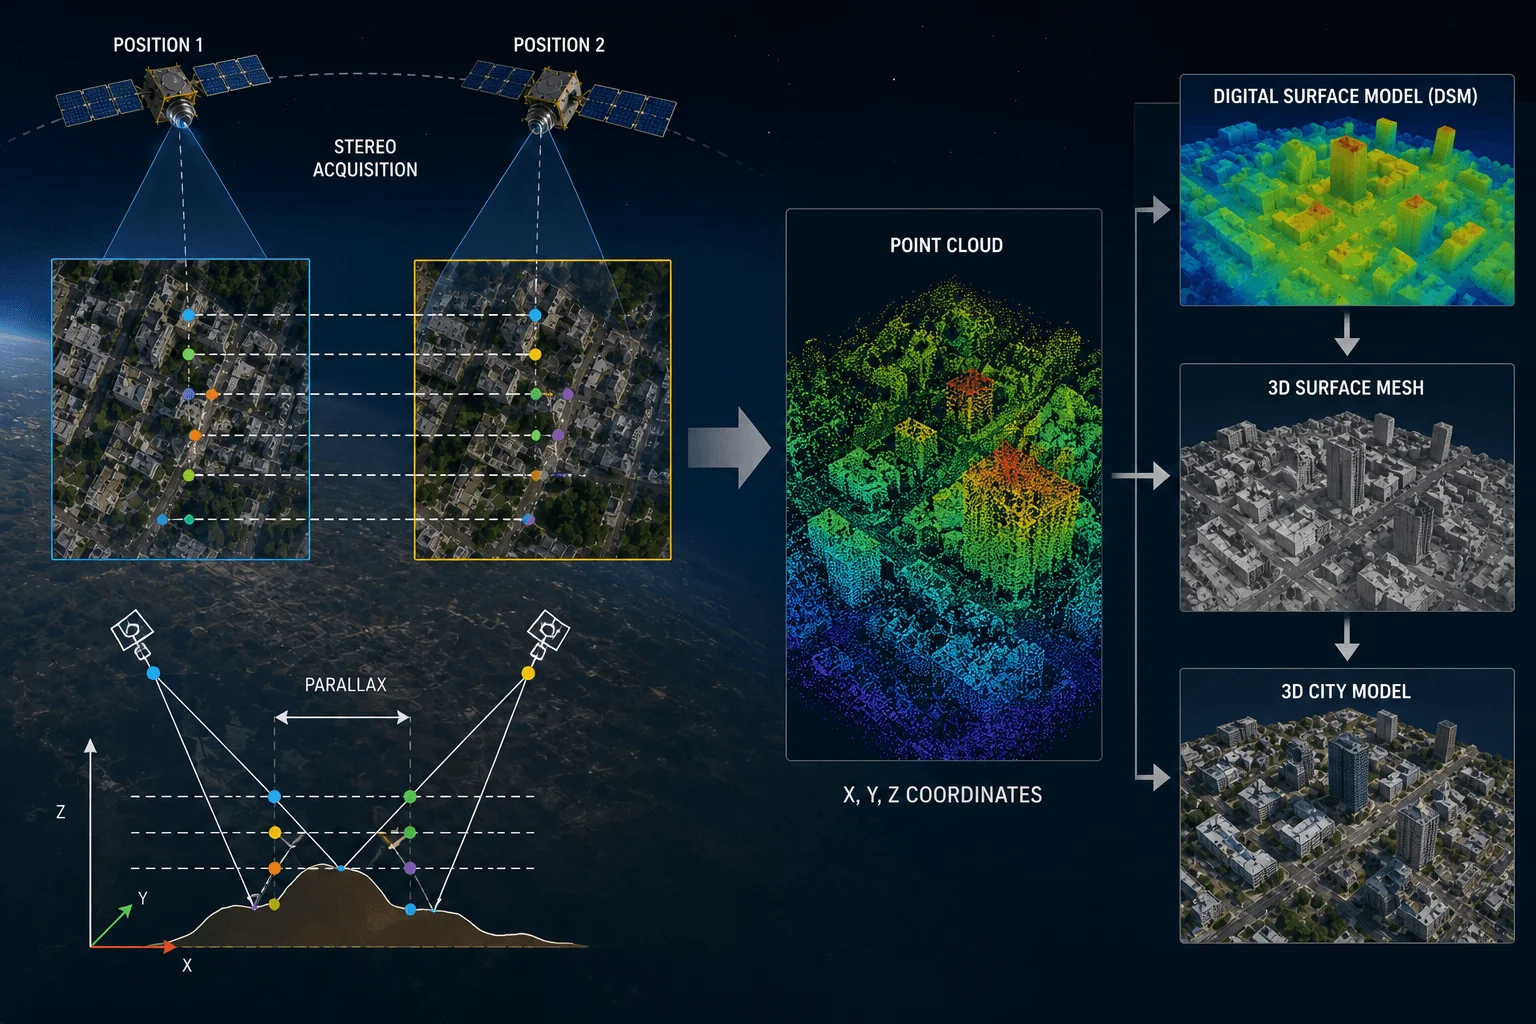
Stockpile & Pit Volumetrics: Stereo-derived digital elevation models down to 0.5m resolution measure stockpile, waste-dump, and pit volumes between captures, without a drone survey for every update.
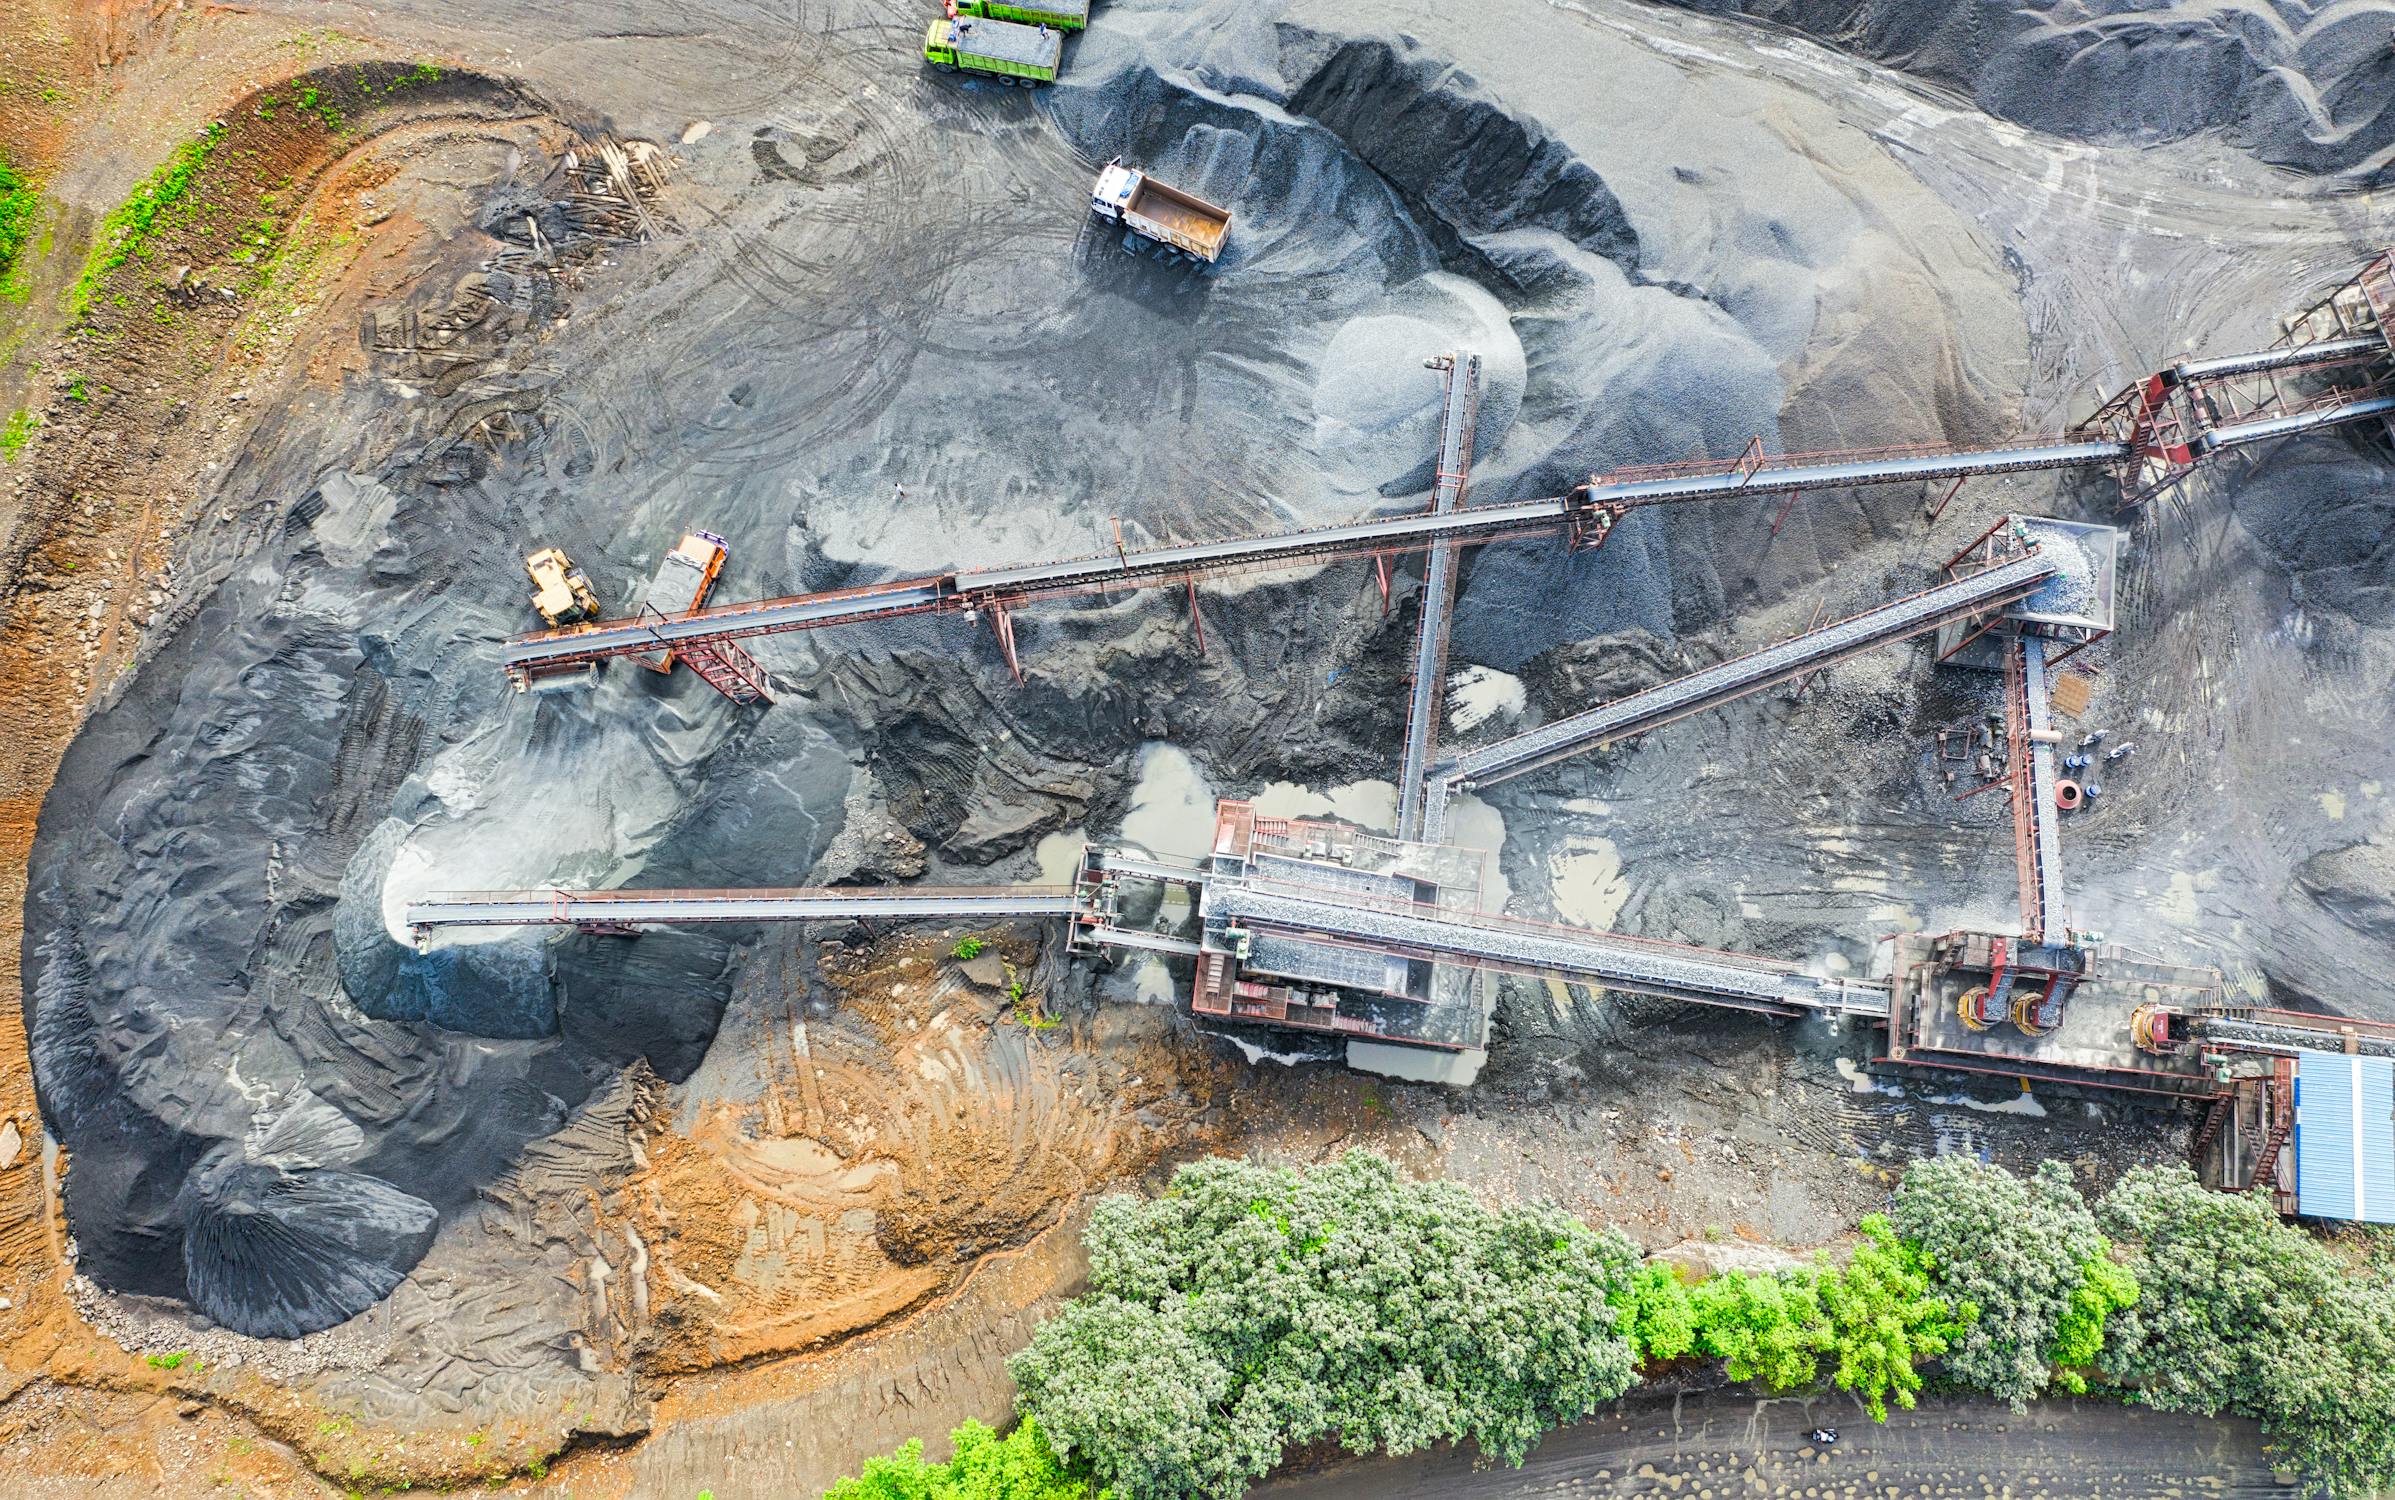
Haul Road & Infrastructure Tracking: Weekly-to-monthly optical tasking follows haul-road realignment, conveyor and process-plant build-out, and equipment yard activity across the site.
Site Digitisation & Base Maps: Feature extraction from high-resolution imagery refreshes GIS-ready base maps and digitises site assets into the layers your operations team already works in.
AI Change Detection: Automated before/after comparison flags material movement, new infill, and disturbance footprint expansion between scheduled captures.
03 — SOLUTION
Tailings Dam & Slope Stability Monitoring
Ground movement measured in millimeters, well before it is visible on the surface, is the difference between a scheduled repair and a dam failure.
InSAR Ground Deformation: Interferometric SAR compares the radar phase between repeat passes to measure ground movement at the millimeter level across tailings dams, waste-rock embankments, and high walls.
All-Weather, Day-Night Coverage: L-band and C-band SAR image through cloud, smoke, and darkness, so a deformation trend does not go unmeasured during a wet season or a dust event.
Pit Wall & Slope Safety: Routine optical change detection over high walls and benches, paired with SAR deformation data, flags slope movement that geotechnical teams can inspect before it becomes a failure.
Structural Risk Scoring: Deformation trends ranked across every monitored structure on a site turn a long inspection list into a short, prioritized one.
04 — SOLUTION
Environmental Compliance & Rehabilitation
Regulators, boards, and ESG auditors all want the same thing, a defensible, timestamped record, not a single site visit.
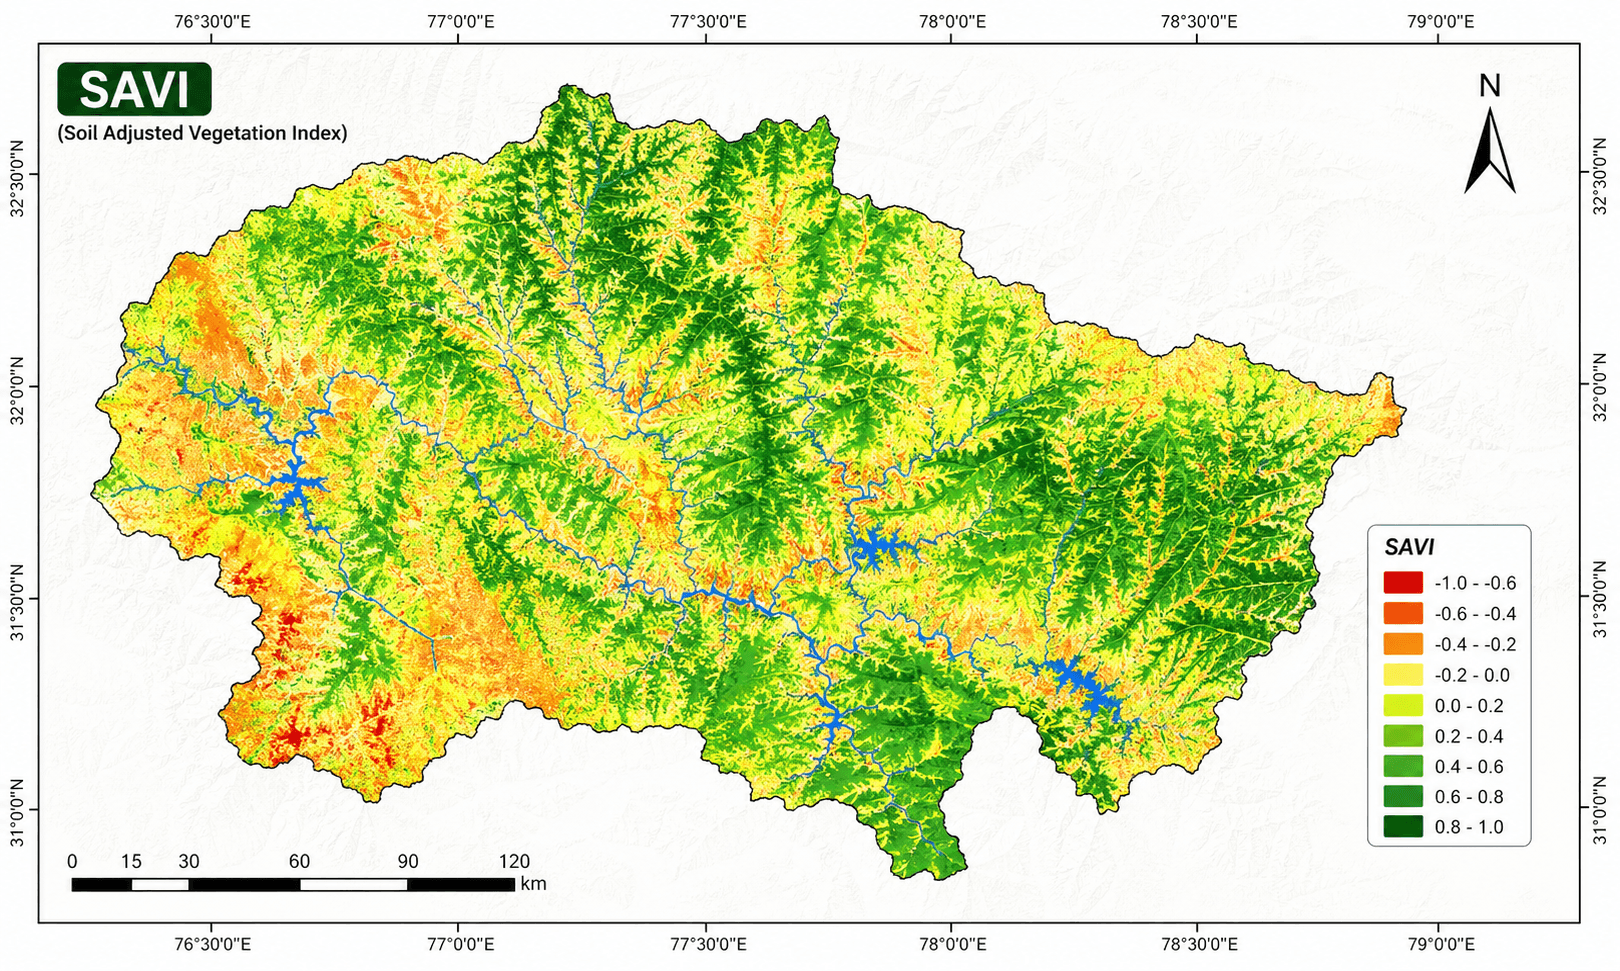
Vegetation Recovery Tracking: NDVI, EVI, and SAVI time series, built from multi-year archives, quantify revegetation progress against a regulatory baseline across an entire rehabilitation area, not just the plots a survey crew reached.
Disturbance Footprint Reporting: Change detection measures exactly how much land is disturbed at a given point in time, and how that footprint has grown or shrunk since the previous report.
Water Quality & Pollution Monitoring: Multispectral water-quality indices flag turbidity and discoloration in tailings ponds, pit lakes, and downstream waterways, surfacing a potential seepage or runoff issue early.
ESG & JORC-Aligned Evidence: Every capture is timestamped and geolocated, producing reproducible evidence that supports ESG disclosures and JORC-aligned reporting without assembling it from scattered ground records.
05 — SOLUTION
Illegal Mining Detection & Site Security
A remote tenure is hard to fence, but it is not hard to watch, once a scheduled imaging program is in place.
Unauthorized Activity Detection: Automated change detection flags new clearing, digging, or access roads inside a tenure boundary between scheduled captures, work a ground patrol would otherwise have to find on foot.
Tenure Boundary Verification: Comparing imagery against a lease or concession boundary confirms activity is staying inside permitted limits, useful for both compliance and dispute resolution.
Artisanal & Small-Scale Mining Mapping: Very high-resolution optical imagery resolves individual artisanal pits that lower-resolution archive data cannot, supporting both enforcement and formalization programs.
Around-the-Clock Coverage: SAR tasking extends the same detection capability through cloud cover and after dark, when optical satellites cannot see the ground.
06 — SOLUTION
Mine-to-Port Logistics & Infrastructure
Product still has to reach a port or a customer, and the rail lines, roads, and terminals along the way are worth watching too.
Haulage Corridor Monitoring: Repeat imagery along rail lines and haul routes between the mine and the port flags ground displacement, washouts, and structural stress before they interrupt shipments.
Port & Terminal Stockpile Tracking: The same optical and elevation workflow used on-site extends to bulk-export terminals, measuring stockpile volumes and tracking vessel loading activity.
Leak & Spill Detection: SAR and multispectral imagery help identify ground contamination or spill signatures along a transport corridor for a faster response.
Minerals & Commodities
Minerals & Commodities We Help You Target
Different commodities leave different alteration signatures behind, and different sensors are built to catch each one.
Commodity
Key Indicator & Alteration Minerals
Recommended Imagery
Gold
Sericite, kaolinite, and illite clays; iron oxides such as hematite, goethite, and jarosite in oxidized gossans
Hyperspectral + high-resolution optical
Copper (Porphyry)
Sericite, chlorite, and epidote across phyllic and propylitic alteration halos
Hyperspectral + multispectral band ratios
Lithium
Clay-mineral and evaporite signatures associated with brine and pegmatite deposits
Hyperspectral + SWIR analysis
Rare Earth Elements
Carbonatite and alkaline-complex alteration signatures
Hyperspectral
Iron Ore
Hematite- and goethite-rich gossans and oxidized caps
Multispectral + high-resolution optical
Fluorite & Industrial Minerals
Carbonate- and skarn-associated alteration zones
Hyperspectral + multispectral
Imagery Types
What Type of Satellite Imagery Is Best for Mining?
Different sensor types answer different mining questions, and most mining programs end up combining more than one.
Imagery Type
What It Reveals
Best For
High-Resolution Optical
Sharp, true-color detail down to individual vehicles and stockpiles
Site mapping, haul road tracking, base maps
Multispectral
Reflectance beyond visible light, including red-edge and near-infrared bands
Alteration mineralogy, mineral targeting, lithology mapping
Data & Methods
How Your Imagery Is Processed
Every capture goes through the same analysis-ready pipeline before it reaches you, not a raw scene you have to process yourself.
Processing Step
What It Does
Color Balancing
Radiometric harmonization across captures so imagery reads consistently scene-to-scene
Orthorectification
Sub-pixel geometric correction against ground control, so imagery aligns with your existing GIS layers
Pansharpening & Mosaicking
Panchromatic detail fused with multispectral color, then mosaicked into seamless area coverage
Atmospheric Correction (ATCOR)
Surface-reflectance output with cloud and shadow masking, ready for indices and change analysis
Stereo DEM / DSM / DTM Generation
Digital surface and terrain models built from stereo pairs for volumetrics and slope analysis
Delivery Formats
GeoTIFF, Cloud-Optimized GeoTIFF (COG), SHP, or GeoPackage, delivered to ArcGIS, QGIS, S3, or SFTP
Deliverables
The Outputs We Deliver
Every engagement includes raw data layers, a decision-ready report, and volumetric and change-detection reports, not just imagery.
Original Data Layers
Raw GeoTIFF, KML, or SHP datasets delivered ready to upload into ArcGIS, QGIS, or your own GIS environment.
Decision-Ready PDF Report
A summarized report of site changes, risk flags, and mineral-probability findings, ready to share with a board, lender, or regulator.
Volumetric & Change-Detection Reports
Stockpile and pit volume calculations, and before/after change layers, ready to drop into a production or compliance report.
Field Examples
Mineral Exploration in Practice
Recent hyperspectral and AI-driven exploration programs show what satellite-based mineral targeting can surface.
Gold Exploration · Mauritania
Ranking Gold Targets Across the Reguibat Shield
Deep-learning classification fused with hyperspectral and multispectral data across the Reguibat Shield and Tasiast region identified 10 high-confidence gold targets, with calculated deposit probabilities up to 21.69%, narrowing a vast tenure to a short, drill-ready list.
Gold Exploration · Tanzania
Mapping the Lake Victoria Gold Belt in Under 20 Days
A rapid hyperspectral and multispectral targeting program across the Lake Victoria Gold Belt delivered ranked target maps in under 20 days, pinpointing gold mineralization adjacent to existing artisanal workings.
Copper Exploration · Chile
Prioritizing Drill Targets in the Andean Copper Belt
Hyperspectral mapping of hydrothermal alteration zones and iron anomalies across the Andean copper region gave exploration partners the evidence to reprioritize drilling schedules toward the strongest targets.
Prospecting for gold specifically? Our satellite gold map page covers free NASA and USGS data sources, real Australia and USA gold district examples, and honest limits on what satellites can detect.
Pricing & Delivery
Mining Satellite Imagery Pricing
Transparent per-km² pricing for archive and new-tasking imagery, delivered in the GIS format your team already works in. Not sure what you need? Tell us your site and monitoring requirement and we'll recommend the right imagery.
Standard Archive
Existing imagery, 90+ days old — ready to download within minutes
Super High Resolution (25-30cm)$20/km²
Very High Resolution (31-50cm)$13/km²
High Resolution (51-80cm)$5/km²
Wide Area (2m)$1/km²
Minimum order area 25km² per scene.
New Satellite Tasking
Fresh capture of your exact site and date range
Super High Resolution (25-30cm)$30/km²
Very High Resolution (31-50cm)$20/km²
High Resolution (51-80cm)$8/km²
Wide Area (2m)$2/km²
Minimum order area 100km² per scene. Priority tasking available ahead of board reviews or permitting deadlines.
Why Satellite Monitoring
Application Benefits
Faster Exploration
Hyperspectral screening narrows a tenure to the strongest targets before ground crews mobilize.
Lower Operating Risk
Early deformation and change-detection signals turn a surprise into a scheduled repair.
Stronger Compliance Evidence
Timestamped, reproducible imagery supports ESG, JORC, and regulatory reporting without a scramble.
Better Investor Confidence
An independent, repeatable view of site activity that does not depend on operator-reported figures alone.
Improved Site Safety
Slope and tailings deformation trends surface a hazard before it becomes an incident.
From the Blog
Mining Guides From Our Blog
More on mineral exploration, mine monitoring, and satellite-based compliance reporting.
Mining satellite imagery is satellite-based Earth observation data, optical, multispectral, hyperspectral, SAR, and elevation data, used across the mine lifecycle to identify mineral deposits, monitor pits, stockpiles, and tailings dams, track environmental impact, and verify rehabilitation, without relying on ground surveys alone.
How is satellite imagery used in mining?
Satellite imagery is used in mining for mineral exploration and alteration mapping, open-pit and stockpile monitoring, tailings dam and slope stability tracking, environmental compliance and rehabilitation reporting, illegal mining detection, and mine-to-port logistics monitoring. Different sensor types answer different questions, and most mining programs combine more than one.
What resolution do I need to monitor a mine site?
It depends on the question. Wide-area, 2m to 10m imagery can detect medium-scale mining activity across a region, but resolving individual haul trucks, artisanal pits, or precise stockpile boundaries needs very high-resolution imagery, typically 30cm to 50cm.
Can hyperspectral imagery really detect specific minerals like lithium or copper?
Hyperspectral sensors measure reflectance across hundreds of narrow, continuous bands from about 400 to 2500nm, enough to fingerprint the alteration minerals that surround lithium, copper, gold, and rare-earth deposits, including clays, iron oxides, and mineral halos linked to hydrothermal systems. It maps surface mineralogy and alteration signatures rather than detecting a buried deposit directly, narrowing where a ground program should focus.
How does satellite imagery detect tailings dam problems before they fail?
Interferometric SAR (InSAR) compares the radar phase between repeat satellite passes to measure ground movement at the millimeter level. Applied to a tailings dam or waste-rock embankment, it surfaces deformation trends well before they would be visible on the surface or show up as a structural failure.
Can satellites detect illegal or unauthorized mining activity?
Yes. Automated change detection applied to repeat imagery flags new clearing, digging, or access roads inside a tenure or concession boundary. Sentinel-2-class imagery at 10m resolution can detect medium-scale unauthorized mining, while very high-resolution optical imagery resolves individual artisanal pits for closer enforcement or formalization work.
How does satellite imagery support ESG and JORC-aligned rehabilitation reporting?
Multi-year NDVI, EVI, and SAVI vegetation-index time series, combined with disturbance-footprint change detection, give a timestamped, reproducible record of rehabilitation progress across an entire site, evidence that holds up under an ESG or JORC-aligned audit better than a single site-visit snapshot.
What type of satellite imagery is best for mining?
High-resolution optical imagery is best for site mapping and haul road tracking, multispectral and hyperspectral imagery are best for alteration mapping and mineral targeting, SAR (radar) imagery works through cloud cover for all-weather monitoring and InSAR deformation, and DEM/DSM elevation data is best for stockpile and pit volumetrics. Most mining programs combine more than one.
How accurate are satellite-derived stockpile and pit volume measurements?
Stereo-derived digital elevation models down to 0.5m resolution measure stockpile, waste-dump, and pit volumes between captures at sub-meter vertical precision, comparable to a drone survey for most reporting purposes, without needing a drone flight for every update.
What satellite constellations are used for mining monitoring?
We combine ultra-high-resolution optical imagery (SuperView Neo-1 at 0.3m, TripleSat, SuperView-2 at 0.42m) with GF-6 and GF-1 wide-swath optical data, GF-3 and LT-1 SAR for all-weather monitoring and InSAR, and hyperspectral sensors including GF-5/GF-5B AHSI (330 bands), ZY-1 02D/02E, and Wyvern for mineral and alteration mapping.
How is mining satellite imagery delivered and priced?
Imagery is delivered through a cloud platform in GeoTIFF, SHP, DWG, or UTM format. Standard archive imagery starts at $1/km² for 2m wide-area resolution up to $20/km² for 25-30cm, while new tasking for a fresh capture runs from $2/km² up to $30/km², with priority tasking available ahead of board reviews or permitting deadlines.
What outputs are included with a mining satellite monitoring report?
Each engagement includes original GeoTIFF, KML, or SHP data layers ready to upload into ArcGIS or QGIS, a decision-ready PDF report summarizing site changes and risk flags, and volumetric and change-detection reports covering stockpile and pit volumes.
Ready to Monitor Your Mine Site From Orbit?
Search our live archive or request new tasking over your tenure or site, optical, hyperspectral, SAR, or DEM.