How to Monitor Pipeline Right-of-Way for Encroachment From Orbit
On this page
- Sub-Meter Optical Satellites Spot New Ground Activity
- SAR and InSAR Catch What Optical Can't See
- AI Change Detection Automates the Corridor Audit
- DEM and DSM Quantify How Much Earth Actually Moved
- Putting the Four Layers Together
- Satellite Patrols Are Now PHMSA-Recognized
- How XRTech Monitors Pipeline Corridors
- Frequently asked questions
- Sources and further reading
Quick answer
Satellites catch unauthorized construction near a pipeline corridor by layering four data types over the same right-of-way. Sub-meter optical satellites (0.25 to 0.65 m, like SuperView Neo-1, SuperView-2, and GF-7) spot new equipment, foundations, fences, and vehicle tracks on the ground. Synthetic Aperture Radar (SAR) satellites like GF-3 and LT-1 see through cloud and darkness, and InSAR compares radar passes to catch ground movement down to a millimeter or two, which flags tunneling or excavation near a buried line before it shows on the surface. AI-based change detection compares images automatically, instead of someone scanning thousands of kilometers of imagery by eye, and flags new structures or disturbed soil inside the right-of-way. Digital Elevation Models (DEM) measure how much earth has actually moved. Run together on a repeating schedule, this combination turns pipeline monitoring from a periodic ground patrol into a standing, automated watch.
Why excavation damage is worth watching for
Excavation-related pipeline incidents and accidents in the US since 2005, per PHMSA's April 2026 advisory bulletin.
Fatalities tied to those incidents, with 166 serious injuries and roughly $322 million in property damage.
Share of 2025 gas-distribution excavation damages caused by excavator error, the single largest root cause PHMSA tracks.
Sub-Meter Optical Satellites Spot New Ground Activity
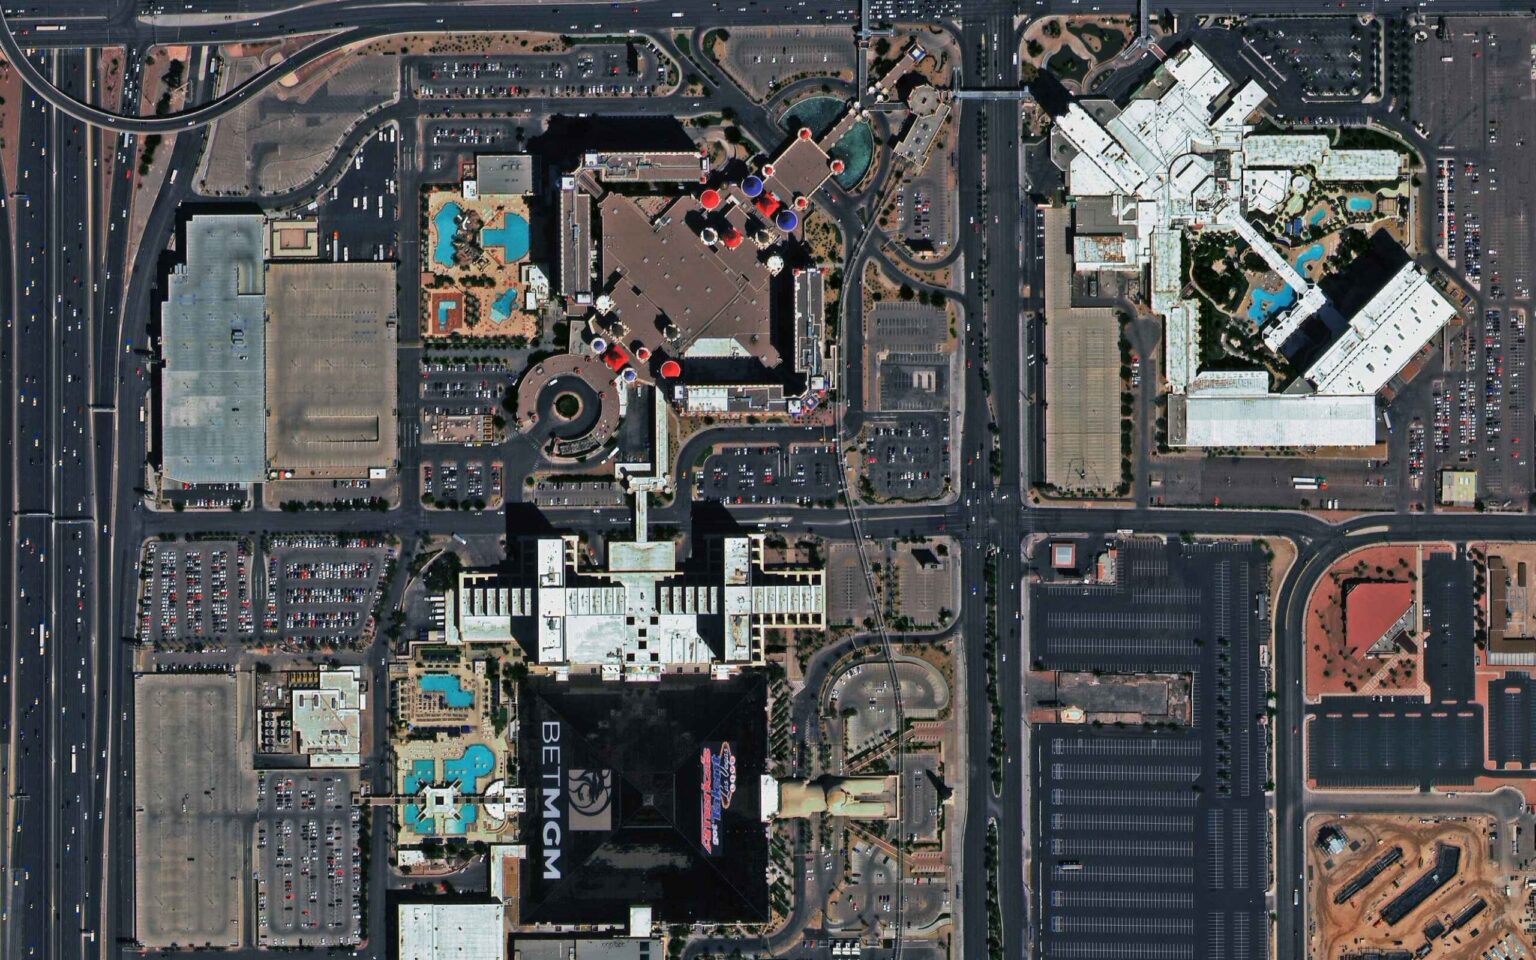
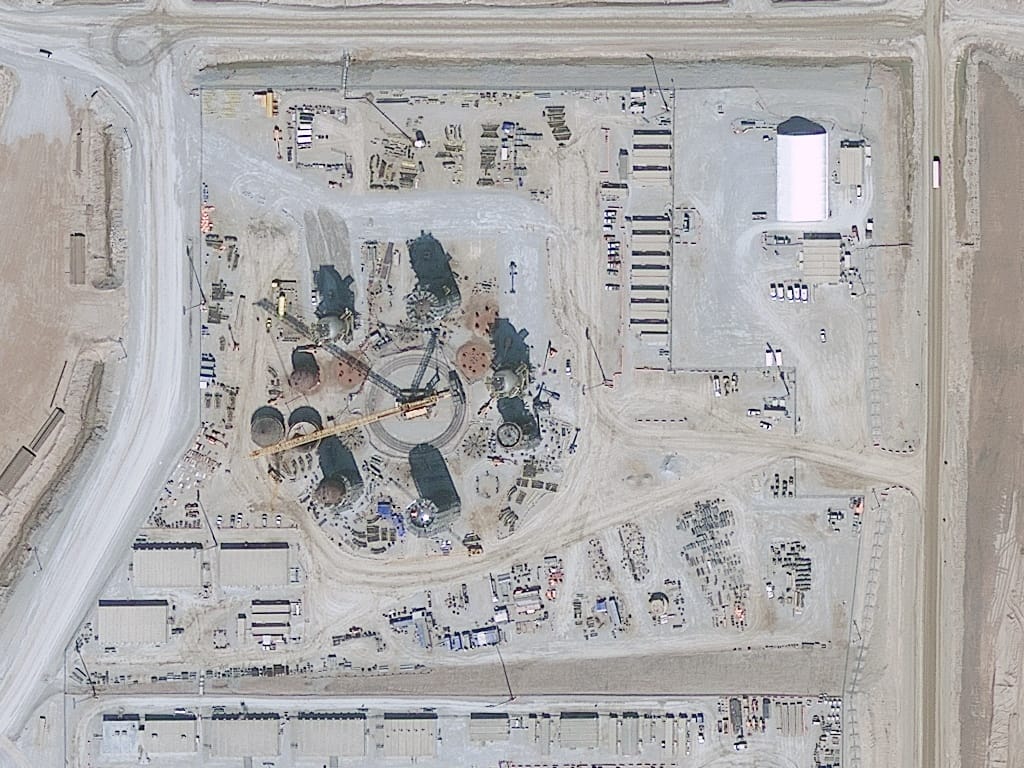
This is the most direct layer, a sharp enough picture to recognize what's actually there.
| Satellite | Resolution | Revisit | What it catches |
|---|---|---|---|
| SuperView Neo-1 | 0.25 to 0.3 m | Daily | Individual vehicles, small foundations, fresh trenching |
| SuperView-2 | 0.42 m | 1 to 3 days | Fence lines, building footprints, cleared vegetation |
| SuperView-1 | 0.5 m | Under 1 day, 4-satellite fleet | Wide-corridor baseline sweeps, repeat comparison |
| GF-7 | 0.65 m, stereo | Tasked | 3D terrain pairs for grading and earthwork volume |
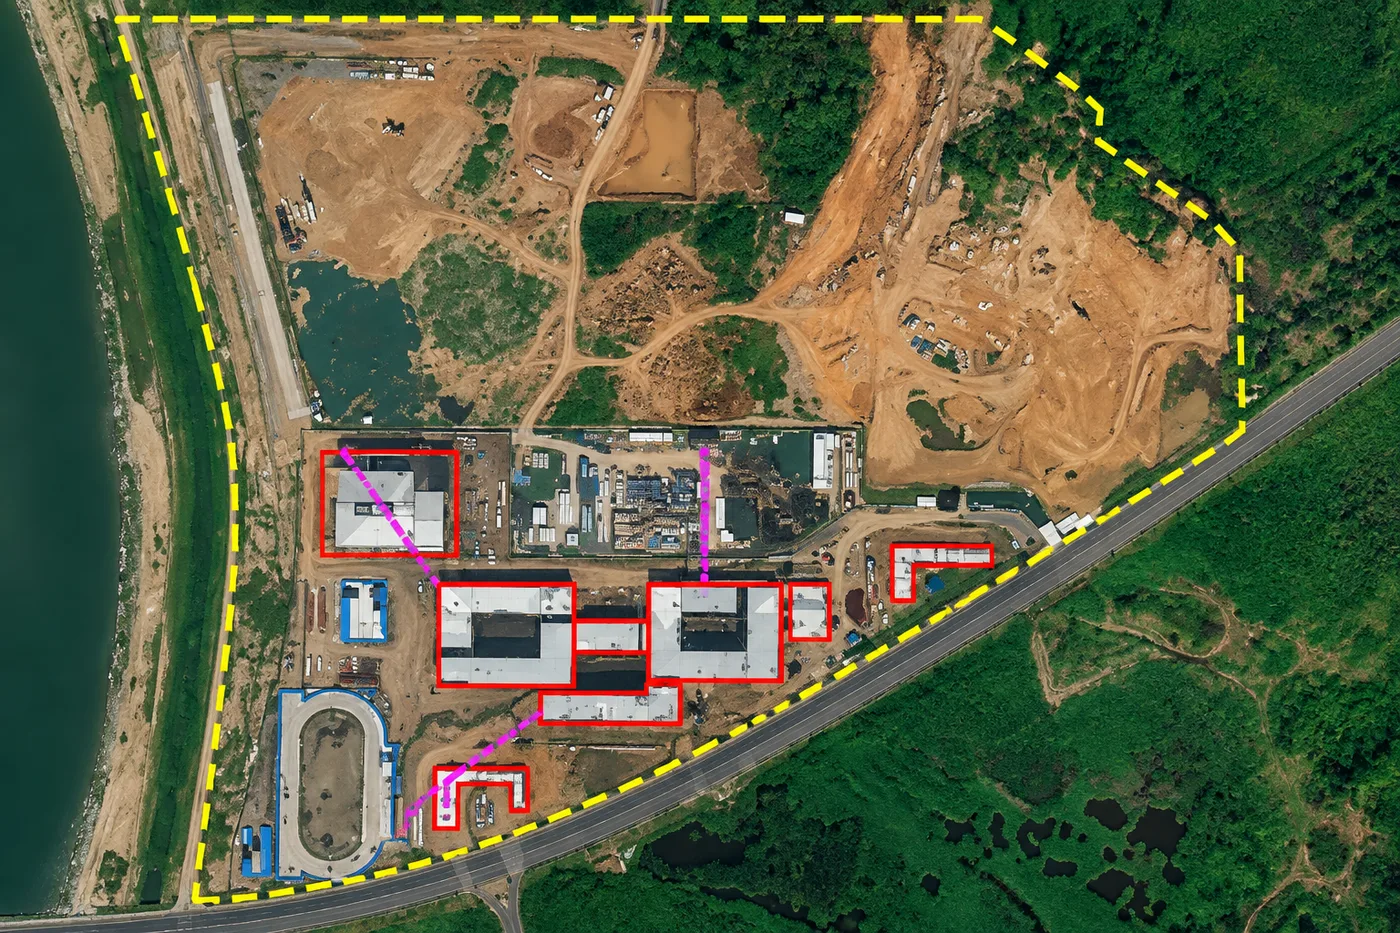
- Heavy equipment. Excavators, cranes, and trucks show up as distinct shapes at sub-meter resolution, inside or right at the edge of a safety buffer.
- Early-stage construction. Building foundations, fence posts, and cleared ground appear well before a structure is finished.
- New tracks. Vehicle paths crossing into a restricted zone show up as a visible change against the last clean pass.
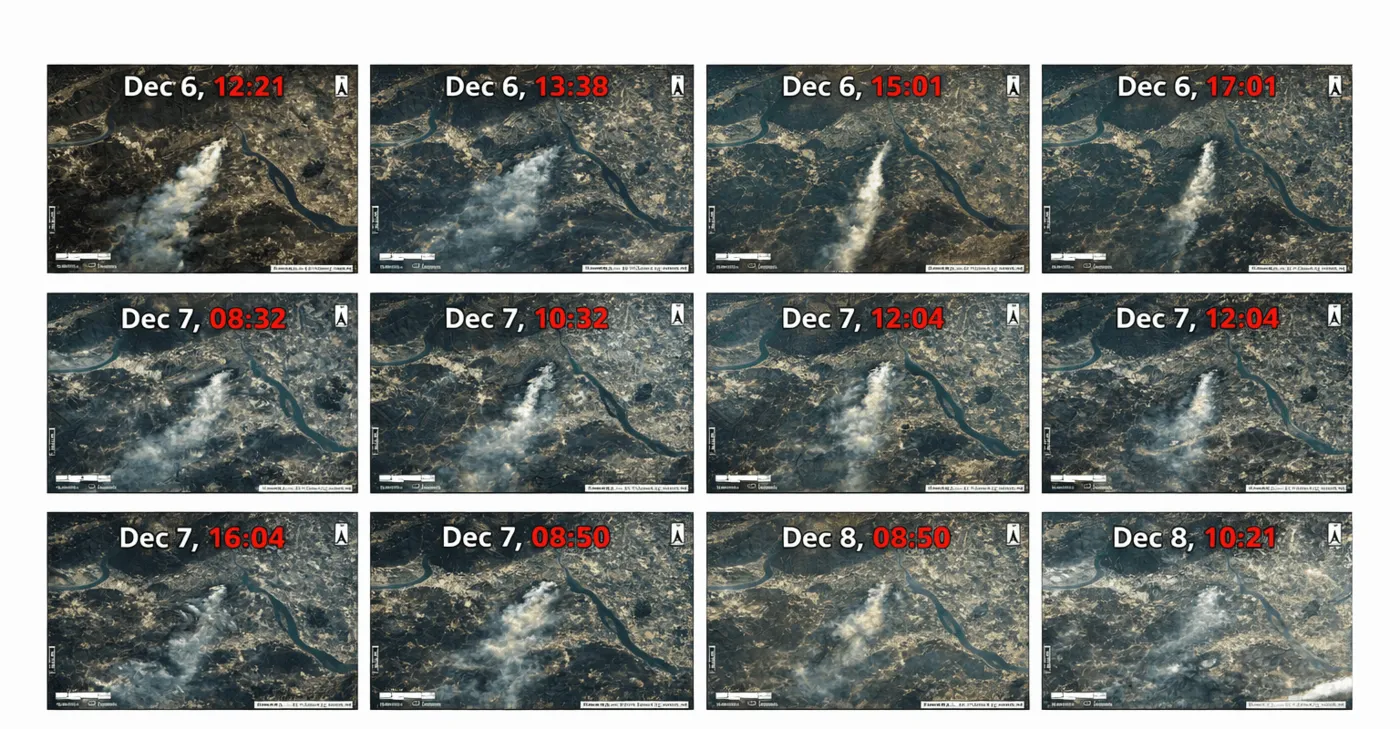
- Daily to near-daily revisit. An agile constellation builds a running baseline, so a new object this week stands out against last week's image automatically.
SAR and InSAR Catch What Optical Can't See
Optical sensors need sunlight and a clear sky. A lot of pipeline corridors don't reliably get either.
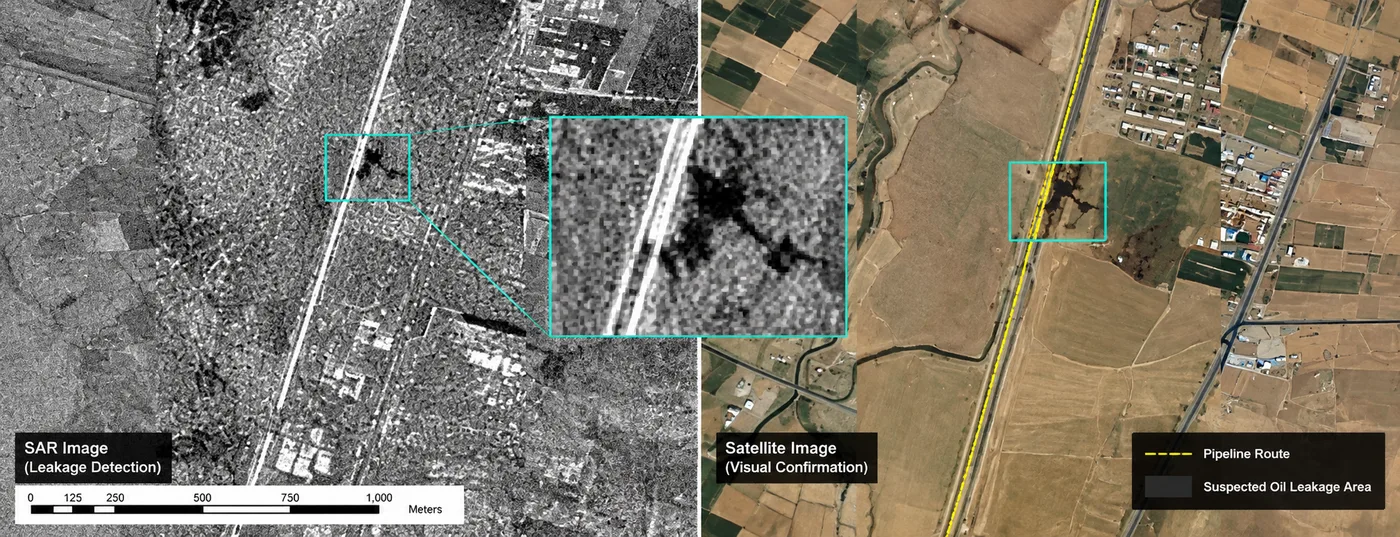
- All-weather, day and night. GF-3 (C-band SAR, resolution down to 1 m in Spotlight mode) and LT-1 (L-band SAR, 3 m resolution) transmit their own signal, so cloud cover, fog, and darkness don't stop a pass.
- InSAR measures ground movement. Interferometric SAR compares the radar phase between repeated passes over the same ground, picking up surface displacement typically down to 1 to 2 mm, and sub-millimeter in favorable conditions.
- Why that matters for pipelines specifically. Tunneling, soil compaction, or unauthorized excavation near a buried line disturbs the ground before any structure appears on the surface. InSAR catches that disturbance first, which is exactly the gap optical imagery alone leaves open.
AI Change Detection Automates the Corridor Audit
A pipeline corridor can run thousands of kilometers. Checking that by eye, image by image, doesn't scale.
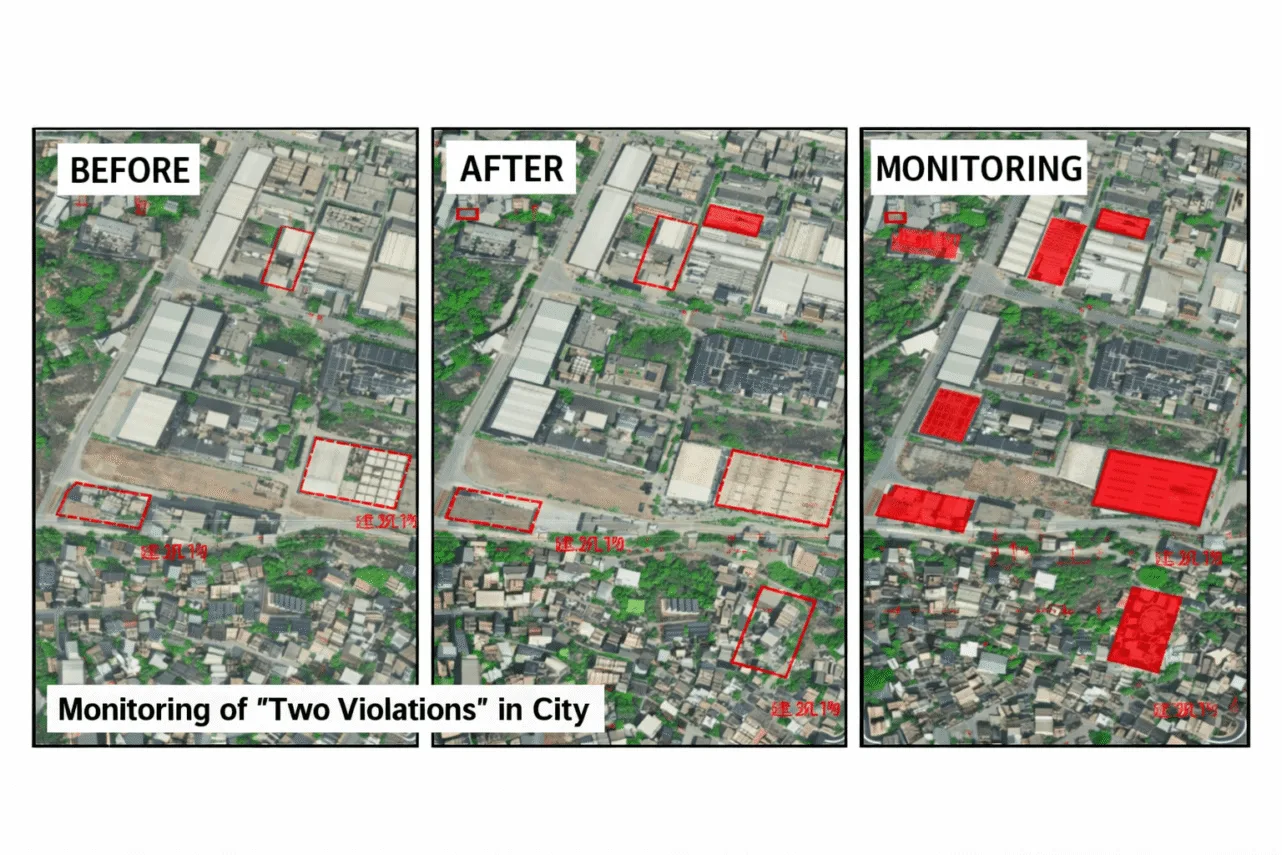
- Semantic segmentation. The AI model labels what's in each scene, building footprints, roads, bare soil, vegetation, automatically rather than requiring a person to trace it.
- Multi-temporal change detection. Every new pass gets compared against the last clean baseline. Anything new or changed inside the right-of-way gets flagged.
- Automated alerts. Instead of a team scanning raw imagery, the system surfaces a short list of specific coordinates where something changed, new construction, disturbed soil, equipment, ready for a human to review and confirm.
DEM and DSM Quantify How Much Earth Actually Moved
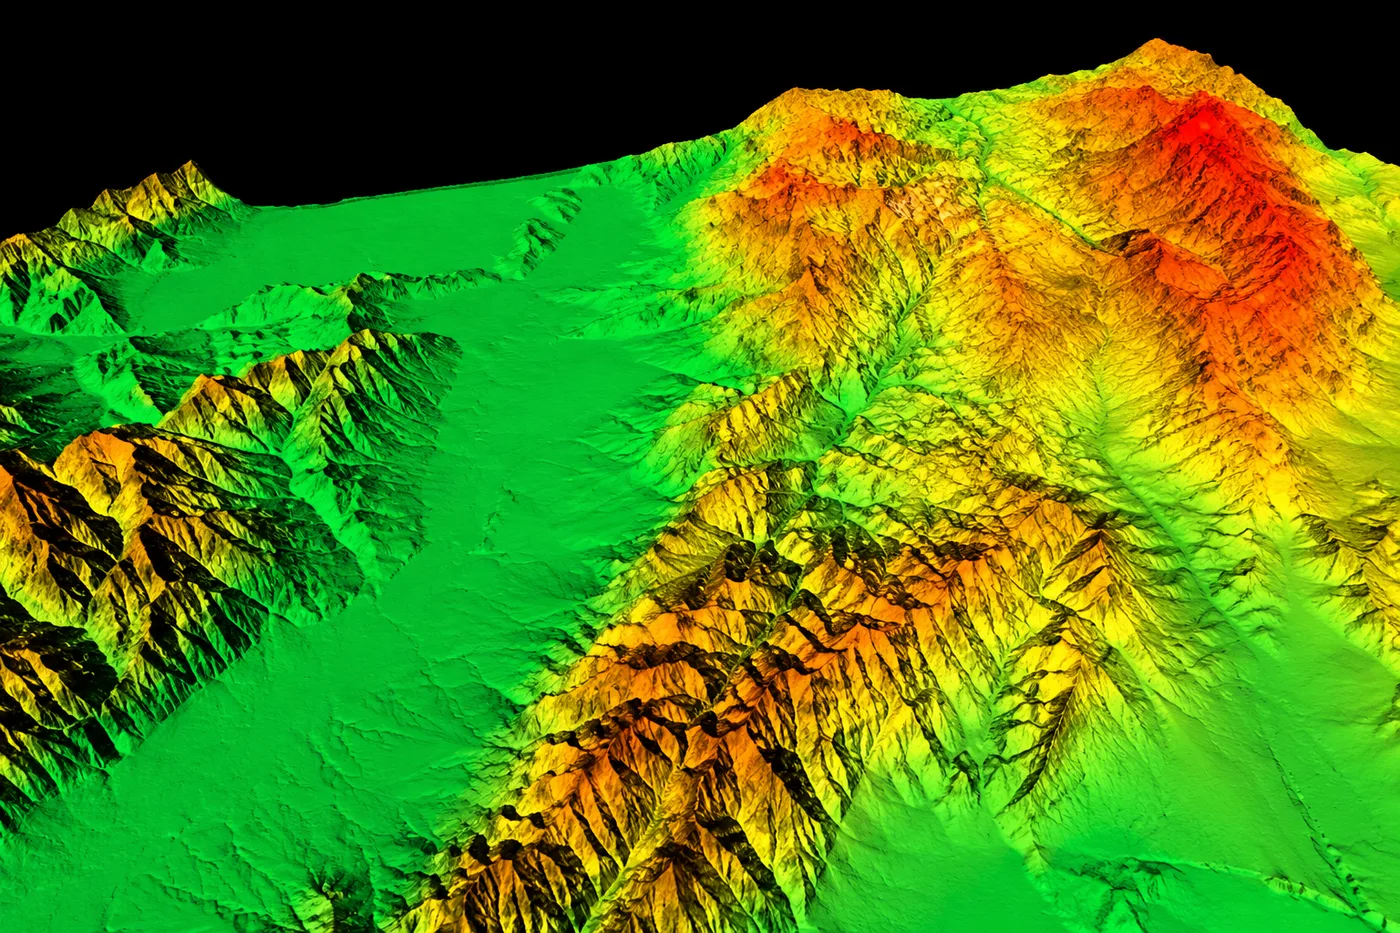
A picture confirms something changed. An elevation model tells you how much ground moved, and whether it's a risk.
- Grid spacing and accuracy. Satellite-derived DEMs and DSMs are typically delivered at 2 to 10 m grid spacing with vertical accuracy around ±3 m RMSE, tighter with stereo satellites like GF-7 carrying an onboard laser altimeter.
- Cut-and-fill volume. Comparing a fresh DEM against the last one quantifies exactly how much soil was added or removed, turning "something changed here" into a measured earthwork volume.
- Slope and stability. The same elevation data flags slope instability near the corridor, a separate risk from encroachment but one the same DEM pass already covers.
Putting the Four Layers Together
| Layer | Confirms | Misses on its own |
|---|---|---|
| VHR optical | What's physically there, equipment, structures, tracks | Blocked by cloud, fog, night |
| SAR / InSAR | Ground movement and activity in any weather, any time of day | Coarser visual detail than optical |
| AI change detection | Where to look, across a whole corridor, without manual review | Still needs a human to confirm a flagged alert |
| DEM / DSM | How much earth moved, slope and stability risk | Doesn't identify what caused the change |
No single layer catches everything alone, which is why operators run all four on the same corridor rather than picking one. For leak detection, methane monitoring, and emergency response once an incident is confirmed, see our fuller guide to satellite-based pipeline monitoring.
Satellite Patrols Are Now PHMSA-Recognized
This used to sit in a gray area. It doesn't anymore.
- A direct final rule took effect October 9, 2025. PHMSA amended 49 CFR 192.705(c) and 195.412(a), the federal patrol requirements for gas and hazardous liquid pipelines, to explicitly list "imaging via satellite, or other means suitable for observing current surface conditions" as an accepted inspection method, alongside traditional aerial and ground patrols.
- One standard applies. The rule doesn't set a separate bar for satellite data, it has to deliver "current information and imaging quality comparable to traditional aerial patrols," the same comparability test any patrol method has to meet.
- What this changes in practice. An operator can now count a satellite pass toward a required right-of-way patrol interval, not just use it as a supplemental check layered on top of a helicopter or ground patrol.
How XRTech Monitors Pipeline Corridors
- One request, four data types. Task VHR optical, SAR, and stereo DEM capture over the same corridor through XRTech's own platform, instead of ordering from separate providers.
- Fast turnaround. Typical tasking requests reach XRTech's global satellite network within about 3 hours, with cloud-processed data delivered roughly 1 to 1.5 hours after capture.
- AI-ready delivery. Imagery arrives as analysis-ready, orthorectified GeoTIFFs, SHP, or DWG layers, ready to feed straight into a change-detection or GIS pipeline rather than needing separate preprocessing.
- Built for repeat monitoring. A corridor can be set up for a repeating tasking schedule, so each new pass compares automatically against the established baseline.
Set up standing watch over your pipeline corridor
See our oil and gas satellite monitoring services for coverage, turnaround, and pricing, or search existing archive over your route first.
Key takeaways
- Sub-meter optical satellites (0.25 to 0.65 m, SuperView Neo-1, SuperView-2, SuperView-1, GF-7) spot new equipment, foundations, and vehicle tracks directly.
- SAR satellites like GF-3 and LT-1 keep watching through cloud, smoke, and darkness. InSAR catches ground movement from excavation or tunneling down to 1 to 2 mm, often before anything is visible on the surface.
- AI-based semantic segmentation and multi-temporal change detection automate the search across a whole corridor, flagging specific locations for human review instead of requiring a manual scan.
- DEM and DSM data, typically 2 to 10 m grid spacing with ±3 m vertical RMSE, turns a flagged zone into a measured cut-and-fill volume and flags slope instability.
- No single layer catches everything. Operators run optical, SAR/InSAR, AI change detection, and DEM comparison together on a repeating schedule for full coverage.
- Excavation damage has caused over 875 US pipeline incidents since 2005, 40 fatalities, 166 serious injuries, and about $322 million in property damage, per PHMSA, with excavator error the single largest root cause in 2025.
- A PHMSA direct final rule effective October 9, 2025 explicitly recognizes satellite imaging as an accepted right-of-way patrol method under 49 CFR 192.705(c) and 195.412(a), on par with traditional aerial patrols.
Frequently asked questions
What satellite technology detects unauthorized construction near a pipeline?
A combination of four layers works best, sub-meter optical satellites (0.25 to 0.65 m) to identify equipment and structures directly, SAR satellites for all-weather day-and-night coverage, InSAR to catch ground movement from excavation before it's visible, and AI change detection to flag new activity across a whole corridor automatically.
Can satellites detect underground excavation near a buried pipeline?
Yes, through InSAR. Interferometric SAR compares the phase of repeated radar passes over the same ground and measures surface displacement down to 1 to 2 mm. Excavation, tunneling, and soil compaction disturb the ground enough to register before any structure becomes visible on the surface.
How often should a pipeline corridor be checked by satellite?
Daily to near-daily optical revisit, using an agile constellation, catches new activity quickly. SAR and InSAR passes typically run on a less frequent repeating schedule since ground deformation builds up over days to weeks rather than hours.
Why use AI change detection instead of just reviewing the images?
A pipeline corridor can run thousands of kilometers, far more than a team can review image by image on a repeating schedule. AI-based semantic segmentation and multi-temporal change detection automatically flag the specific locations where something changed, cutting the review down to a short, targeted list.
What resolution satellite imagery is needed to confirm encroachment?
Sub-meter resolution, roughly 0.25 to 0.65 m, is needed to confirm what's actually there, individual vehicles, foundations, or fence lines. Coarser imagery can flag that something changed but usually can't confirm what it is without a closer look.
Can satellite data measure how much earthwork happened in a construction zone?
Yes. Comparing a fresh Digital Elevation Model against an earlier one quantifies the cut-and-fill volume, how much soil was added or removed, turning a visual flag into a measured number. Satellite DEMs are typically delivered at 2 to 10 m grid spacing with about ±3 m vertical accuracy.
Is satellite monitoring compliant with PHMSA regulations for pipeline right-of-way patrols?
Yes. A PHMSA direct final rule effective October 9, 2025 amended 49 CFR 192.705(c) and 195.412(a) to explicitly list satellite imaging as an accepted inspection method for gas and hazardous liquid pipeline right-of-way patrols, alongside traditional aerial and ground patrols. The imagery has to deliver current information and quality comparable to a traditional aerial patrol, the same standard any patrol method has to meet.
For leak detection, methane monitoring, and emergency response, see our guide to oil and gas pipeline monitoring with remote sensing. For how DEM and DSM data is built and used more broadly, see DEM for flood modeling.
Sources and further reading
- XRTech Group, SuperView Neo-1, SuperView-2, SuperView-1, GF-7, GF-3, and LT-1 product specifications
- eoPortal, GF-3 and LT-1 (Lutan-1) SAR mission profiles, resolution and swath specifications
- Peer-reviewed InSAR research on millimeter-scale ground deformation measurement
- Satellite-derived DEM and DSM accuracy standards, 2 to 10 m grid spacing, ±3 m vertical RMSE
- PHMSA, Advisory Bulletin on Preventing Excavation Damage, Federal Register, April 21, 2026
- PHMSA, direct final rule on remote sensing technologies for right-of-way patrols, 49 CFR 192.705(c) and 195.412(a), effective October 9, 2025
Stop relying on ground patrols alone
Combine optical, SAR, and DEM monitoring over your full pipeline route, tasked and delivered through one platform.