How Satellites Capture, Transmit, and Process an Image
On this page
- 1: A Satellite's Orbit Sets What It Can See and How Often
- 2: Passive Optical Sensors Record Reflected Sunlight
- 3: Active Radar Sensors Send Their Own Signal
- 4: Stereo and Tri-Stereo Passes Add a Third Dimension
- 5: The Satellite Picks an Acquisition Mode Before It Starts Recording
- 6: Downlink Gets the Raw Data to the Ground
- 7: Processing Turns Raw Signal Into a Usable Image
- 01. Atmospheric correction and cloud masking
- 02. Orthorectification
- 03. Pan-sharpening
- 04. Composite creation
- From Capture to the Image You Actually Buy
- Frequently asked questions
- Sources and further reading
A practical guide to how satellite images are taken, covering orbit and sensor choice, how passive optical and active radar sensors each capture a scene, how a stereo pass builds 3D terrain, and how raw signal becomes the downlinked, processed image you actually see.
Quick answer
Satellite images are taken by passive optical sensors, which record sunlight reflected off Earth's surface, or active radar sensors, which transmit their own microwave pulses and measure the return, both flown on spacecraft in Sun-synchronous low Earth orbits roughly 500 to 800 km up or in geostationary orbit near 35,786 km. As the satellite moves along its orbit, the sensor sweeps the ground line by line, digitizes reflectance or radar return into a grid of pixel values, and stores the result onboard until the next pass over a ground station, where the raw data downlinks and runs through atmospheric correction, orthorectification, and pan-sharpening before it becomes the finished image.
1: A Satellite's Orbit Sets What It Can See and How Often
Every satellite image starts with a choice the operator made years before launch, which orbit the spacecraft flies. Most Earth-imaging satellites, including the entire multispectral and SAR fleet covered on this site, fly a Sun-synchronous low Earth orbit, a near-polar path roughly 500 to 800 km above the surface that crosses every point on Earth at the same local solar time on every pass. That fixed lighting angle is what makes images from different dates comparable, and the low altitude is what makes sub-meter resolution possible at all. A much smaller group of satellites instead sit in geostationary orbit, about 35,786 km above the equator, matching Earth's own rotation so the sensor stares at one fixed region continuously rather than sweeping past it once per orbit. GF-4, one of the satellites in XRTech's own fleet, flies this way and can refresh a scene as fast as every 20 seconds, trading spatial resolution for a revisit rate no low-orbit satellite can match.
2: Passive Optical Sensors Record Reflected Sunlight
An optical satellite is a very large, very stable camera. Sunlight bounces off the ground, passes through the sensor's telescope optics, and lands on a detector array that converts incoming photons into an electrical signal. Most spaceborne optical instruments use a pushbroom design, a single line of detectors held in place while the satellite's own orbital motion sweeps that line across the ground, building the finished image strip by strip rather than frame by frame. A panchromatic sensor collects one broad band spanning most of the visible spectrum, which is what pushes spatial resolution to its finest, down to 25 cm native pixels on the sharpest commercial satellites in service today. The same satellite usually carries a second, lower-resolution multispectral detector array alongside the panchromatic one, splitting incoming light into the separate color and infrared bands covered in full in our guide to what multispectral imaging actually captures.
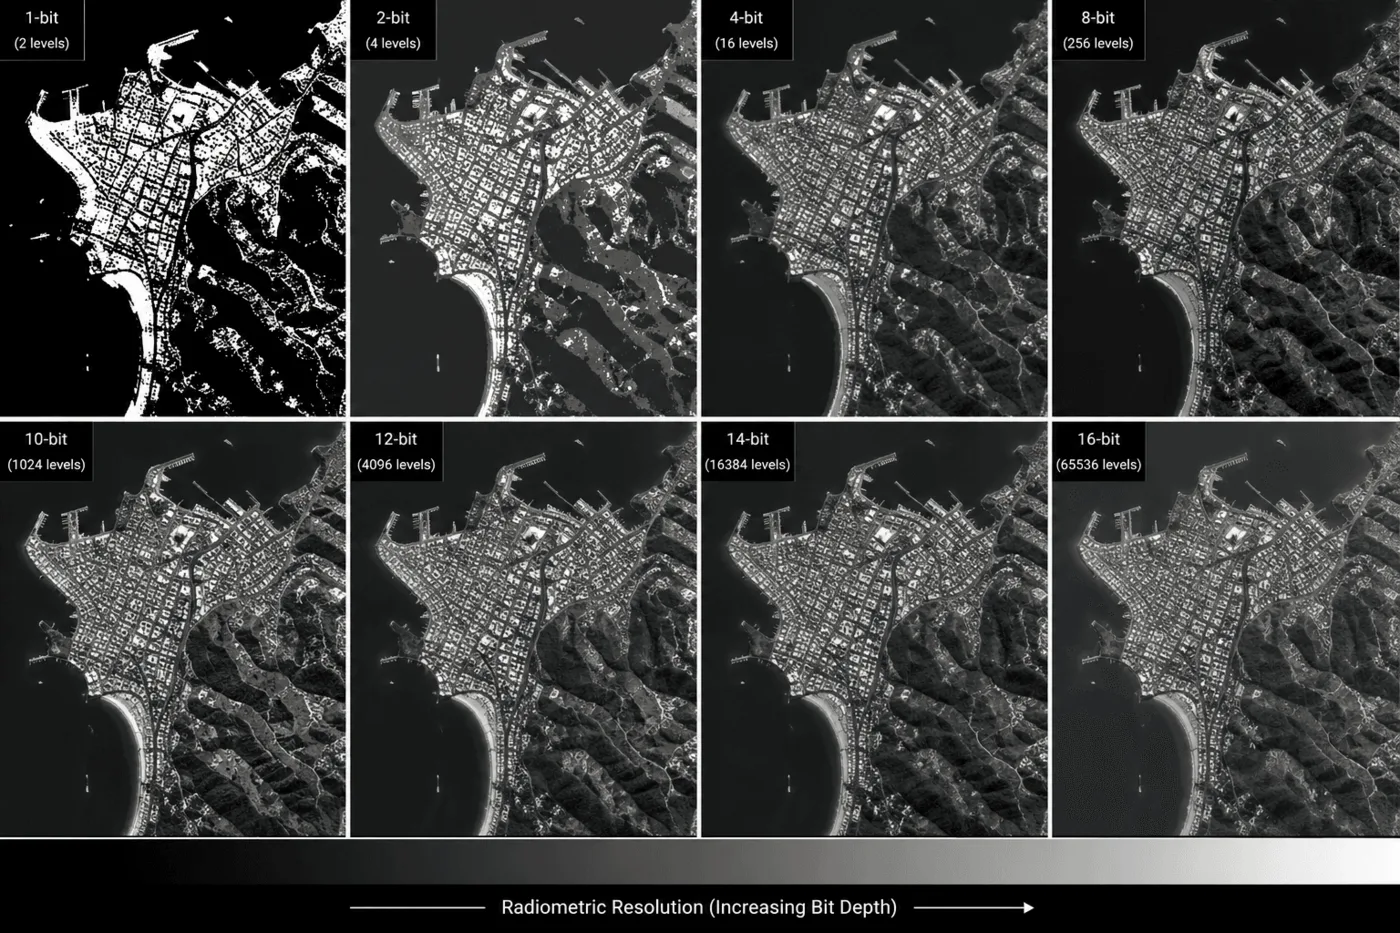
Neither array records a photo in the everyday sense. Each detector digitizes reflectance into a numeric brightness value per pixel, and how many distinct values it can tell apart, a property called radiometric resolution, is set by the sensor's bit depth. An 8-bit sensor sorts brightness into 256 levels; most modern satellites record 10 to 16 bits, 1,024 to 65,536 levels, which is what lets processing later pull detail out of shadows and bright surfaces that an 8-bit image would simply clip to solid black or white.
3: Active Radar Sensors Send Their Own Signal
A radar satellite does not wait for sunlight. Synthetic Aperture Radar, or SAR, transmits its own microwave pulses toward the ground, most commonly in C-band or the longer-wavelength L-band, and records the strength, timing, and phase of whatever bounces back. Because the satellite supplies its own illumination, SAR captures a usable image through thick cloud, smoke, and total darkness, conditions that stop an optical sensor outright. XRTech's own fleet reflects that split, GF-3 flies C-band for fine structural detail down to 1 m, while LT-1 flies L-band, which penetrates deeper into vegetation canopy for an independent soil-moisture and canopy-structure read, each covered with full disaster and infrastructure use cases in our guide to SAR imagery for disaster response mapping.
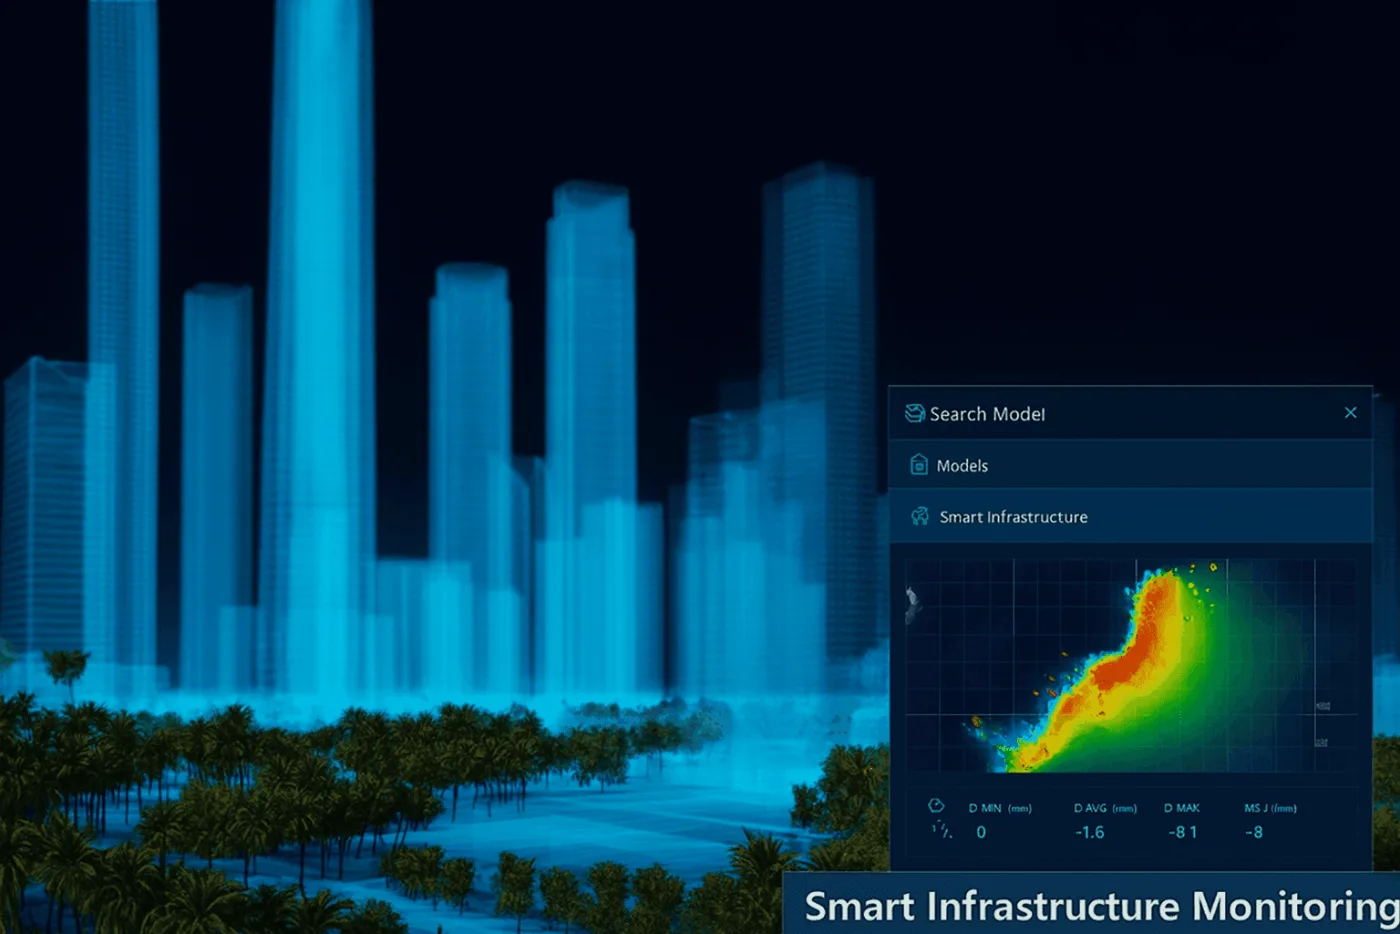
Radar's active signal enables one capability optical imaging has no equivalent for, Interferometric SAR, or InSAR. By comparing the phase of two or more radar passes over the identical ground, InSAR measures how much the surface moved between those passes, down to millimeter and in favorable conditions sub-millimeter precision, which is how a subsiding mine tailings dam or a settling building foundation gets flagged from orbit before it becomes visible on the ground.
4: Stereo and Tri-Stereo Passes Add a Third Dimension
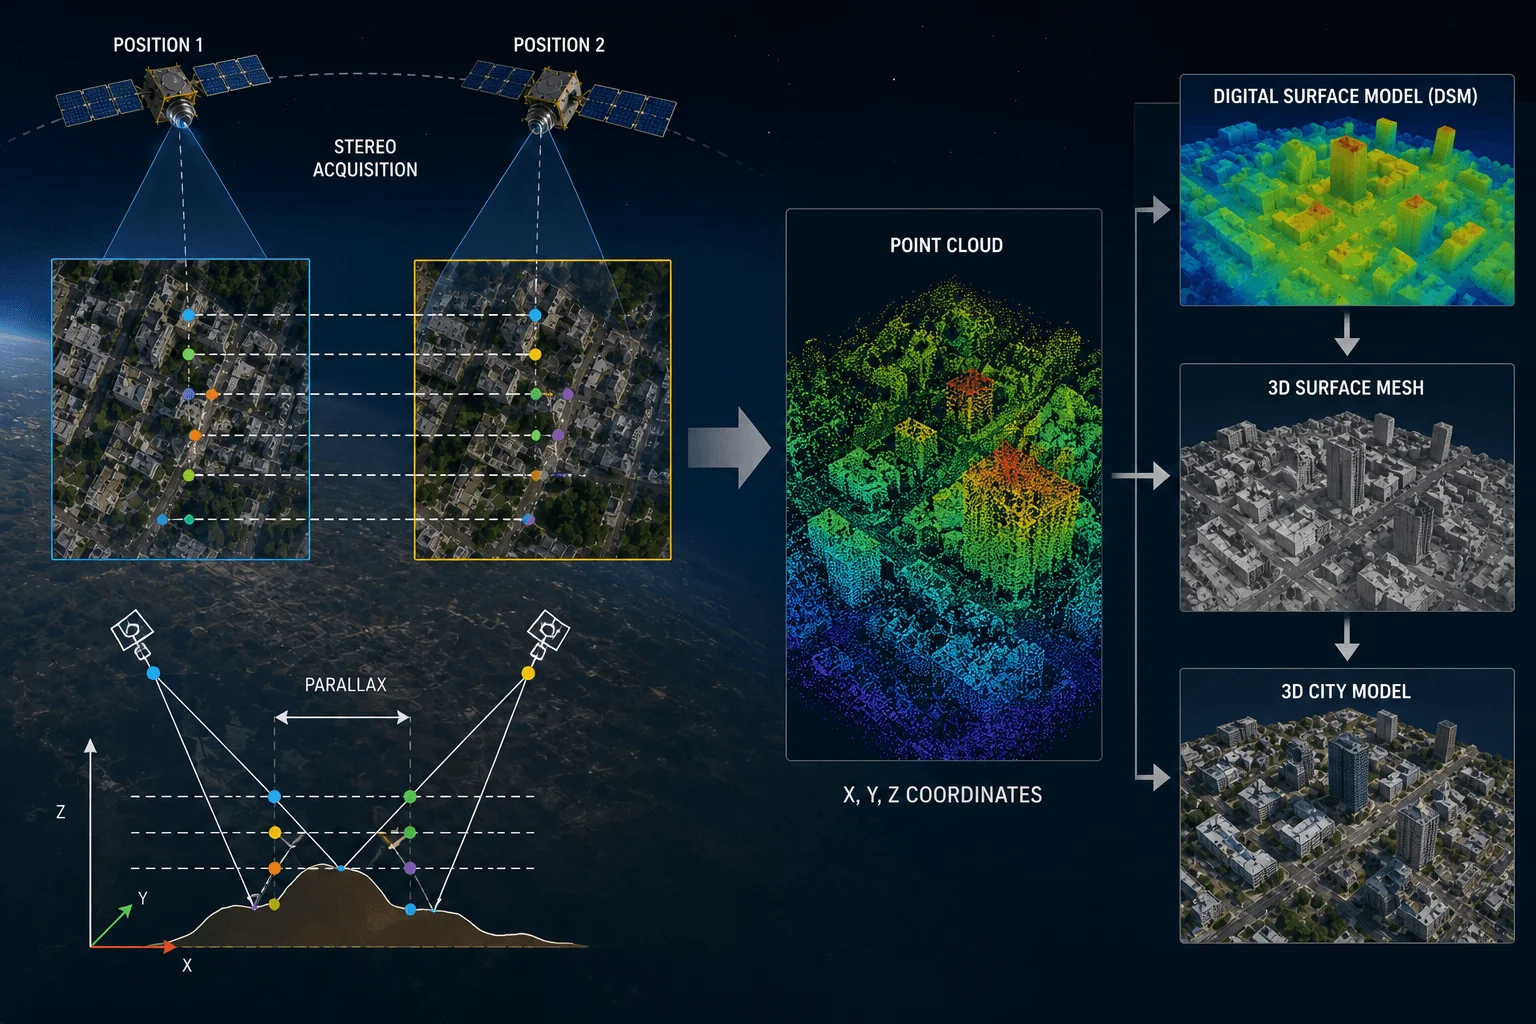
A single optical or radar pass only records a flat image. To recover height, a satellite captures the same ground from two or three distinct viewing angles, either by physically pitching an agile satellite forward and backward across one orbital pass, or by combining two separate overpasses, and pairs matching points between the resulting images. The horizontal shift between where a point lands in each view, called parallax, is directly proportional to that point's elevation, which is enough geometry to reconstruct a dense point cloud and, from it, a Digital Surface Model. XRTech's own stereo-capable satellites, including Beijing-3A and the SuperView-1 constellation, build this into Digital Elevation Models, 3D meshes, and full city models, covered end to end with pricing and workflow in our guide to building 3D models from satellite stereo imagery.
5: The Satellite Picks an Acquisition Mode Before It Starts Recording
Resolution and orbit set what a sensor can capture, but an operator still has to choose how it points for a given request. The table below covers the acquisition modes behind most commercial and government satellite tasking.
| Mode | How it works | Typical use |
|---|---|---|
| Stripmap / long strip | The sensor stays fixed relative to nadir and continuously records along the orbital track | Corridor mapping, pipelines, coastlines, rivers |
| Multiple-strip mapping | Several adjacent strips are captured during one pass and mosaicked together | Wide-area regional coverage in a single tasking request |
| Spotlight | The satellite pivots to keep the sensor pointed at one target throughout the pass, trading swath width for extra dwell time and detail | A single high-value site needing maximum resolution |
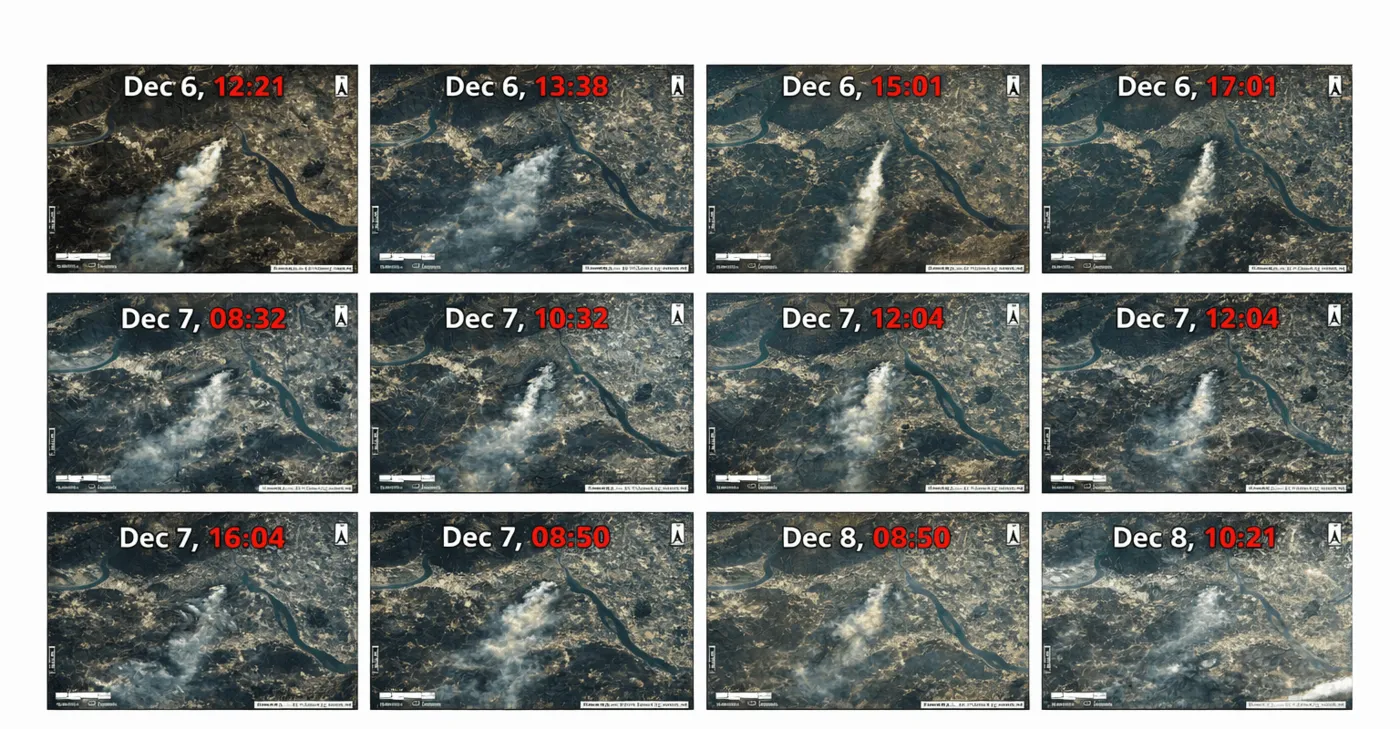
| Geostationary staring | A fixed-orbit sensor repeatedly images the same region without repositioning | Wildfire, storm, and plume tracking at short, repeated intervals |
Need a specific acquisition mode over your own site?
Task a stripmap corridor, a spotlight high-resolution capture, or search existing archive across XRTech's optical, SAR, and stereo fleet. No account needed for a first estimate.
6: Downlink Gets the Raw Data to the Ground
A satellite does not transmit continuously, most of an orbit passes with no ground station in range at all. Instead, captured imagery is written to onboard solid-state storage and held until the satellite's orbital path brings it within line of sight of a receiving antenna, either the operator's own ground station network or a shared commercial network. Once in range, the data streams down over a dedicated high-speed radio link, commonly in the X-band or Ka-band, fast enough to clear a full pass's worth of imagery in the few minutes the satellite remains overhead before it moves on. From there the raw file reaches a processing center, where the steps covered next turn it into a deliverable image.
7: Processing Turns Raw Signal Into a Usable Image
What arrives at a processing center is still raw sensor output, not a finished picture. Four steps, usually run in sequence, turn it into the image a buyer actually receives.
01. Atmospheric correction and cloud masking
Sunlight scatters off haze, aerosols, and water vapor on its way down and back up through the atmosphere, which softens contrast and shifts color if left uncorrected. Processing models and removes that atmospheric contribution, and flags or masks out any cloud and cloud-shadow pixels so they don't get mistaken for ground features.
02. Orthorectification
A raw image carries geometric distortion from terrain relief, the sensor's viewing angle, and Earth's own curvature, so a mountain ridge or tall building doesn't sit where it actually does on a map. Orthorectification uses a Digital Elevation Model to correct that distortion pixel by pixel, aligning the final image to true ground coordinates accurately enough to measure distance and area directly from it.
03. Pan-sharpening
The panchromatic and multispectral detector arrays described earlier each produce a separate image at a different pixel size, sharp and gray, or coarser and in color. Pan-sharpening fuses the two, injecting the panchromatic band's fine spatial detail into the multispectral color data, which is how a satellite with a 2 m native color sensor can still deliver a sharp, full-color image at its panchromatic resolution.
04. Composite creation
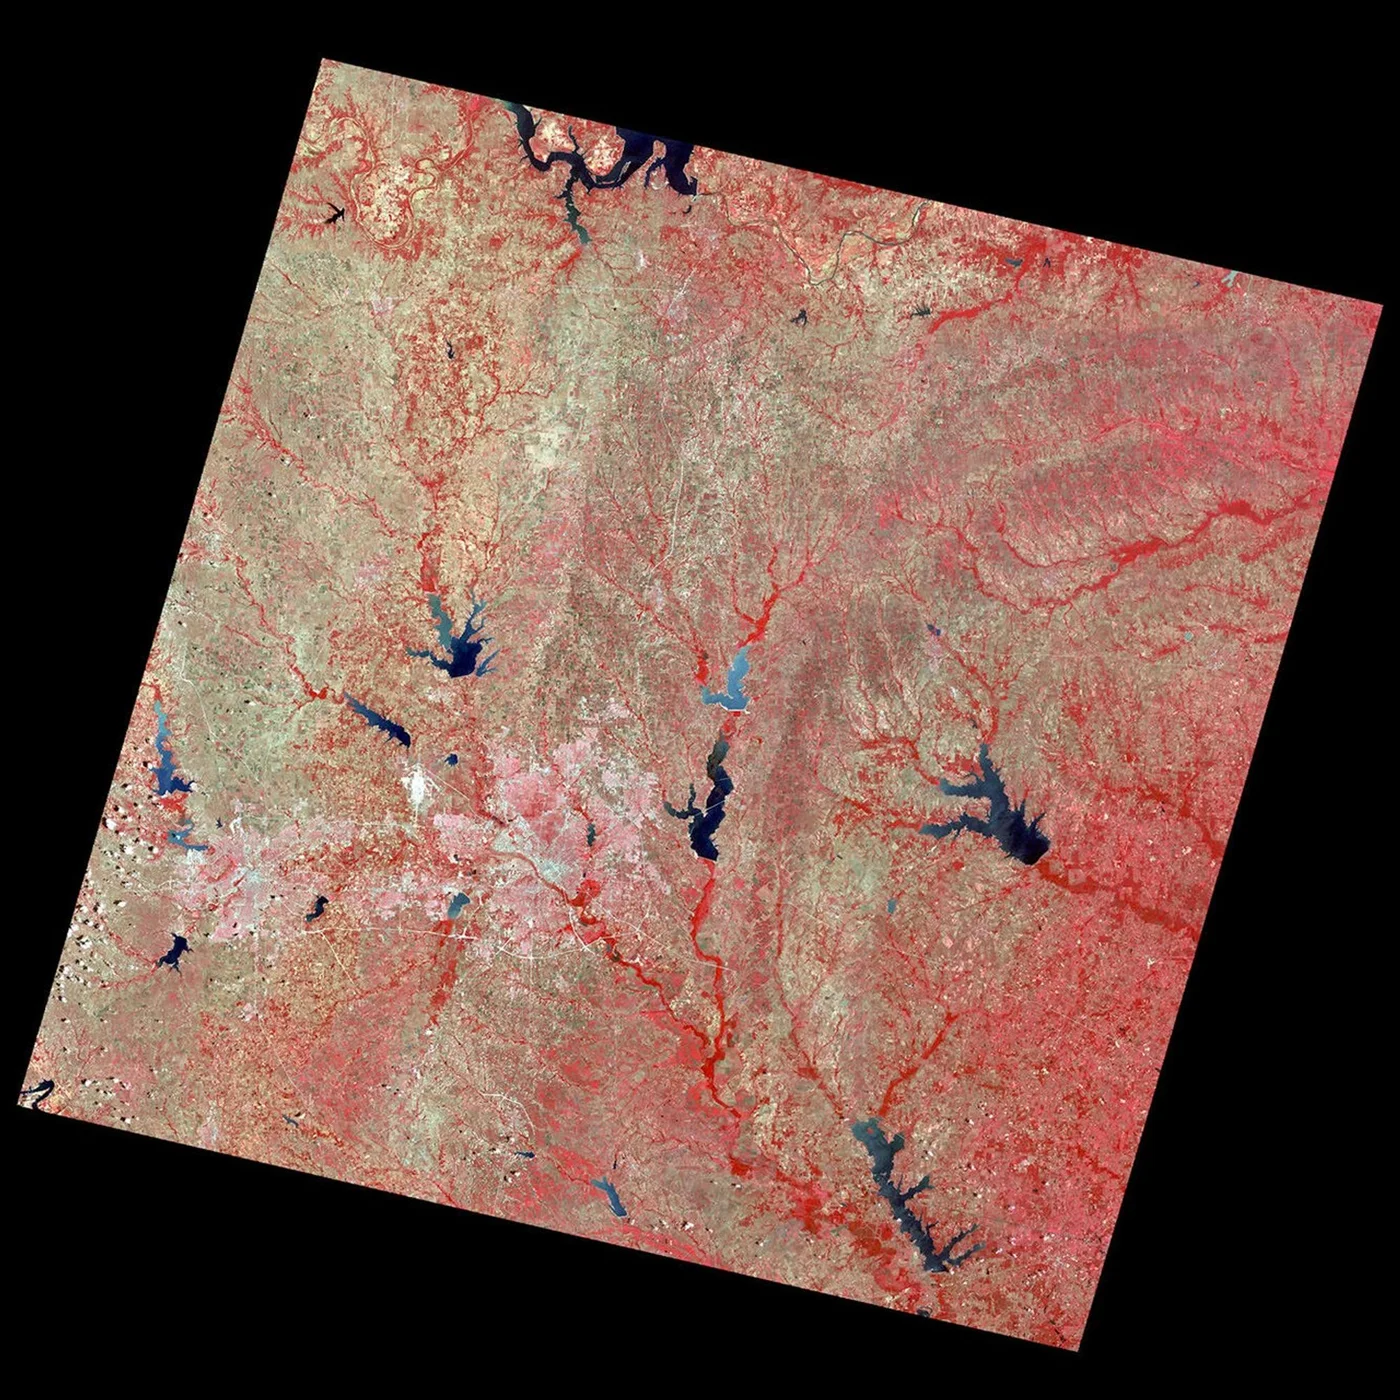
The final step decides which bands map to the red, green, and blue channels a screen can display. Mapping the sensor's own visible Red, Green, and Blue bands straight across produces a true-color image that looks like an ordinary photo. Swapping in a band the eye can't see, typically near-infrared or shortwave infrared, produces a false-color composite instead, the exact technique and what it reveals about vegetation, water, and minerals is covered in full in our guide to multispectral imaging and band combinations.
Satellite image capture by the numbers
Figures drawn from published mission specifications and XRTech's own fleet data, not marketing estimates.
Altitude of geostationary orbit, where a satellite's own motion matches Earth's rotation and the sensor holds one fixed region in view.
Fastest refresh interval for GF-4, XRTech's own geostationary satellite, staring continuously at one region instead of sweeping past it.
Finest native panchromatic pixel size available commercially today, from SuperView Neo-1, before any pan-sharpening is applied.
Ground deformation precision InSAR can reach by comparing radar phase across repeated passes over identical terrain.
From Capture to the Image You Actually Buy
Everything above happens before an order ever gets placed. What's left is choosing which already-built satellite and processing level fit a specific project.
| Fixed by the satellite's own design | Chosen when you place an order |
|---|---|
| Orbit type and altitude | Which satellite or tier best matches your area and deadline |
| Optical versus radar sensor physics | Which sensor fits your cloud risk and target type |
| Native pixel size the sensor can produce | The resolution tier you pay for |
| Whether a usable scene already exists in archive | Archive search versus a new tasking request |
| Raw signal reaching the ground station | The processing level you receive, raw through pan-sharpened and orthorectified |
For the resolution side of that choice, see our guide to choosing the right satellite resolution. For archive versus new capture, see tasking vs archive search, and for the full ordering workflow once both are decided, see how to order satellite images step by step. Free sources covering several of the satellites and bands in this guide are compared in our list of free satellite imagery sources.
Key takeaways
- Satellite images come from passive optical sensors, which record reflected sunlight, or active radar sensors, which transmit their own microwave pulses, flown in Sun-synchronous low Earth orbit around 500 to 800 km or geostationary orbit near 35,786 km.
- A pushbroom detector array digitizes reflectance or radar return into a grid of pixel values, with radiometric resolution, usually 10 to 16 bits, setting how many brightness levels each pixel can separate.
- Stereo and tri-stereo passes capture the same ground from multiple angles to calculate parallax, which builds Digital Elevation Models and full 3D city models.
- An operator picks an acquisition mode, stripmap, multiple-strip, spotlight, or geostationary staring, before recording even starts, based on what the request actually needs.
- Captured data stores onboard until the satellite passes over a ground station, downlinks over a high-speed radio link, and reaches a processing center for atmospheric correction, orthorectification, pan-sharpening, and composite creation.
Frequently asked questions
How are satellite images taken?
Satellite images are taken by passive optical sensors, which record sunlight reflected off Earth's surface, or active radar sensors, which transmit their own microwave pulses and measure the return. Both are flown on satellites in Sun-synchronous low Earth orbit, roughly 500 to 800 km up, or geostationary orbit near 35,786 km, and the sensor digitizes the captured signal into a grid of pixel values that later gets downlinked and processed into a finished image.
What sensors do satellites use to capture images?
Optical satellites use passive pushbroom sensors that record reflected sunlight across panchromatic, multispectral, or hyperspectral bands. Radar satellites use active Synthetic Aperture Radar, or SAR, which transmits its own microwave pulses in C-band or L-band and records what bounces back, independent of sunlight.
Can satellites take pictures through clouds or in the dark?
Optical satellites cannot, they need reflected sunlight and a cloud-free view. SAR satellites can, because they transmit their own microwave signal rather than relying on sunlight, which lets them capture a usable image through thick cloud, smoke, and total darkness.
How does a satellite send images back to Earth?
Captured imagery is stored on the satellite's onboard solid-state memory until its orbit brings it within range of a ground station antenna. The data then downlinks over a high-speed radio connection, commonly X-band or Ka-band, before reaching a processing center on the ground.
Why do raw satellite images look dull or gray before processing?
A sensor records reflectance or radar return as a raw digital value per pixel, not a finished photo. Atmospheric scattering softens contrast further, so processing steps like atmospheric correction, orthorectification, and pan-sharpening are needed to turn that raw data into a sharp, accurately colored, geometrically correct image.
What is pan-sharpening in satellite imagery?
Pan-sharpening fuses a satellite's high-resolution panchromatic band with its lower-resolution multispectral color bands, injecting the panchromatic band's fine spatial detail into the color data. It's how a sensor with a coarser native color resolution still delivers a sharp, full-color final image.
What is orthorectification and why does a satellite image need it?
Orthorectification corrects the geometric distortion a raw satellite image carries from terrain relief, the sensor's viewing angle, and Earth's curvature. It uses a Digital Elevation Model to reposition every pixel to its true ground coordinate, which is what makes an orthorectified image usable for accurate distance and area measurement.
How often does a satellite revisit the same location?
It depends on orbit and constellation size. A single low Earth orbit satellite typically revisits every few days to roughly two weeks, a multi-satellite constellation can reach daily or near-daily revisit, and a geostationary satellite like GF-4 can refresh the same fixed region as fast as every 20 seconds.
How is a 3D model built from satellite images?
A satellite captures the same ground from two or three different viewing angles in a stereo or tri-stereo pass. Matching points between those images produce parallax, a measurable shift proportional to elevation, which builds a point cloud and, from it, a Digital Elevation Model, a 3D mesh, and a full city model.
For the sensor science behind composite creation and band math, see our guide to what multispectral imaging actually captures. To match a resolution tier to your own project once the capture process is clear, see choosing the right satellite resolution.
Sources and further reading
- USGS: Landsat program orbital altitude and Sun-synchronous orbit specifications
- NOAA / NASA GOES-R Series: ABI scan mode documentation and mesoscale sector refresh intervals
- ESA Copernicus: Sentinel-1 and Sentinel-2 orbit, sensor, and revisit specifications
- eoPortal: GF-3, GF-4, and LT-1 (Lutan-1) SAR and geostationary mission specifications
- Peer-reviewed InSAR research on millimeter-scale ground deformation measurement precision
- China Siwei and XRTech Group: satellite and sensor specifications across the optical, SAR, and stereo fleet
Ready to search or task real satellite imagery?
Search free and commercial optical, SAR, and stereo archive over your area of interest, or request tasking for a specific acquisition date and mode. Get a first estimate in minutes, no account required.