What Is Multispectral Imaging?
On this page
- What Is Multispectral Imaging?
- Seeing Beyond Natural Color
- How Multispectral Sensors Capture Data
- Common Multispectral Bands Explained
- Red Edge in practice
- Yellow band in practice
- Dual near-infrared channels
- Why Different Materials Respond Differently in Multispectral Data
- 01. Vegetation
- 02. Water
- 03. Soil and minerals
- 04. Urban and built surfaces
- Common Band Combinations and Vegetation Indices
- NDVI, Normalized Difference Vegetation Index
- GNDVI, Green NDVI
- EVI, Enhanced Vegetation Index
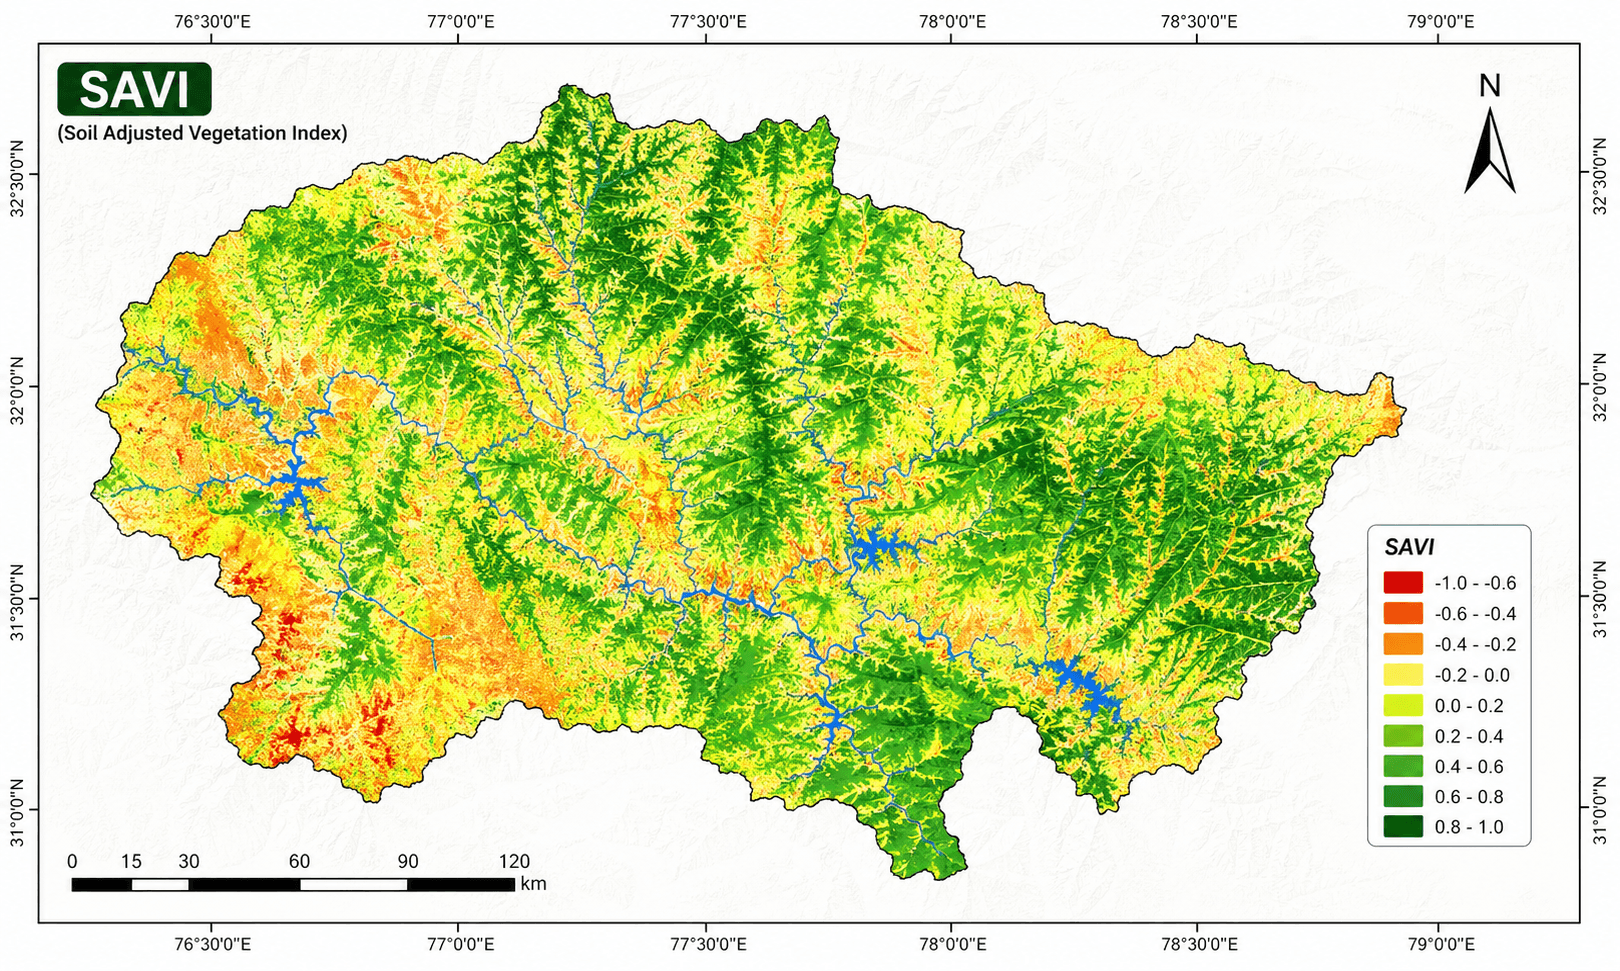
- SAVI, Soil-Adjusted Vegetation Index
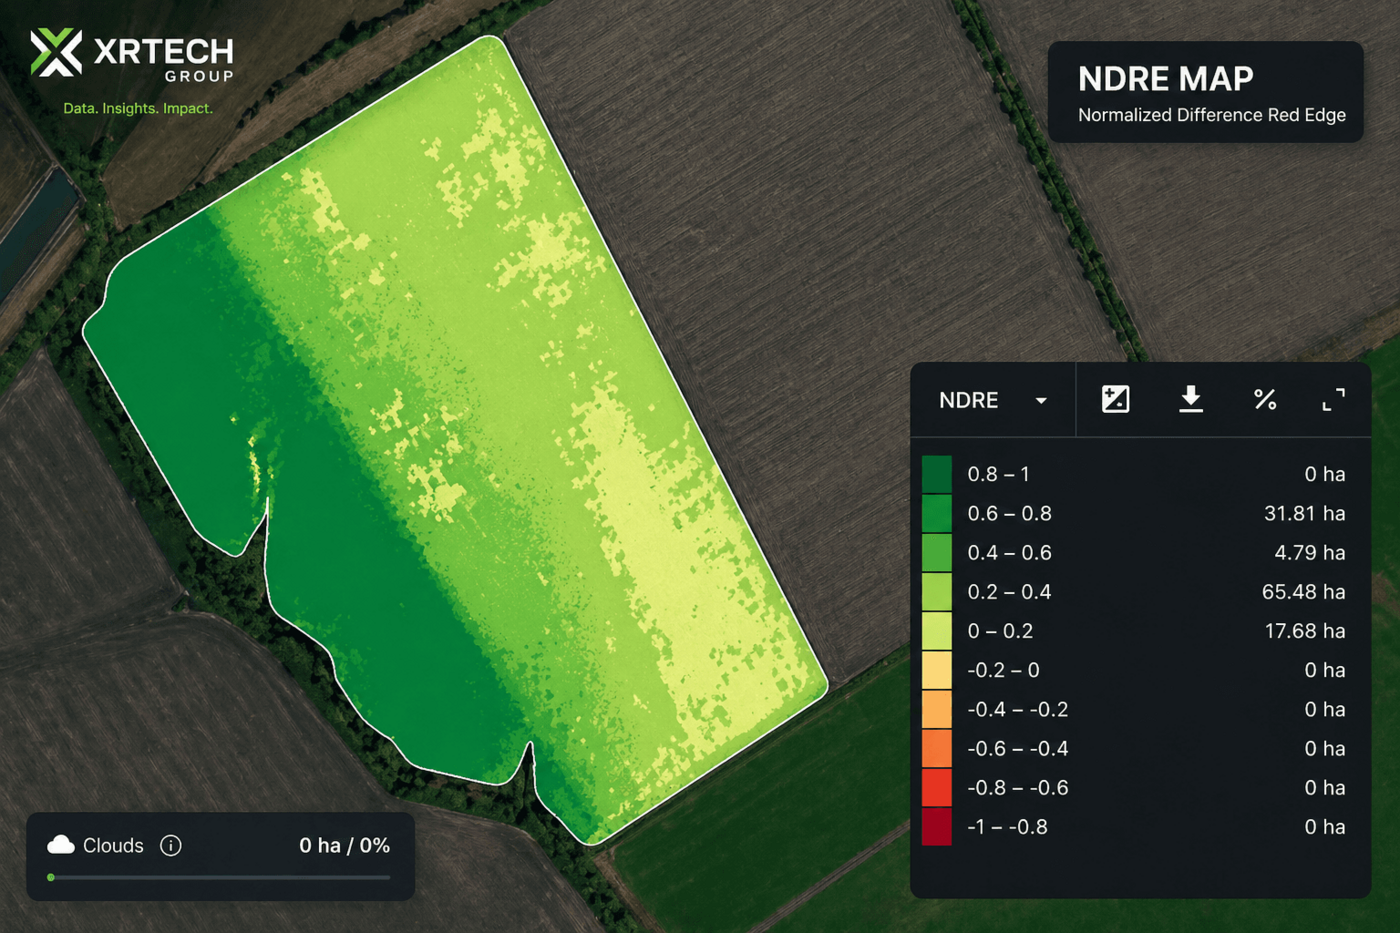
- NDRE, Normalized Difference Red Edge
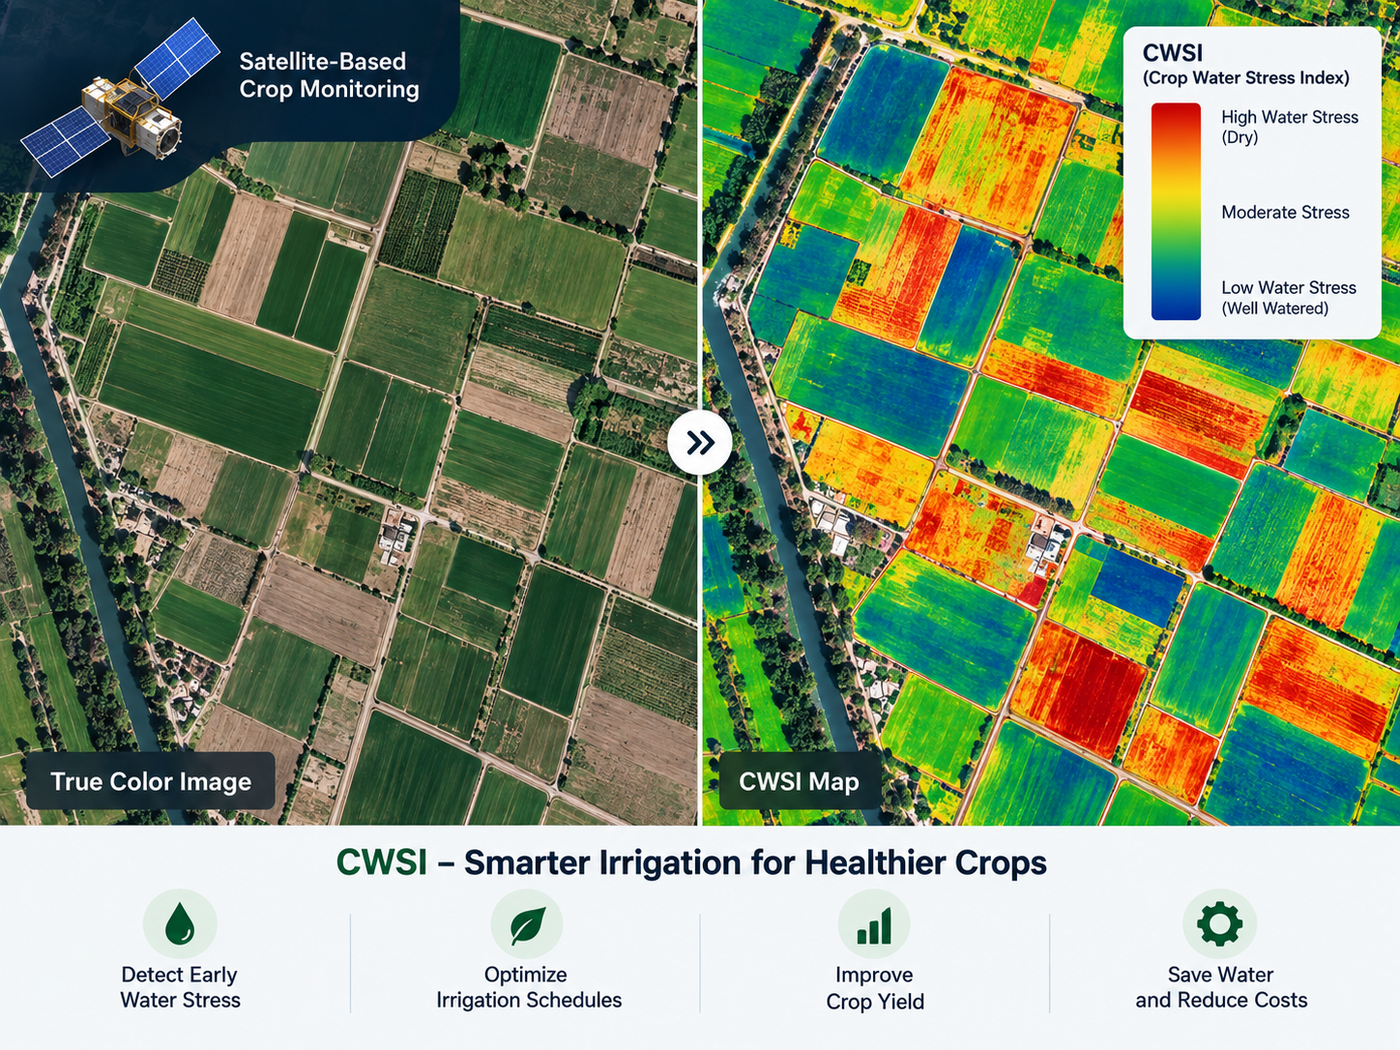
- CWSI, Crop Water Stress Index
- Multispectral vs. Hyperspectral Imaging
- Applications of Multispectral Imagery
- 01. Precision agriculture and crop monitoring
- 02. Environmental and water quality monitoring
- 03. Mining and geological exploration
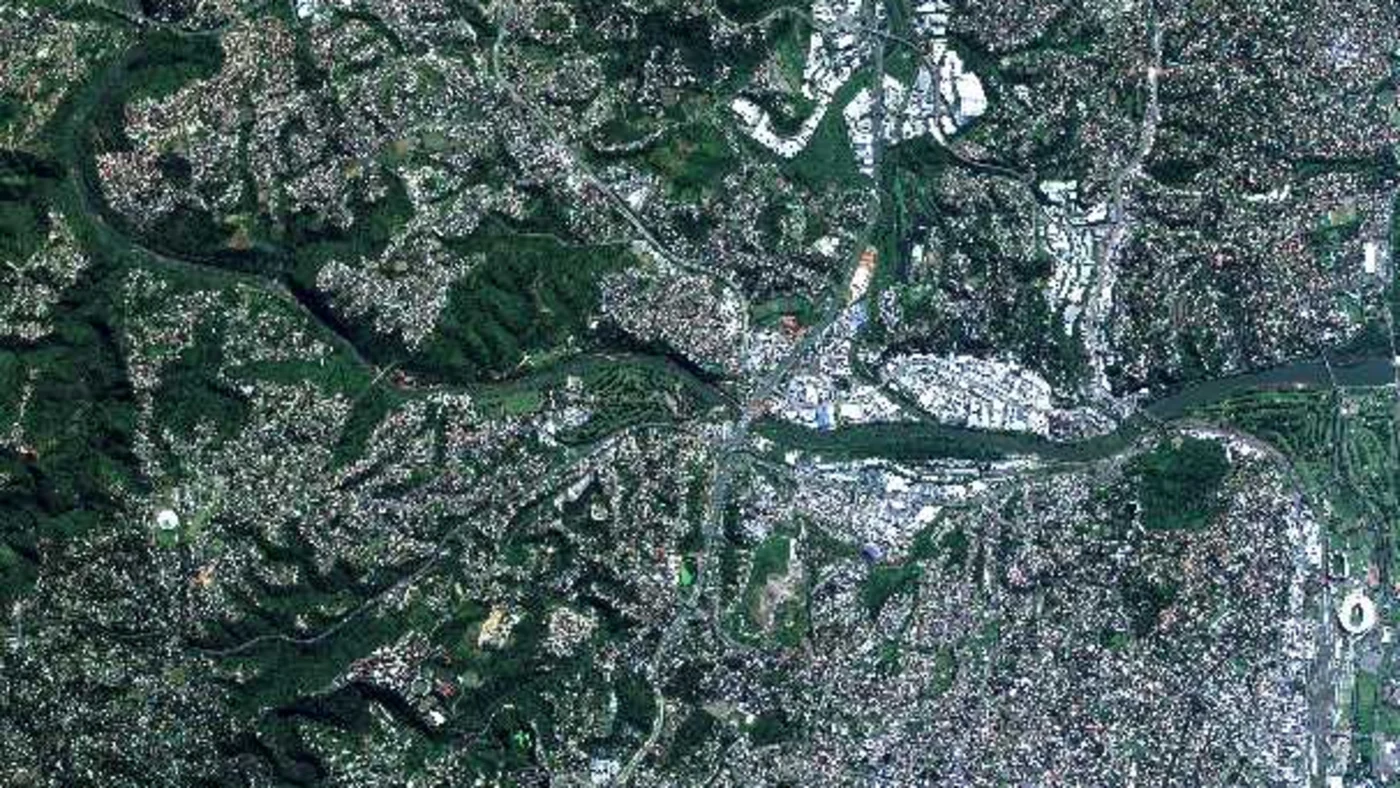
- 04. Urban planning and infrastructure
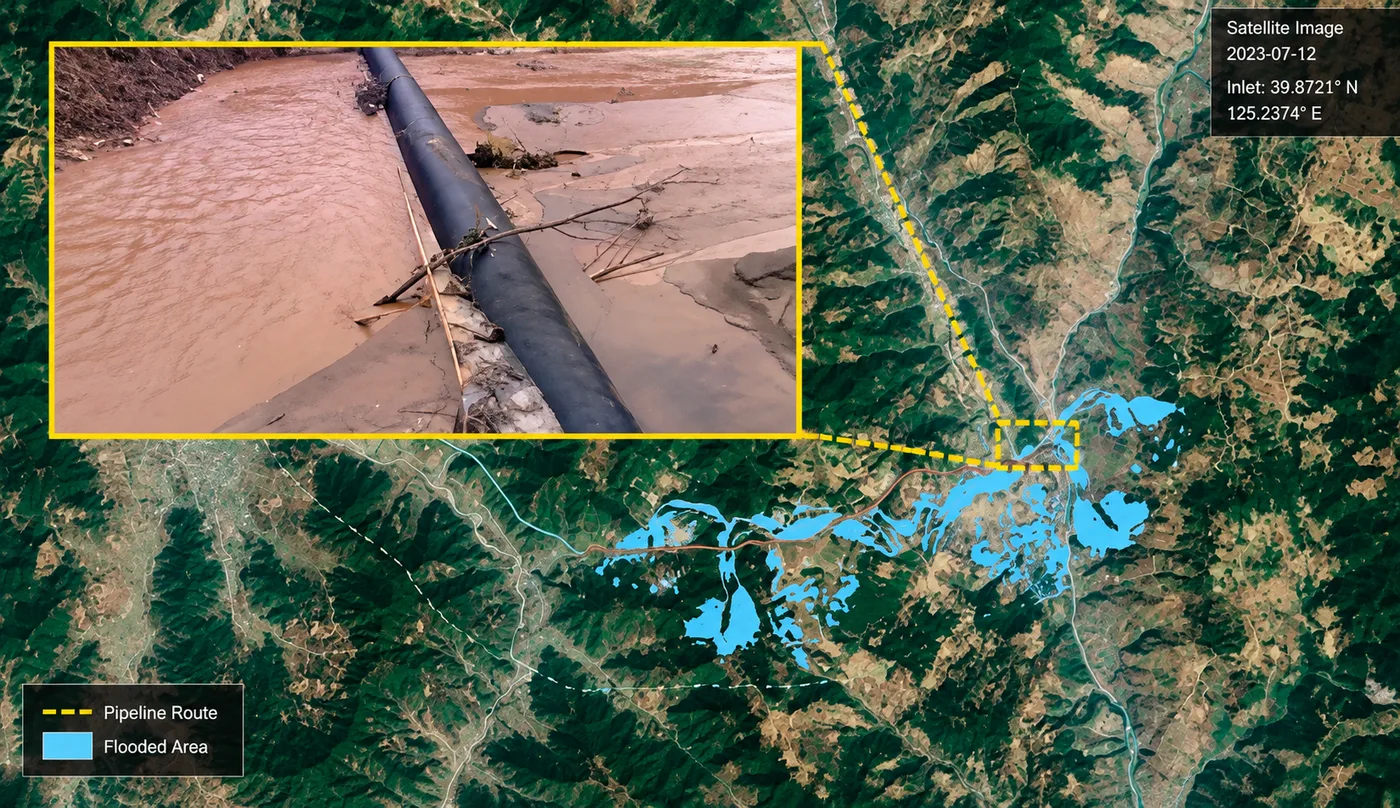
- 05. Emergency and disaster response
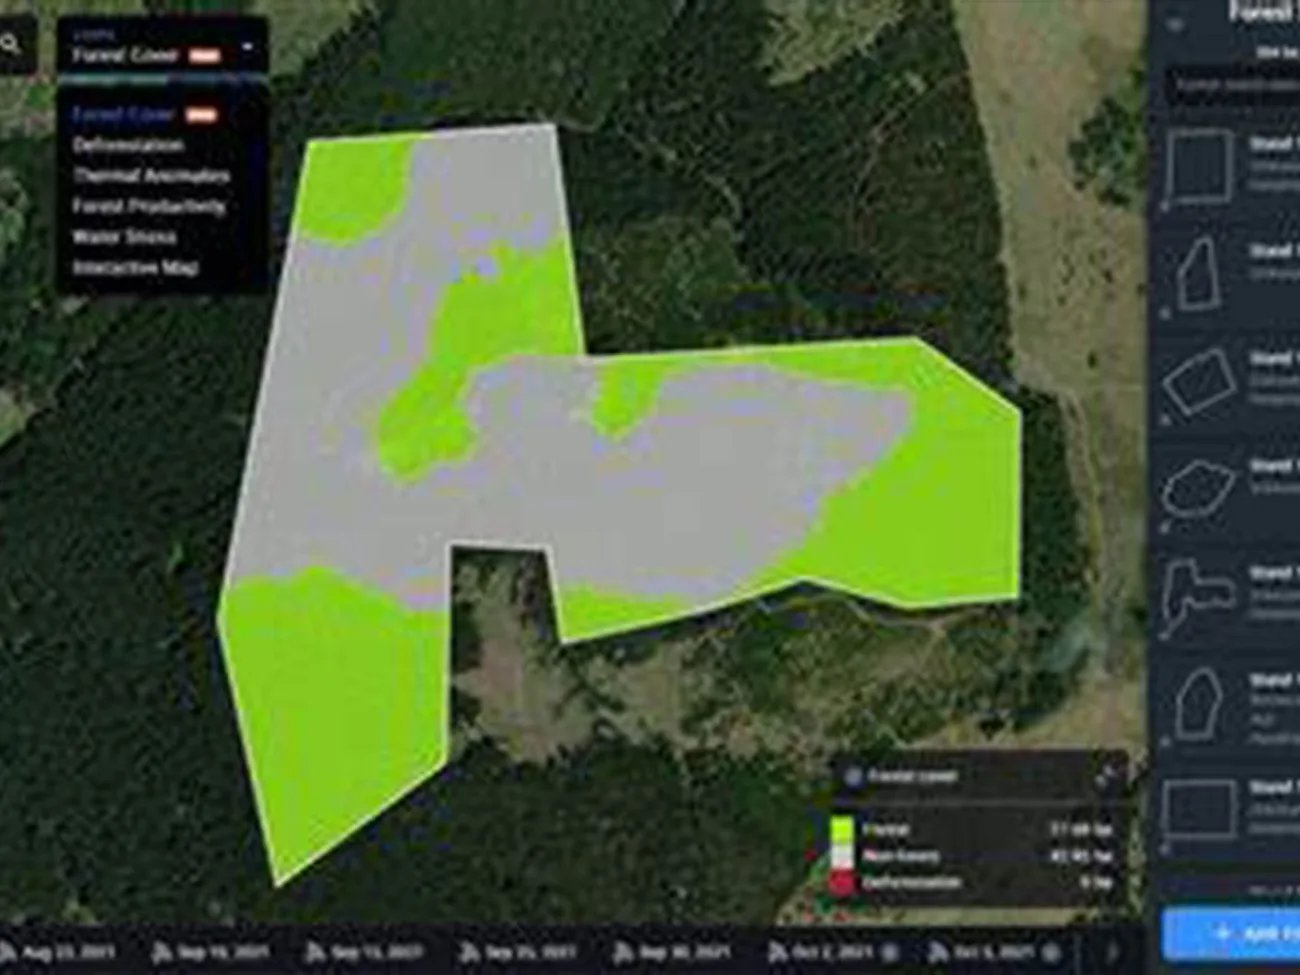
- 06. Forestry and land cover monitoring
- Satellites and Sensors That Capture Multispectral Imagery
- Ultra-high and very-high resolution multispectral, under 1 m
- High and moderate resolution, wide-swath multispectral, 2 to 16 m
- Geostationary, thermal, and infrared multispectral, 20 to 50 m
- Free and open-access multispectral
- Where Multispectral Imagery Fits in Earth Observation
- Frequently asked questions
- Sources and further reading
Multispectral imaging captures satellite and aerial data across several distinct wavelength bands, far beyond the red, green, and blue of an ordinary photo. It's the foundation most operational Earth observation runs on, from crop stress detection to mineral exploration to flood mapping.
Quick answer
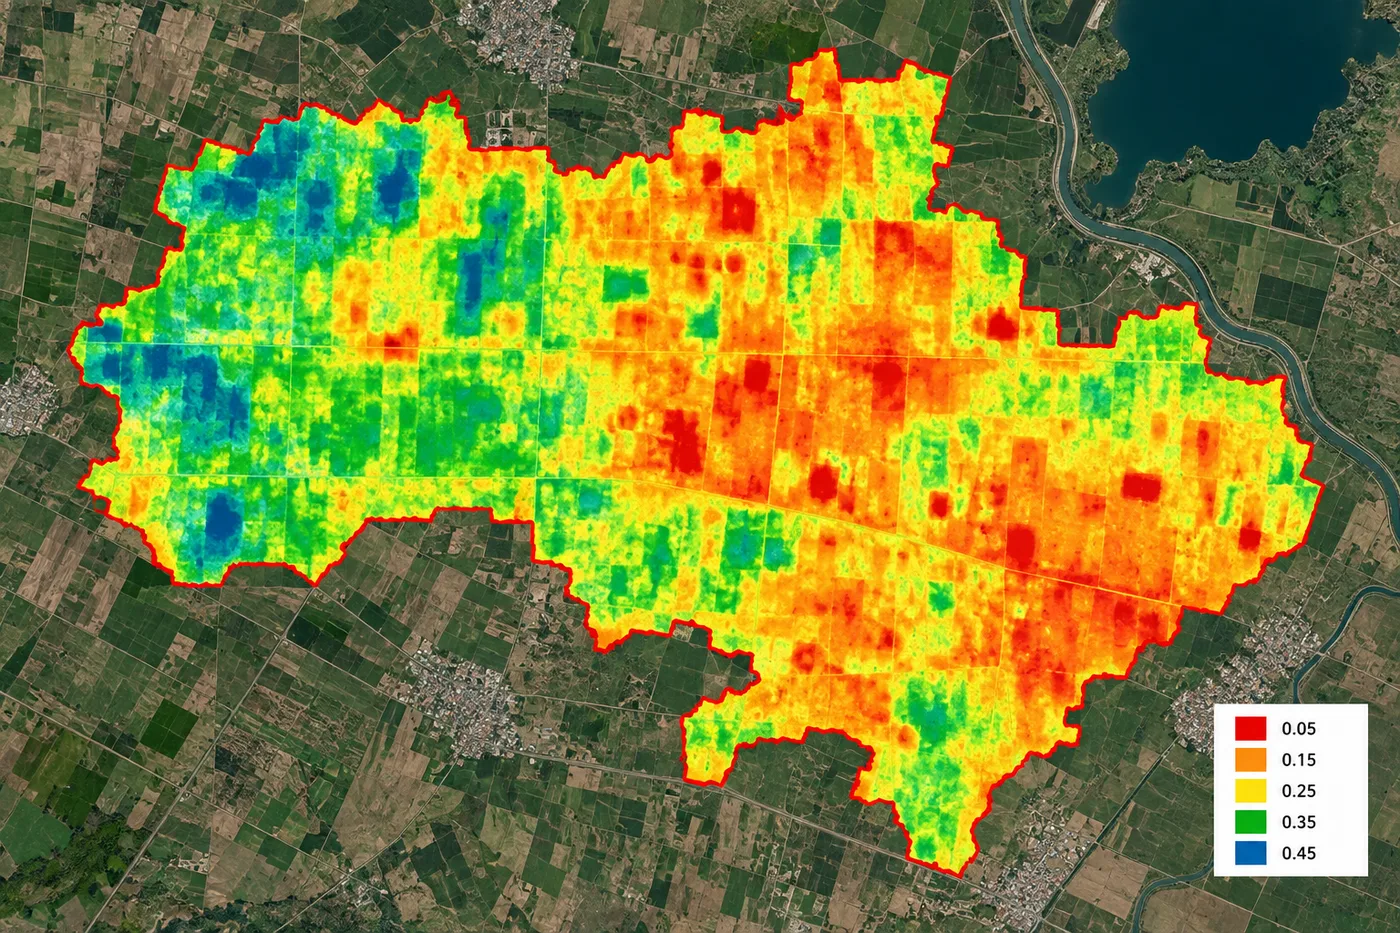
Multispectral imaging is a remote sensing technique that captures reflected light across several discrete wavelength bands, typically 4 to 16, spanning the visible spectrum plus near-infrared (NIR) and shortwave infrared (SWIR). Unlike an ordinary red-green-blue photo, each band reveals how a surface, whether vegetation, water, soil, minerals, or a built structure, absorbs and reflects light differently, which is the basis for indices like NDVI and for satellite-based monitoring in agriculture, mining, water management, and urban planning.
What Is Multispectral Imaging?
Multispectral imaging (MSI) is the practice of capturing image data in a small number of separate, well-defined wavelength bands rather than one blended visible-light exposure. A normal camera, or an RGB satellite image, only samples the red, green, and blue wavelengths the human retina happens to respond to. Multispectral sensors add wavelengths the eye cannot see at all, most importantly near-infrared and shortwave infrared, because those two ranges carry an outsized amount of information about plant health, moisture content, and mineral composition, the specific mechanics of which are covered section by section below.
Seeing Beyond Natural Color
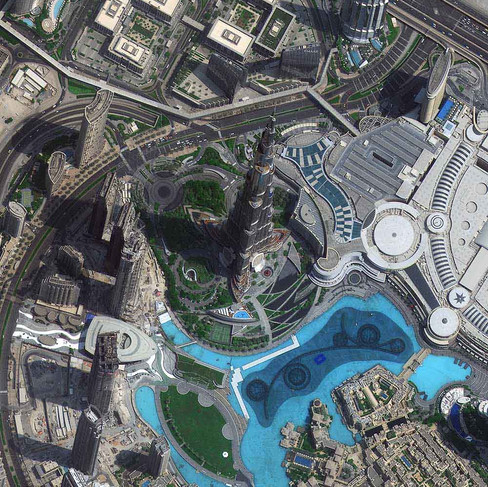
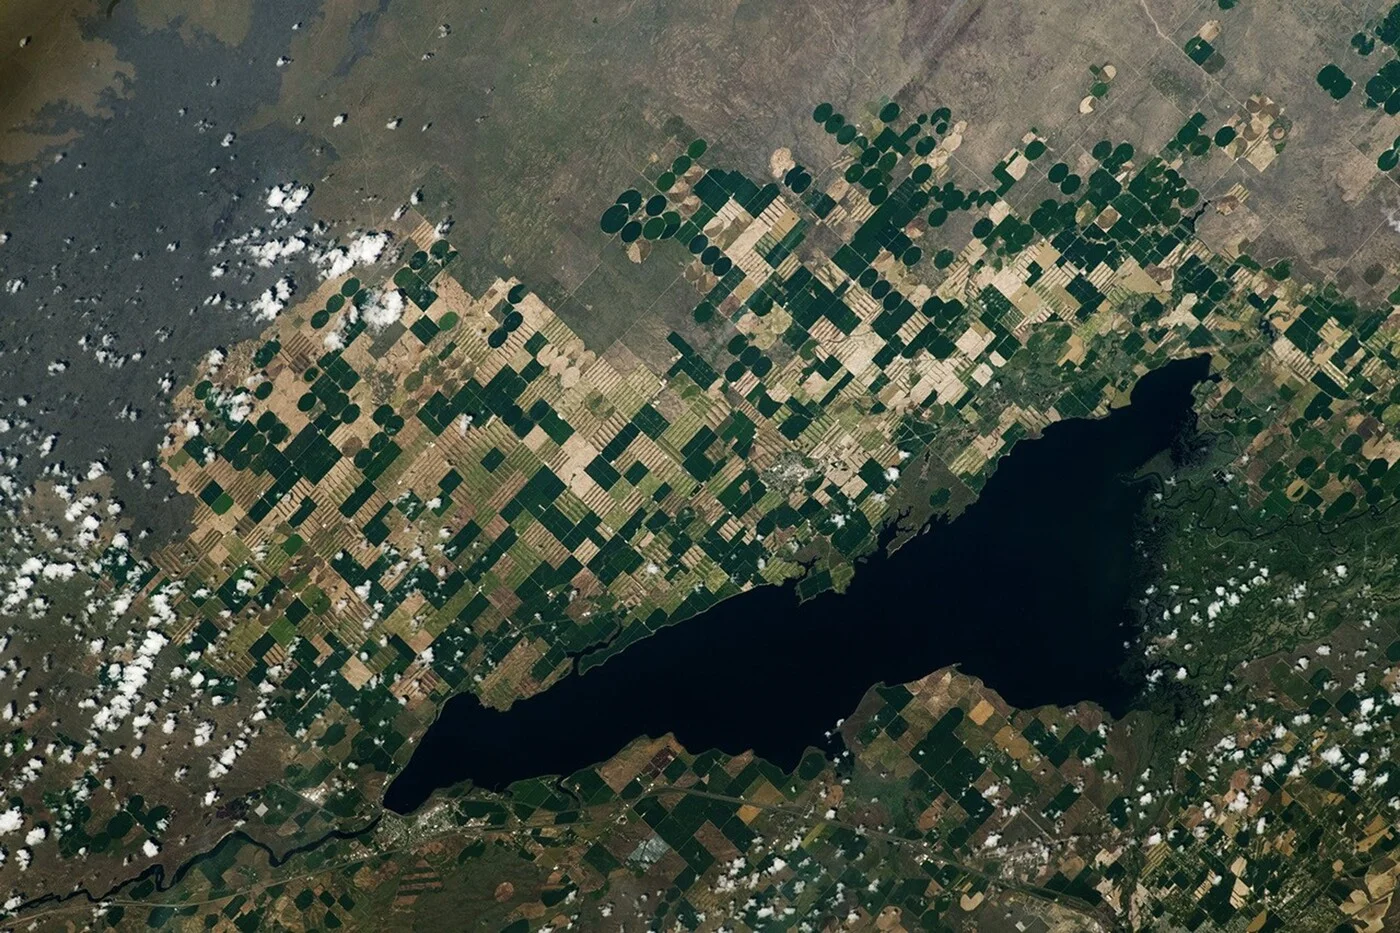
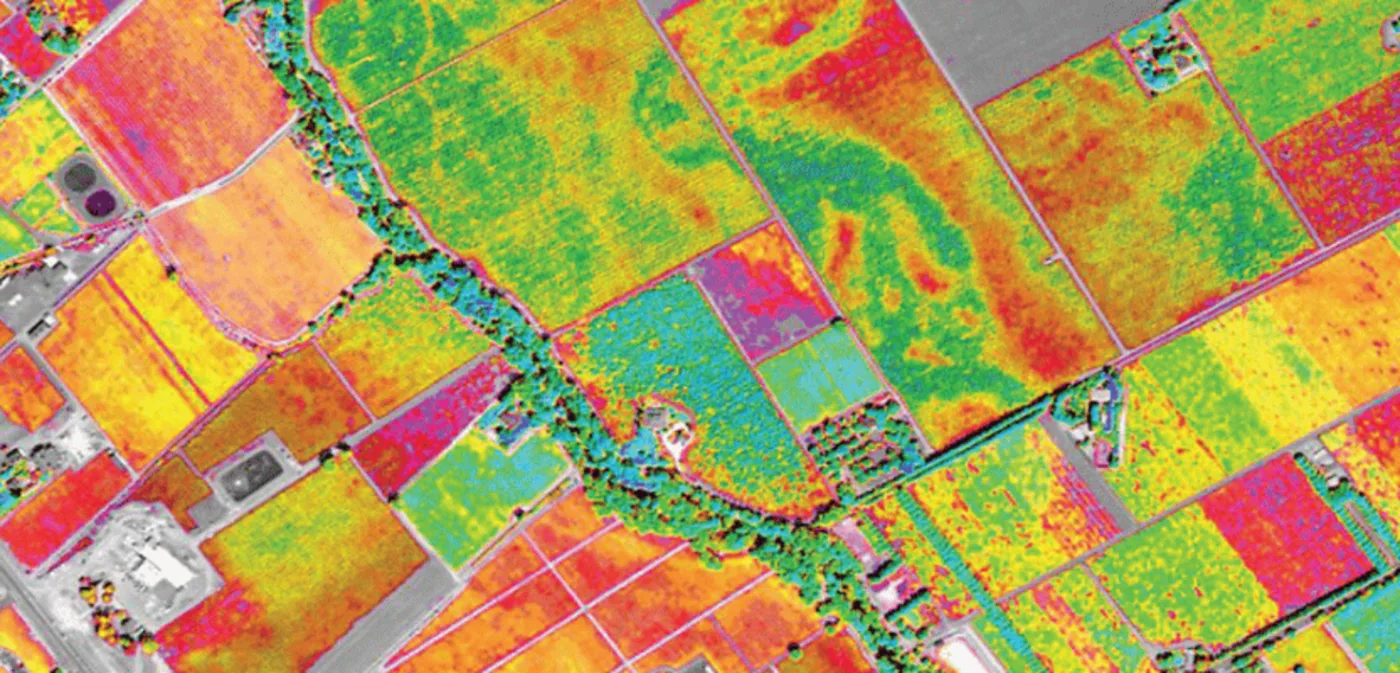
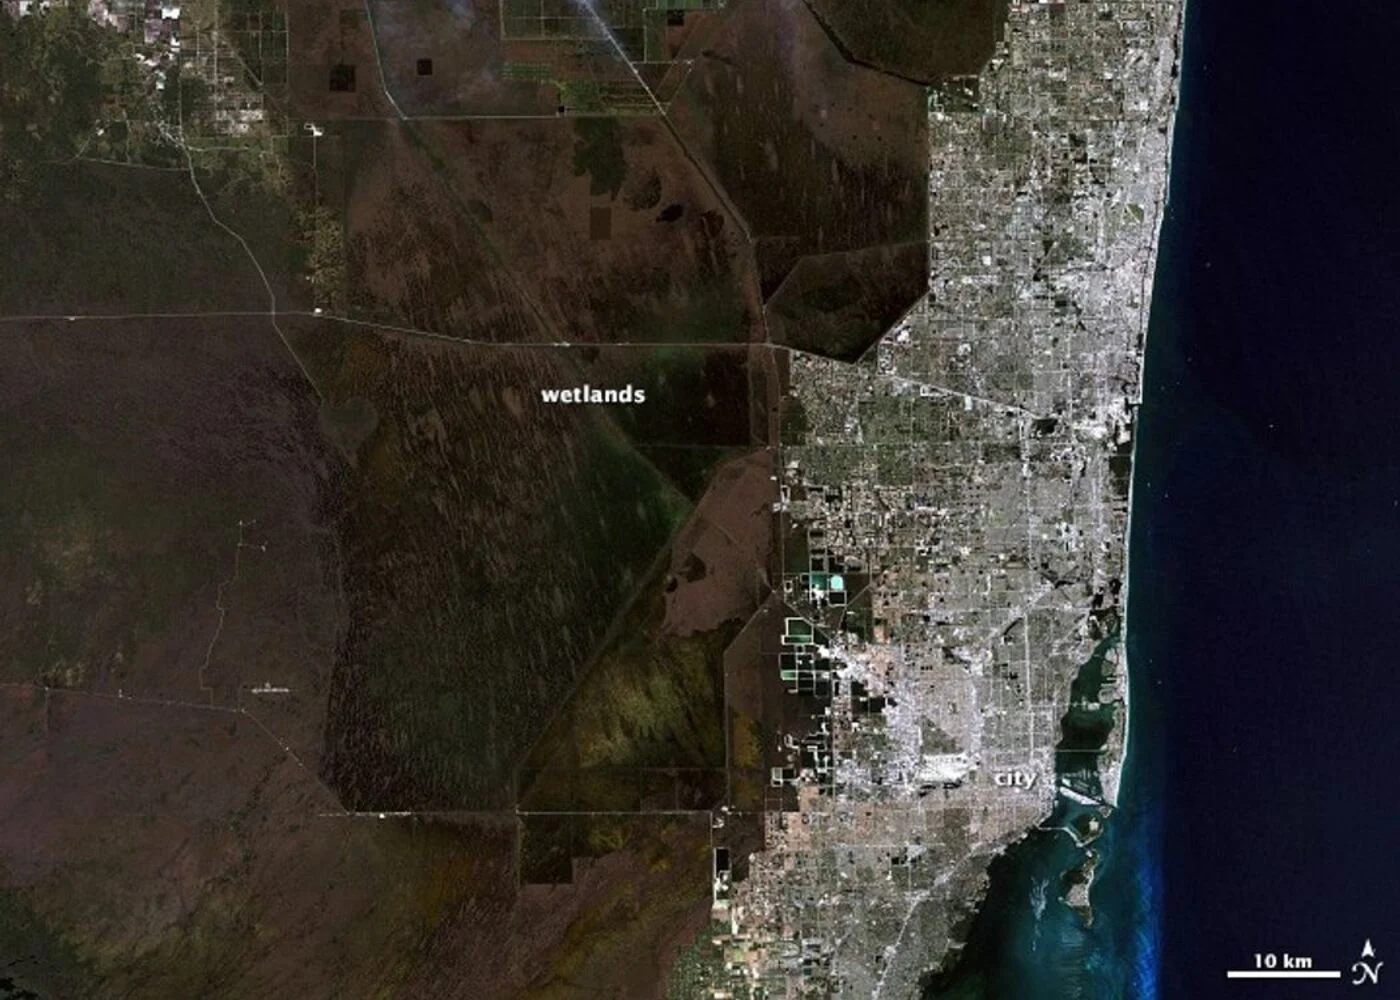
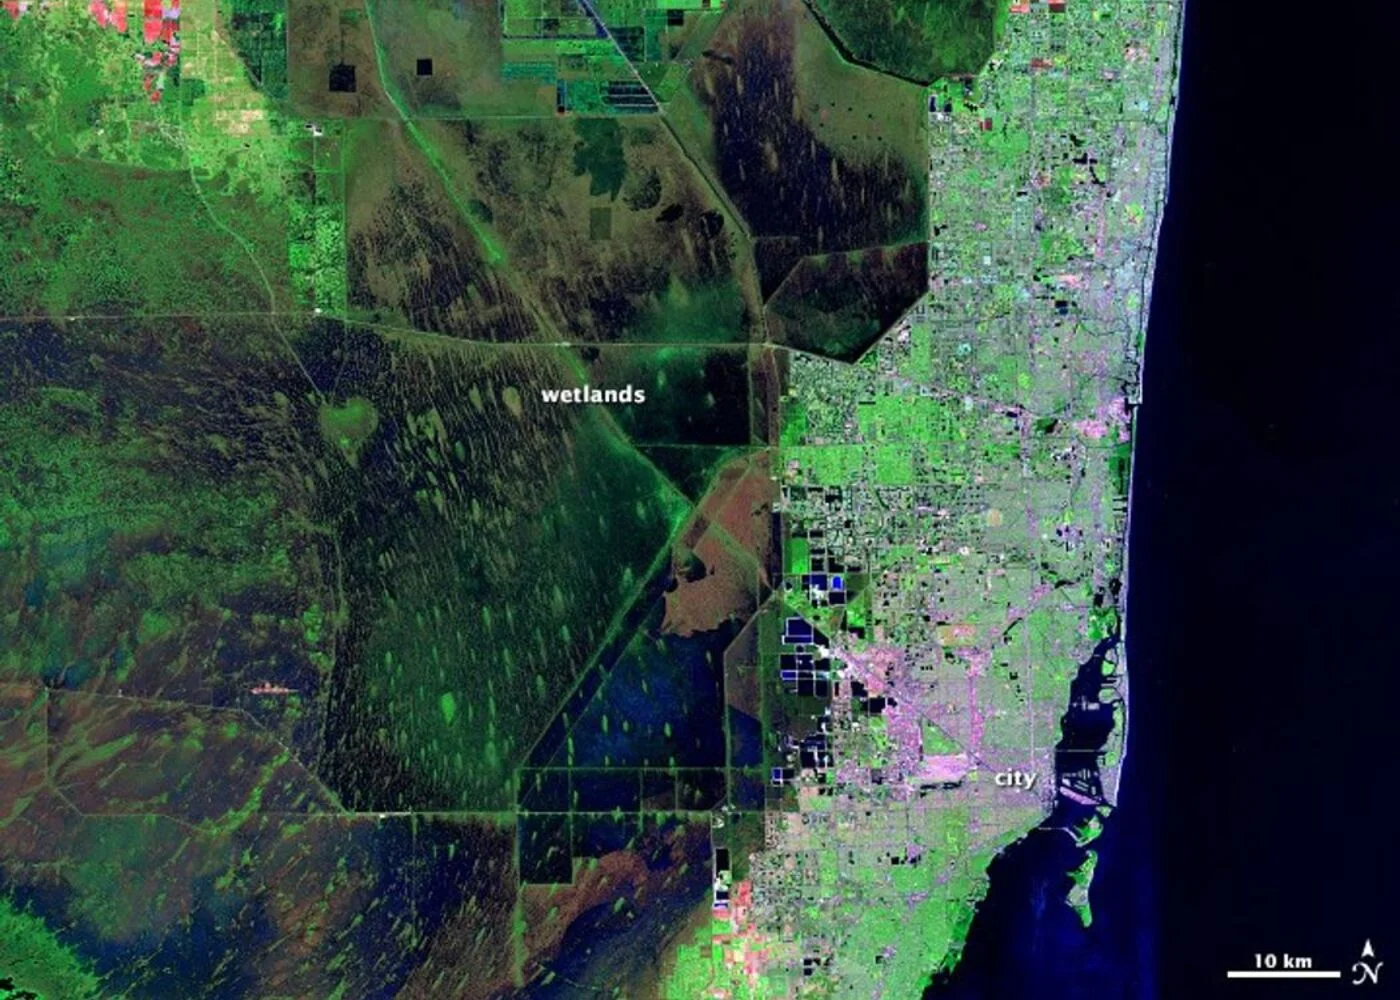
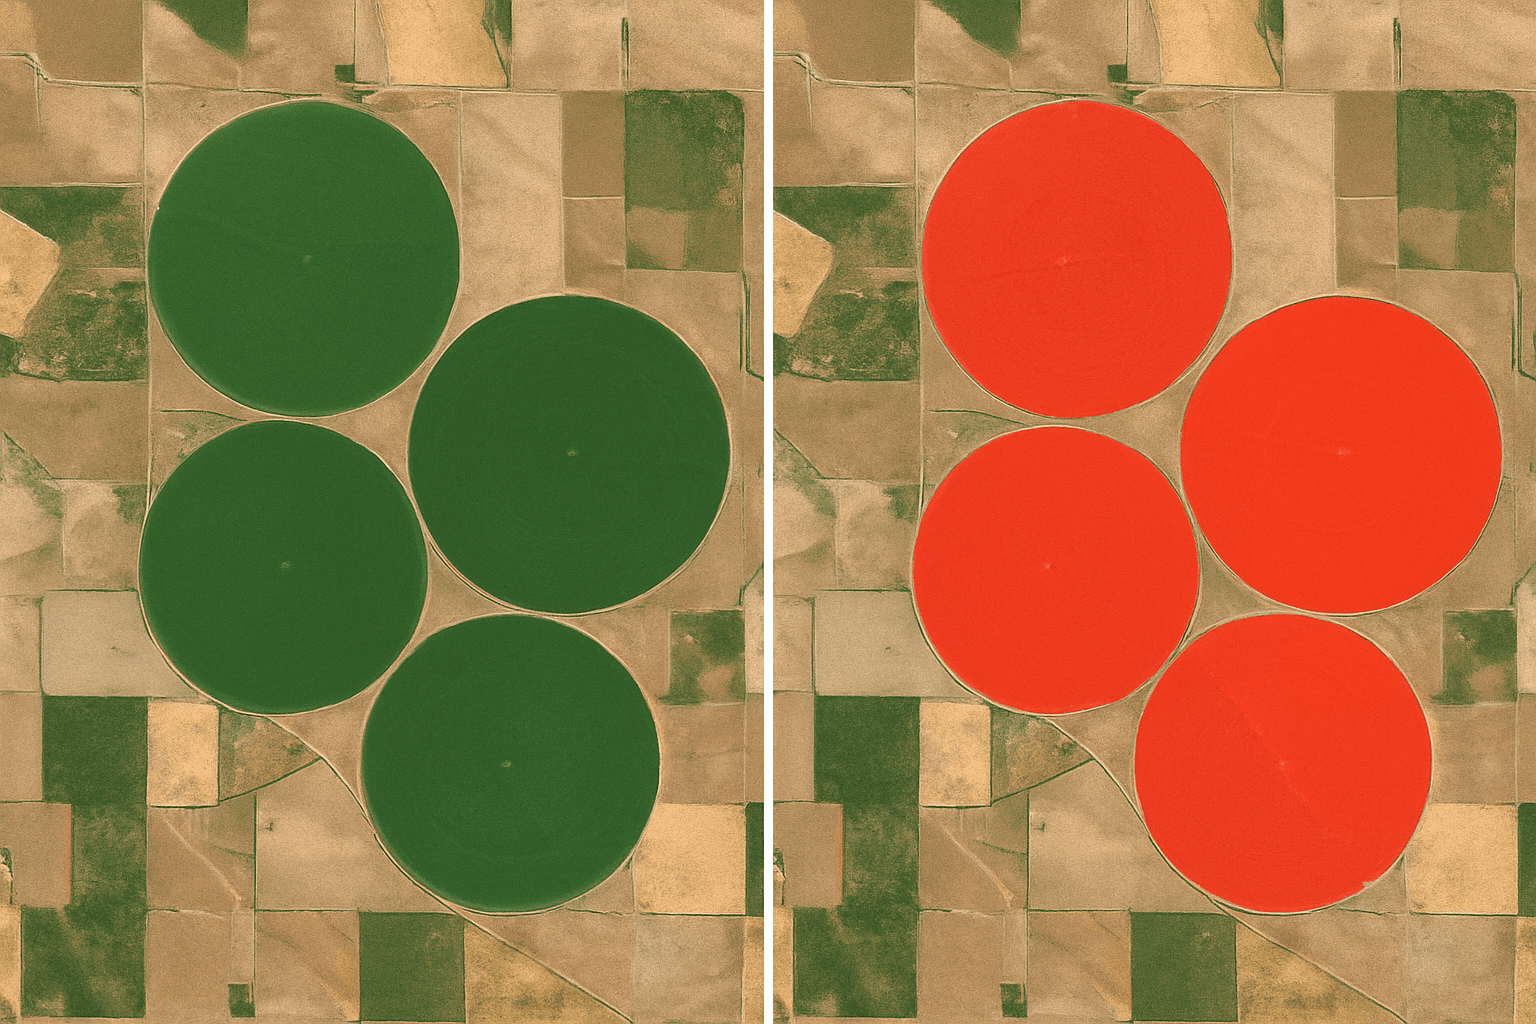
A multispectral image only becomes something a person can look at once someone decides which bands to display as red, green, and blue on a screen. Map the sensor's own Red, Green, and Blue bands onto the screen's Red, Green, and Blue channels and the result looks like an ordinary photo, a natural color composite. Swap one of those channels for a band the eye cannot see instead, shortwave infrared and near-infrared displayed as red and green is a common substitution, and the same underlying data becomes a false color composite. Nothing about the measurement changes between the two images below, only which bands get mapped to which color channel, yet the false color version exposes exactly the vegetation, water, and material boundaries the next two sections cover in detail.
How Multispectral Sensors Capture Data
A multispectral satellite does not take one photograph, it records several at once. Most spaceborne multispectral instruments use a pushbroom design, a single line of detector elements swept across the ground by the satellite's own orbital motion, with a separate detector array and bandpass filter set behind the optics for each spectral band. Every pixel in the finished image therefore carries a small array of independent brightness values, one per band, all sampled from the same instant and the same patch of ground. That is what makes a multispectral image fundamentally different from a colorized photo, it is a bundle of co-registered measurements, not one exposure with a filter over it.
Common Multispectral Bands Explained
Standard 4-band multispectral imagery covers Blue, Green, Red, and near-infrared. Extended configurations, sometimes called 1+8 band setups because they pair one high-resolution panchromatic band with eight multispectral bands, add a Purple or Coastal band for atmospheric correction and shallow-water work, a Yellow band tuned for early crop stress and mineral variation, a Red Edge band, and a second near-infrared channel. The table below covers what each band is actually used for.
| Band | Wavelength range | What it reveals |
|---|---|---|
| Purple / Coastal | 400 to 450 nm | Atmospheric aerosol correction and shallow coastal water clarity |
| Blue | 450 to 520 nm | Water penetration, soil and vegetation discrimination, true-color rendering |
| Green | 520 to 590 nm | Peak vegetation reflectance, water turbidity, true-color rendering |
| Yellow | 590 to 630 nm | Early crop stress, mineral variation, and foliage abnormality detection |
| Red | 630 to 690 nm | Chlorophyll absorption, the baseline every vegetation index measures against |
| Red Edge | 690 to 770 nm | Chlorophyll content and leaf cell structure, flags stress before it is visible |
| Near-Infrared (NIR1 / NIR2) | 770 to 1040 nm | Biomass, canopy density, and general vegetation vigor |
| Shortwave Infrared (SWIR) | 1570 to 2290 nm | Soil and canopy moisture, mineral and clay identification, burn severity |
| Thermal Infrared | Long-wave IR | Surface and canopy temperature, water stress, urban heat |
Red Edge in practice
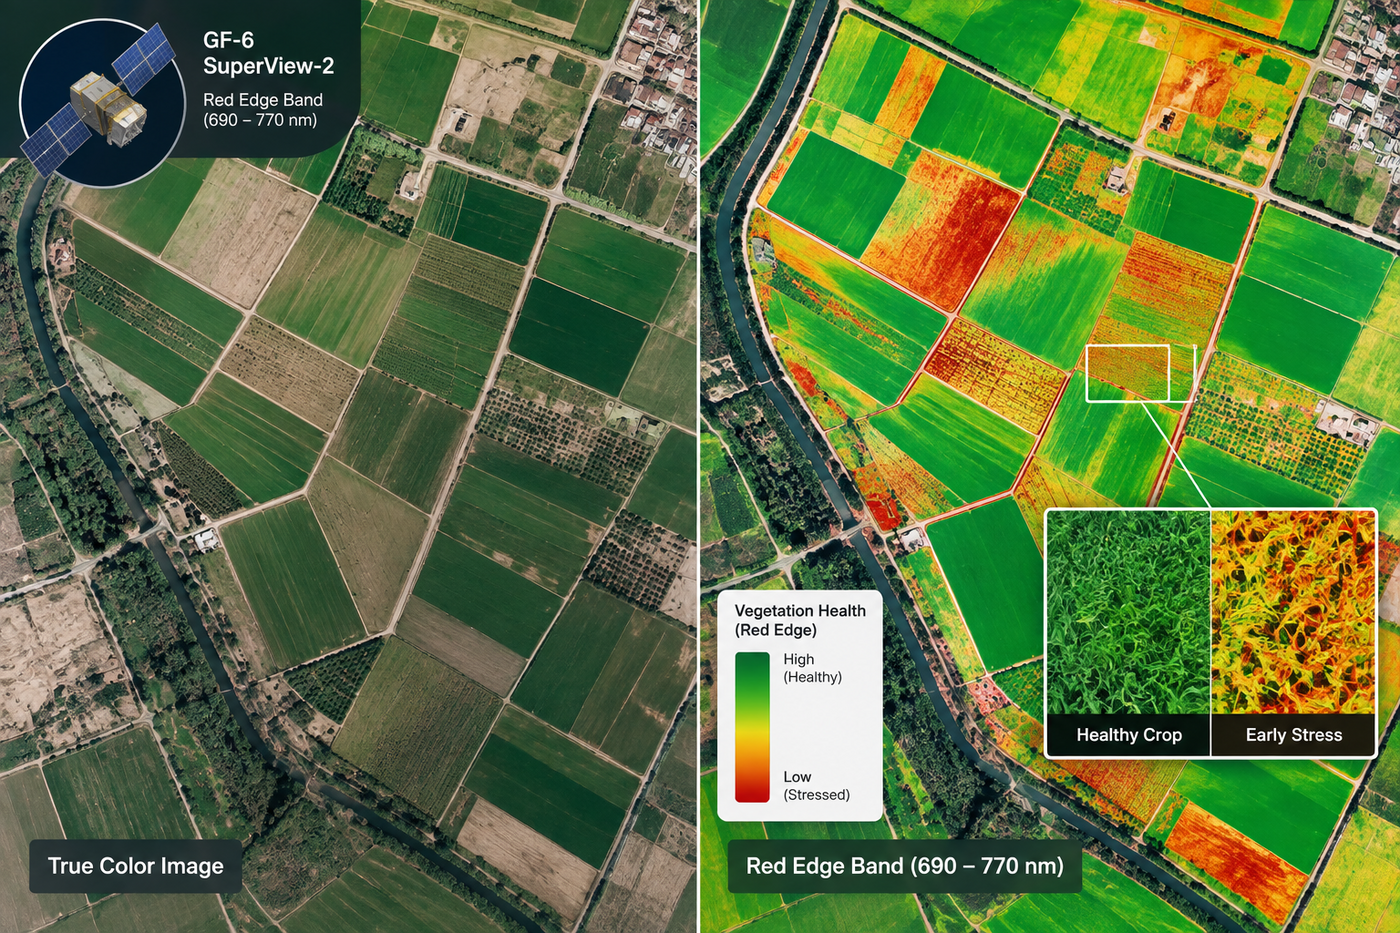
Carried by satellites such as SuperView-2 and GF-6, the Red Edge band sits at the exact transition where chlorophyll absorption drops off, reading changes in leaf cell structure days before a leaf visibly discolors.
Yellow band in practice
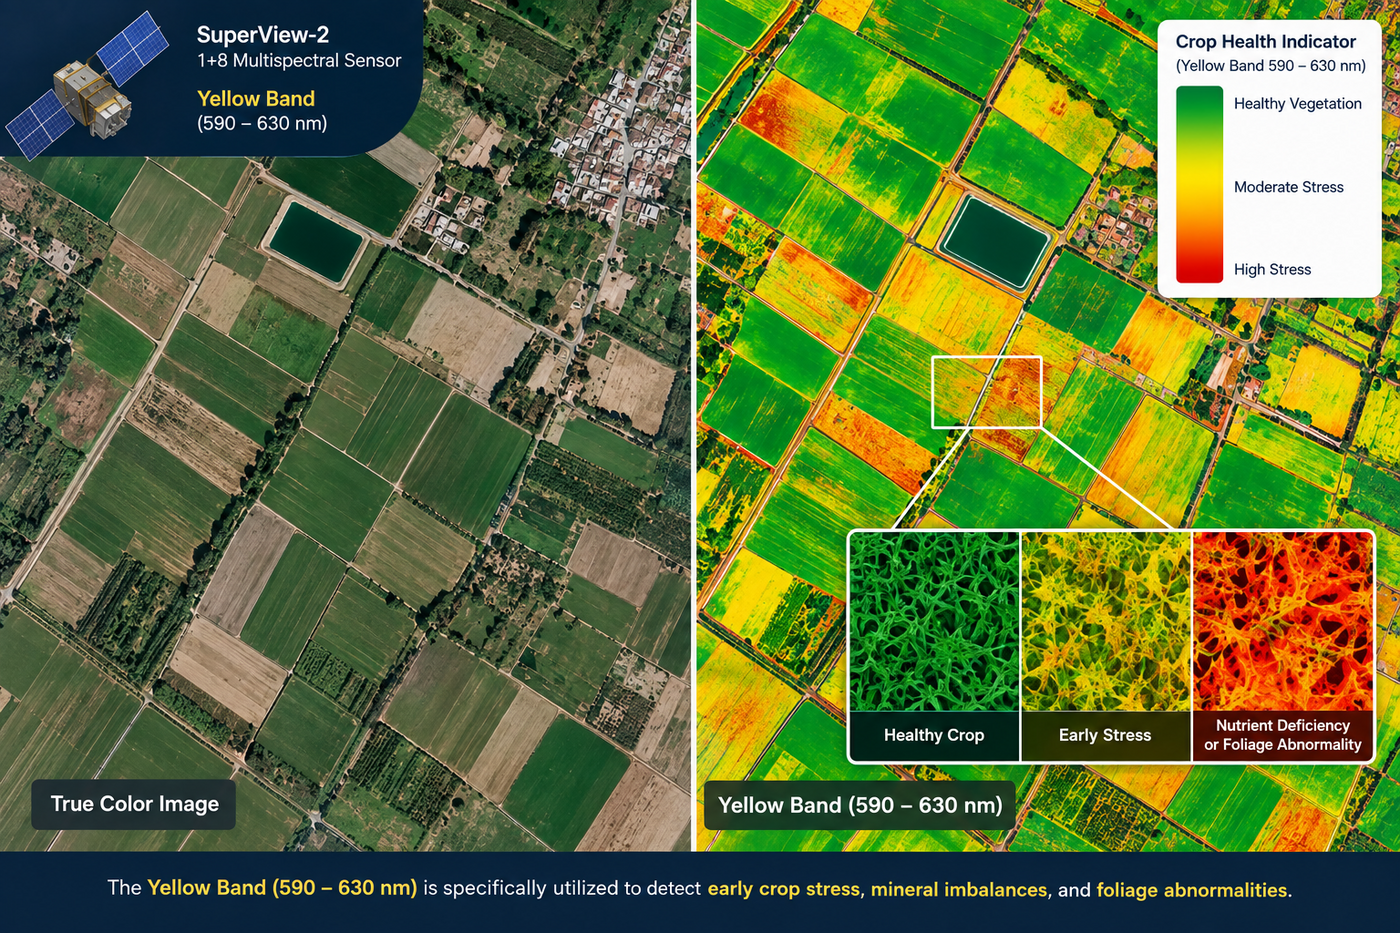
Found in 1+8 band sensors, the Yellow band is tuned specifically to flag early crop stress and mineral imbalance, a distinct signal from the general vigor a standard NDVI already tracks.
Dual near-infrared channels
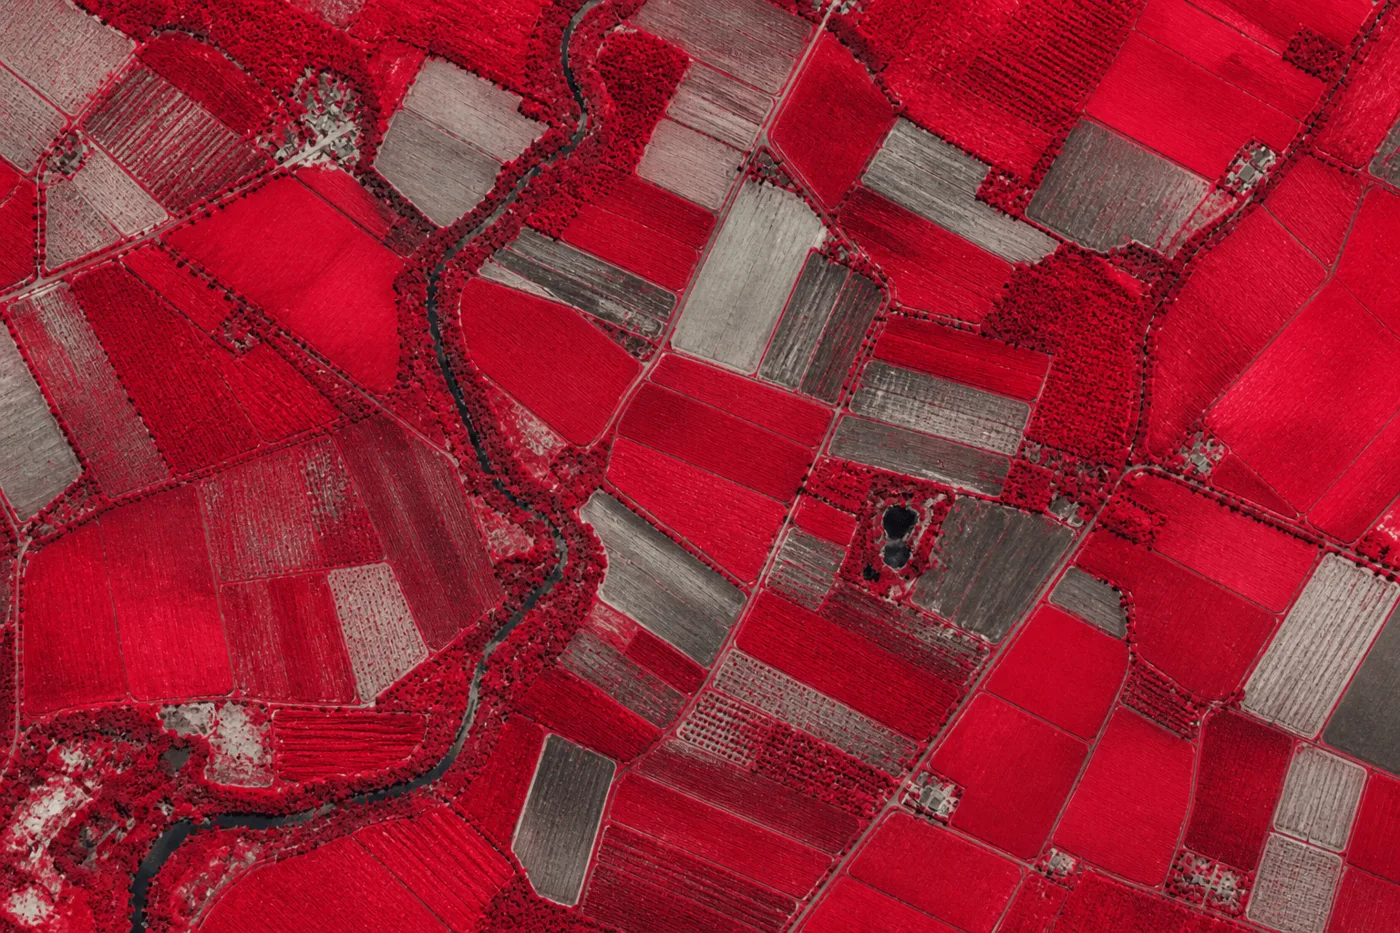
Two separate NIR channels give deeper analysis of total canopy biomass, foliage density, and moisture content than a single NIR band alone, the baseline every other index in this guide is measured against.
Why Different Materials Respond Differently in Multispectral Data
A multispectral image is useful precisely because materials do not reflect light uniformly. Four ground-cover types account for most operational multispectral analysis.
01. Vegetation
Healthy leaves reflect strongly in the near-infrared band because of how sunlight scatters inside the spongy mesophyll cell layer, while chlorophyll absorbs most red and blue light for photosynthesis. That gap between high NIR reflectance and low red reflectance is the entire basis of NDVI and every other vegetation index in this guide, and it narrows the moment a plant is stressed, diseased, or drying out, which is what makes early detection possible from orbit.
02. Water
Water absorbs almost all incoming near-infrared and shortwave infrared light, so open water reads as dark or black in those bands regardless of how bright it looks in true color, a sharp, reliable contrast even over turbid or shallow water where a visible-light photo alone is ambiguous. The environmental and emergency-response sections further down cover what that contrast is actually used for.
03. Soil and minerals
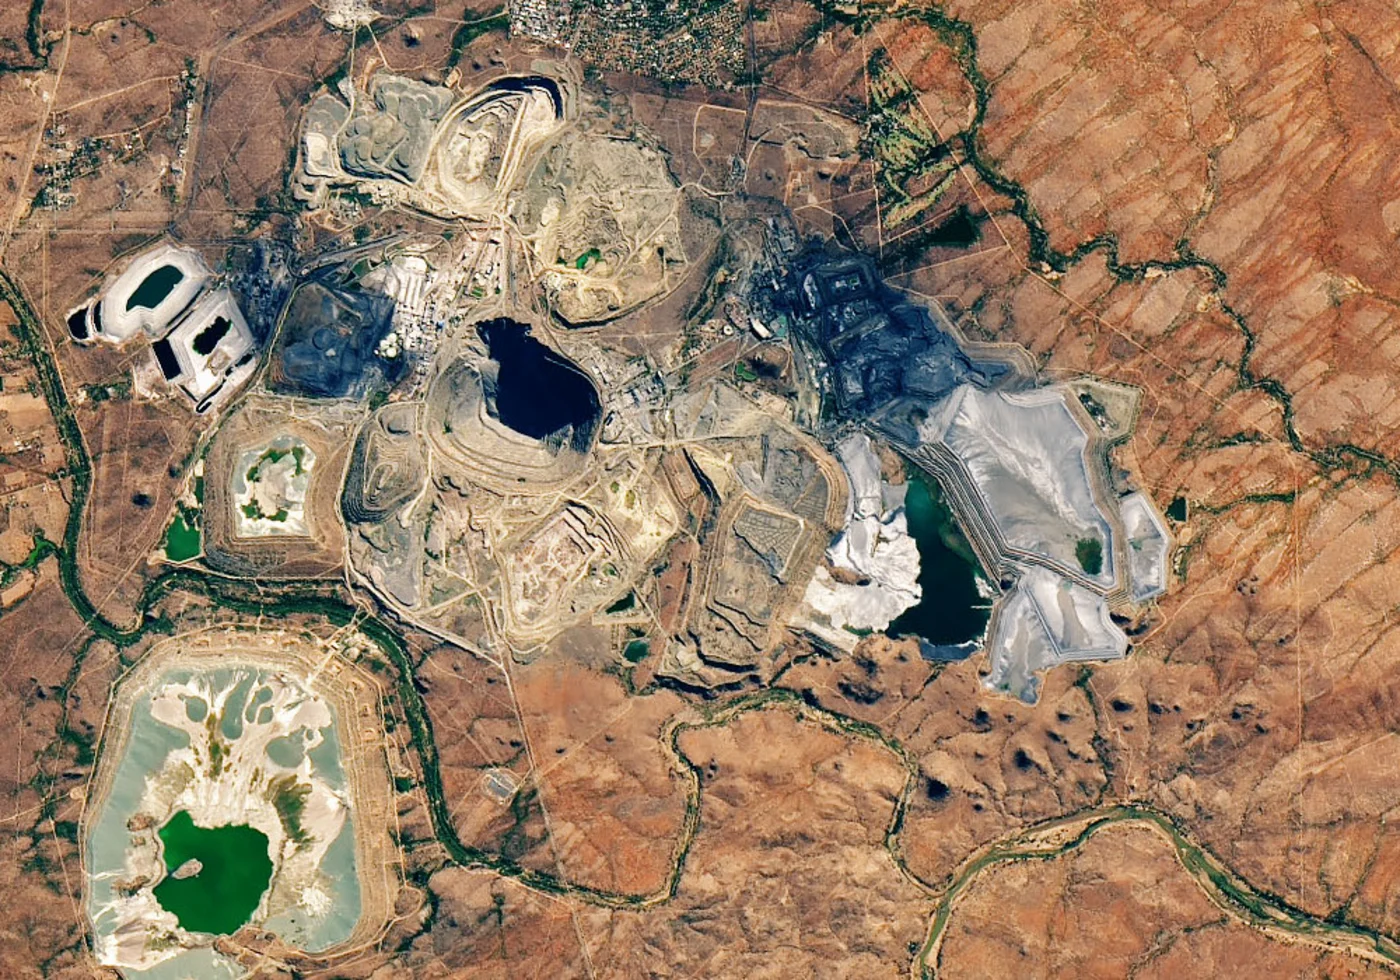
SWIR bands are particularly effective at separating soil types and mineral composition, because the hydroxyl-bearing clays, carbonates, and iron oxides common in soil and exposed rock each absorb shortwave infrared light differently. That single physical principle is what lets the same band data serve two very different industries, covered separately in the agriculture and mining sections of this guide.
04. Urban and built surfaces
Concrete, asphalt, and rooftops each carry a distinct, relatively flat spectral signature across the visible and near-infrared bands compared to vegetation or bare soil, the basis for the land-use and infrastructure applications covered in the urban planning section below.
Need multispectral coverage over your own site?
Search our live multispectral archive across Landsat, Sentinel-2, SuperView-2, and SuperView Neo-1, or task a fresh capture over your field, concession, or project boundary. No account needed for a first estimate.
Common Band Combinations and Vegetation Indices
Raw bands become genuinely useful once they are combined into an index, a simple formula that turns two or more bands into a single number per pixel.
NDVI, Normalized Difference Vegetation Index
(NIR minus Red) divided by (NIR plus Red)
The most widely used vegetation index anywhere in remote sensing, tracking general plant vigor and green biomass. A sudden drop against a field's own historical NDVI trend is usually the first visible sign of stress.

GNDVI, Green NDVI
(NIR minus Green) divided by (NIR plus Green)
More sensitive to chlorophyll concentration than standard NDVI, which makes it useful for mid-season nitrogen-status checks in precision agriculture.
EVI, Enhanced Vegetation Index
2.5 x (NIR minus Red) / (NIR plus 6Red minus 7.5Blue plus 1)
Corrects for atmospheric haze and canopy-background noise, and holds up better than NDVI once a crop canopy is dense and NDVI starts to saturate.
SAVI, Soil-Adjusted Vegetation Index
((NIR minus Red) / (NIR plus Red plus L)) x (1 plus L)
Adds a soil-brightness correction factor, L, which makes it more reliable than NDVI early in the growing season when a lot of bare soil is still visible between rows.
NDRE, Normalized Difference Red Edge
(NIR minus Red Edge) divided by (NIR plus Red Edge)
The primary index once a canopy has closed and standard NDVI has saturated, because the Red Edge band keeps responding to chlorophyll changes long after the Red band has maxed out.
CWSI, Crop Water Stress Index
Canopy temperature minus air temperature, normalized against stressed and non-stressed baselines
Built from thermal-band data rather than NIR and Red, CWSI separates dehydrating zones from well-watered ones, flagging where irrigation is actually needed before visible wilting.
Beyond agriculture, the same band-math approach builds indices for other materials entirely, NDWI (Green and NIR) for open water and flood extent, and the Normalized Burn Ratio, or NBR (NIR and SWIR), for mapping fire severity and post-fire vegetation recovery. Every one of these follows the same principle covered above, one band absorbs strongly where the other reflects strongly, and the ratio between them isolates exactly the material a team is trying to track.
Multispectral vs. Hyperspectral Imaging
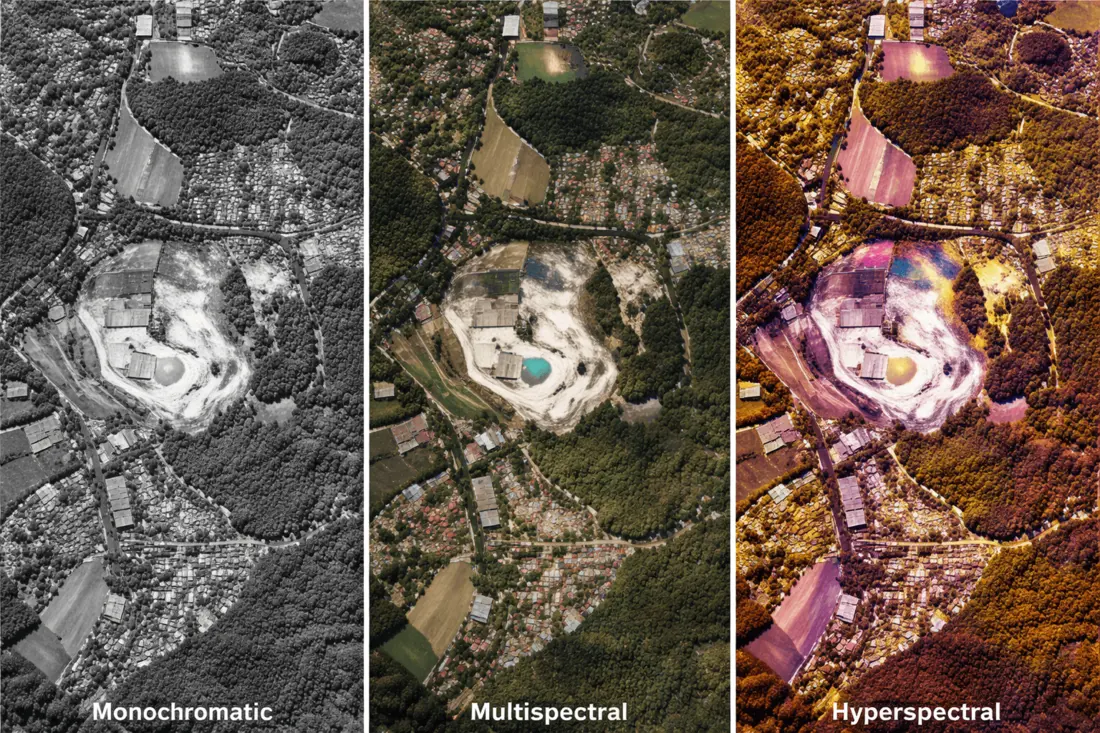
Multispectral and hyperspectral imaging are built on the same physical principle, measuring reflected light across multiple wavelength bands, but they differ enormously in spectral detail, data volume, and what each is actually good for. A multispectral sensor captures a handful of broad, separated bands. A hyperspectral sensor captures hundreds of narrow, continuous bands, turning every pixel into something closer to a lab-grade spectral fingerprint than a color reading.
| Factor | Multispectral imaging | Hyperspectral imaging |
|---|---|---|
| Number of bands | Typically 4 to 16 broad bands | 150 to 330-plus narrow, continuous bands |
| Spectral detail | Moderate, groups related wavelengths together | Very high, resolves individual absorption features |
| Material identification | Broad class detection, such as vegetation vs. bare soil | Identifies specific mineral species or chemical composition |
| Data volume | Lower, easier to store and process at scale | Much higher, hundreds of layers per scene |
| Processing complexity | Moderate, well-established index workflows like NDVI | High, typically needs spectral libraries and PCA |
| Typical use case | Operational mapping, vegetation health, water, land cover, wide-area monitoring | Mineral exploration, chemical fingerprinting, targeted material analysis |
In practice the two are complementary rather than competing. A multispectral pass is usually the first, wide-area screening step, cheap enough to run over an entire region on a regular schedule. Hyperspectral data then gets reserved for the smaller, higher-value area a multispectral or ground survey has already flagged as worth a closer, chemical-grade look, the same workflow we cover in detail in our guide to hyperspectral imaging for mineral exploration.
Applications of Multispectral Imagery
01. Precision agriculture and crop monitoring
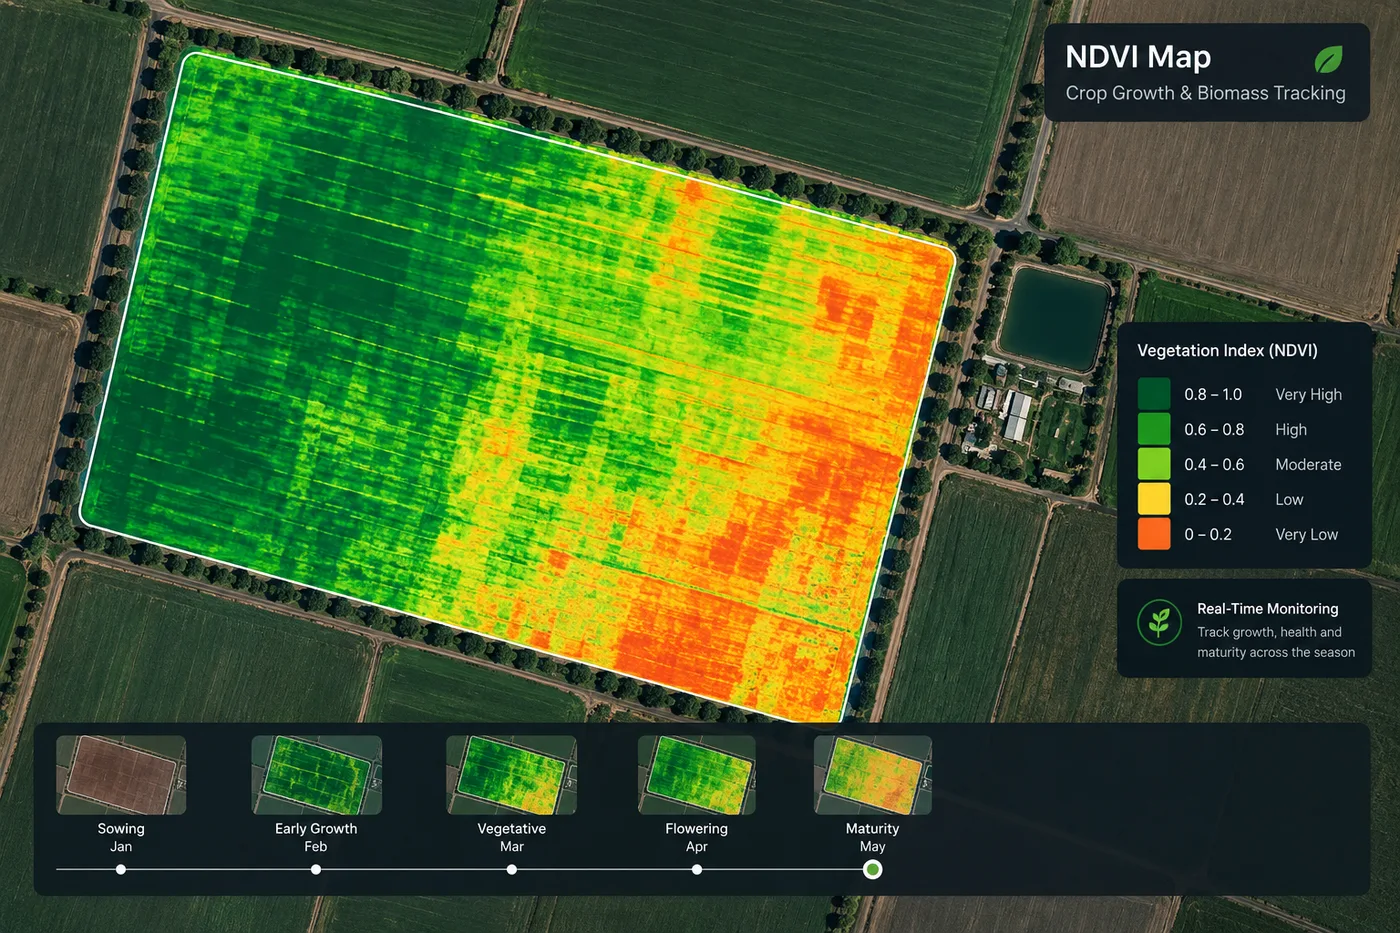
NDVI, NDRE, and CWSI time series track crop growth stage, nitrogen status, and irrigation need across an entire season, turning a satellite pass into an early warning system for drought, disease, and yield loss well before a field walk would catch it. See our guide to precision agriculture with satellite imagery for a full workflow.
02. Environmental and water quality monitoring
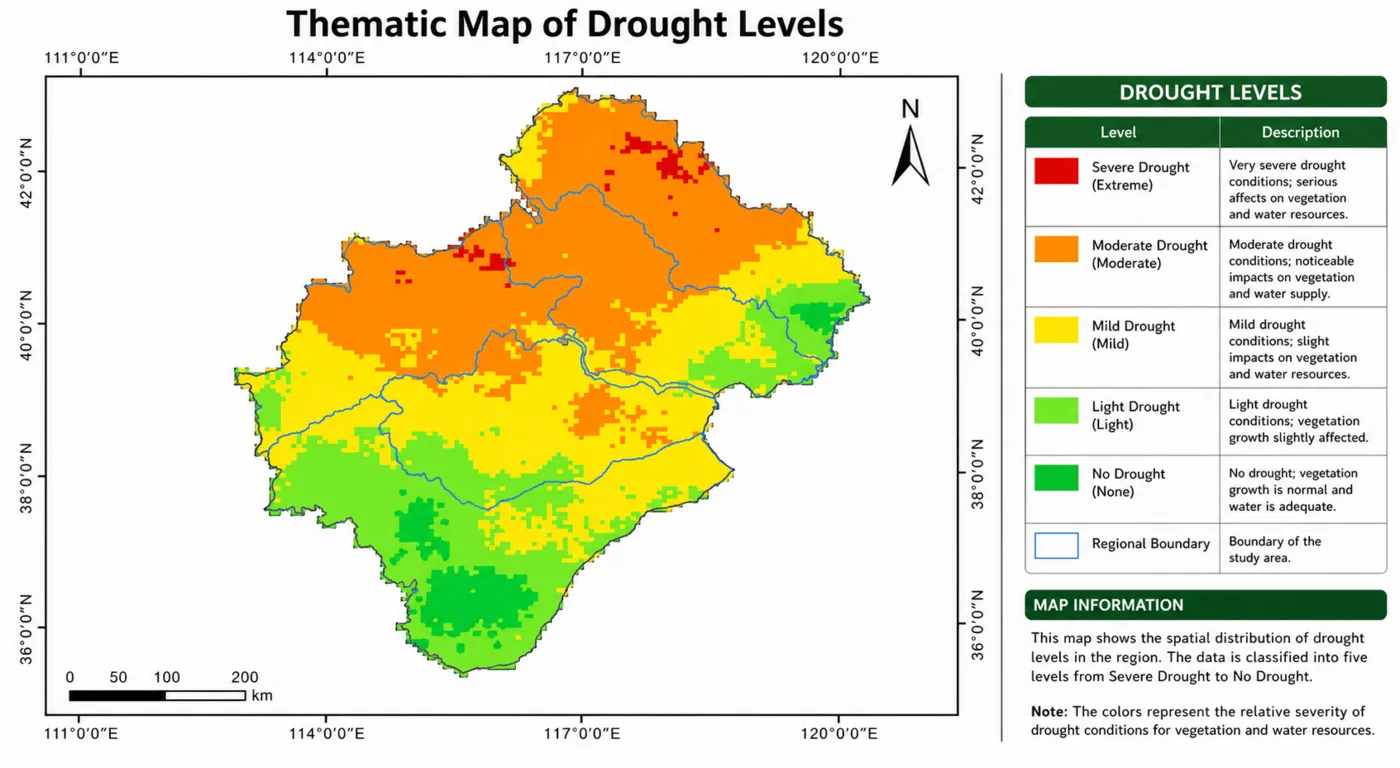
NIR and SWIR bands track chlorophyll concentration in lakes and coastal water, map suspended sediment, delineate wetlands, and flag deforestation and land cover change over years of archived imagery, giving regulators and researchers a consistent, repeatable record that ground sampling alone cannot match at the same scale.
03. Mining and geological exploration
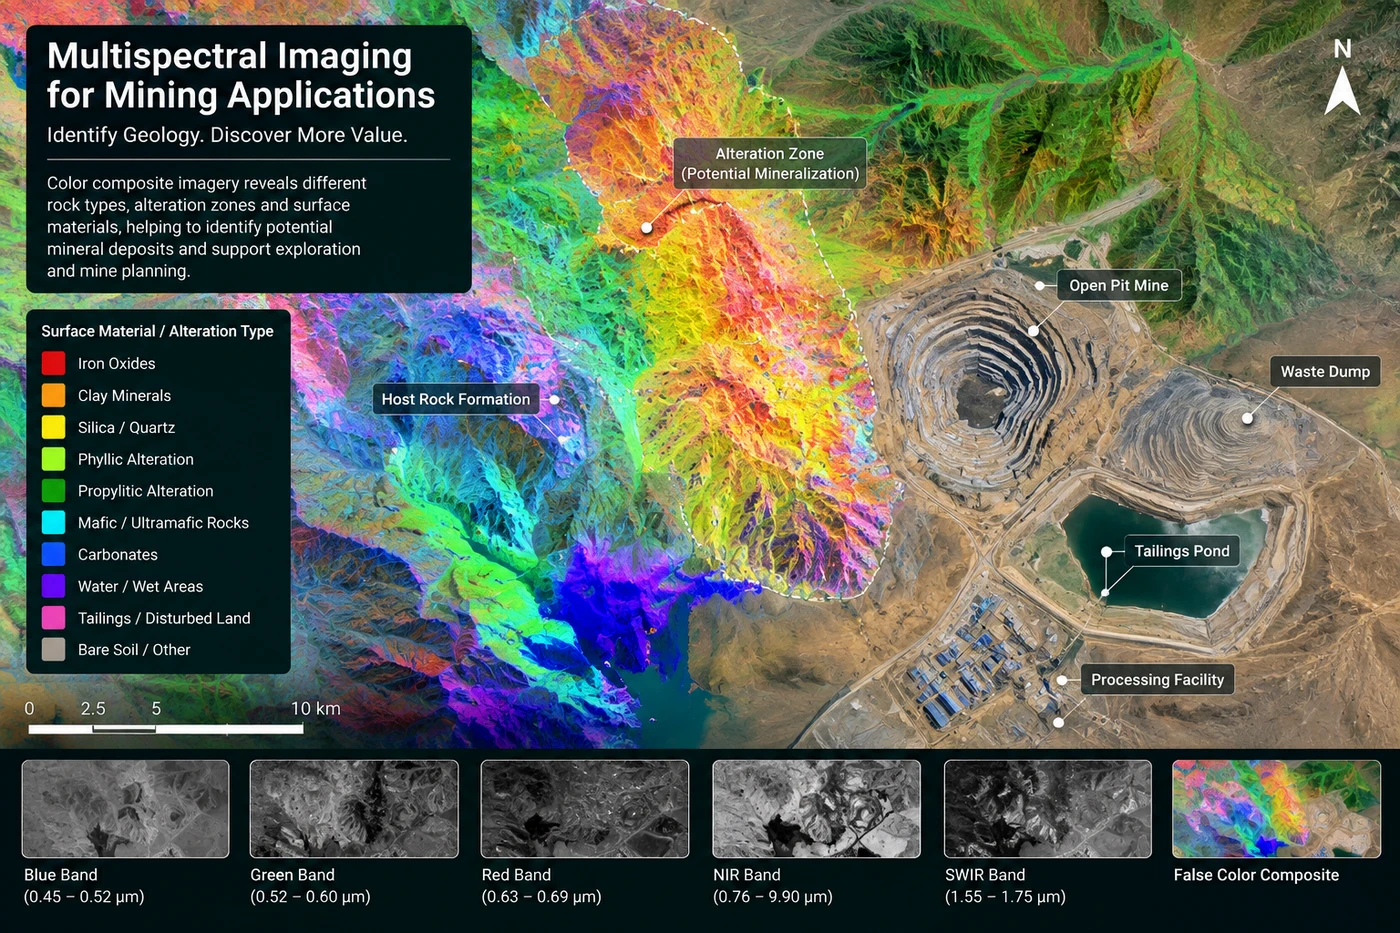
The SWIR mineral signatures covered above let exploration teams screen an entire concession for drill targets before mobilizing a single field crew, and later monitor tailings dam extent and land disturbance through the life of a mine. See how satellites monitor mining from exploration to closure.
04. Urban planning and infrastructure
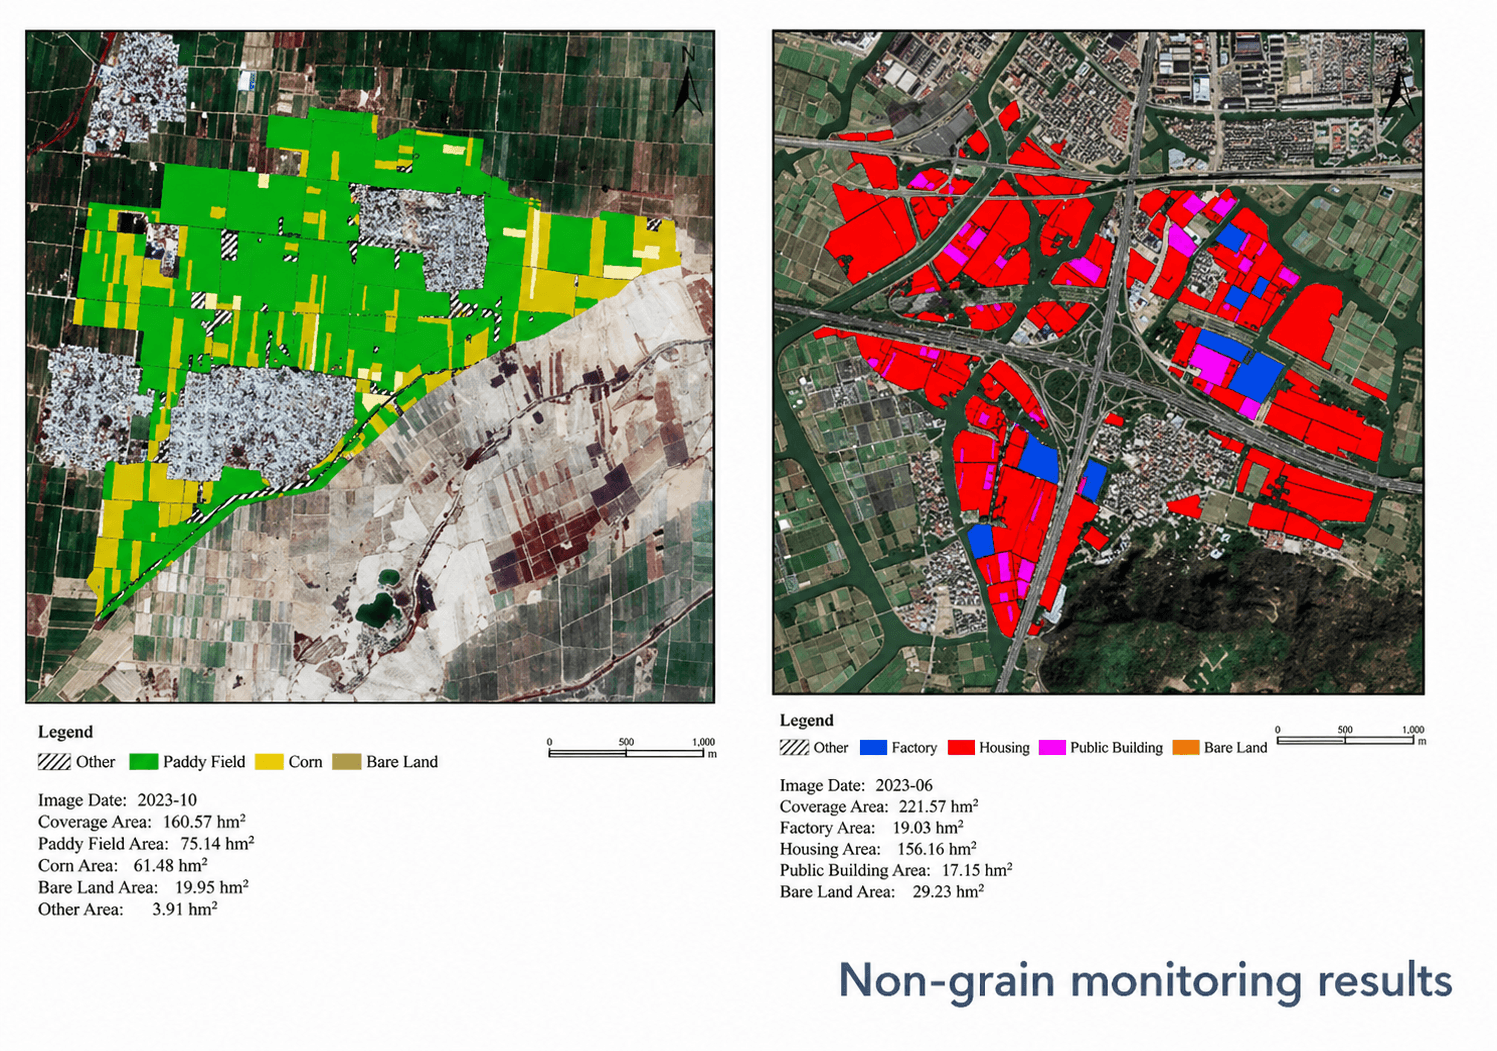
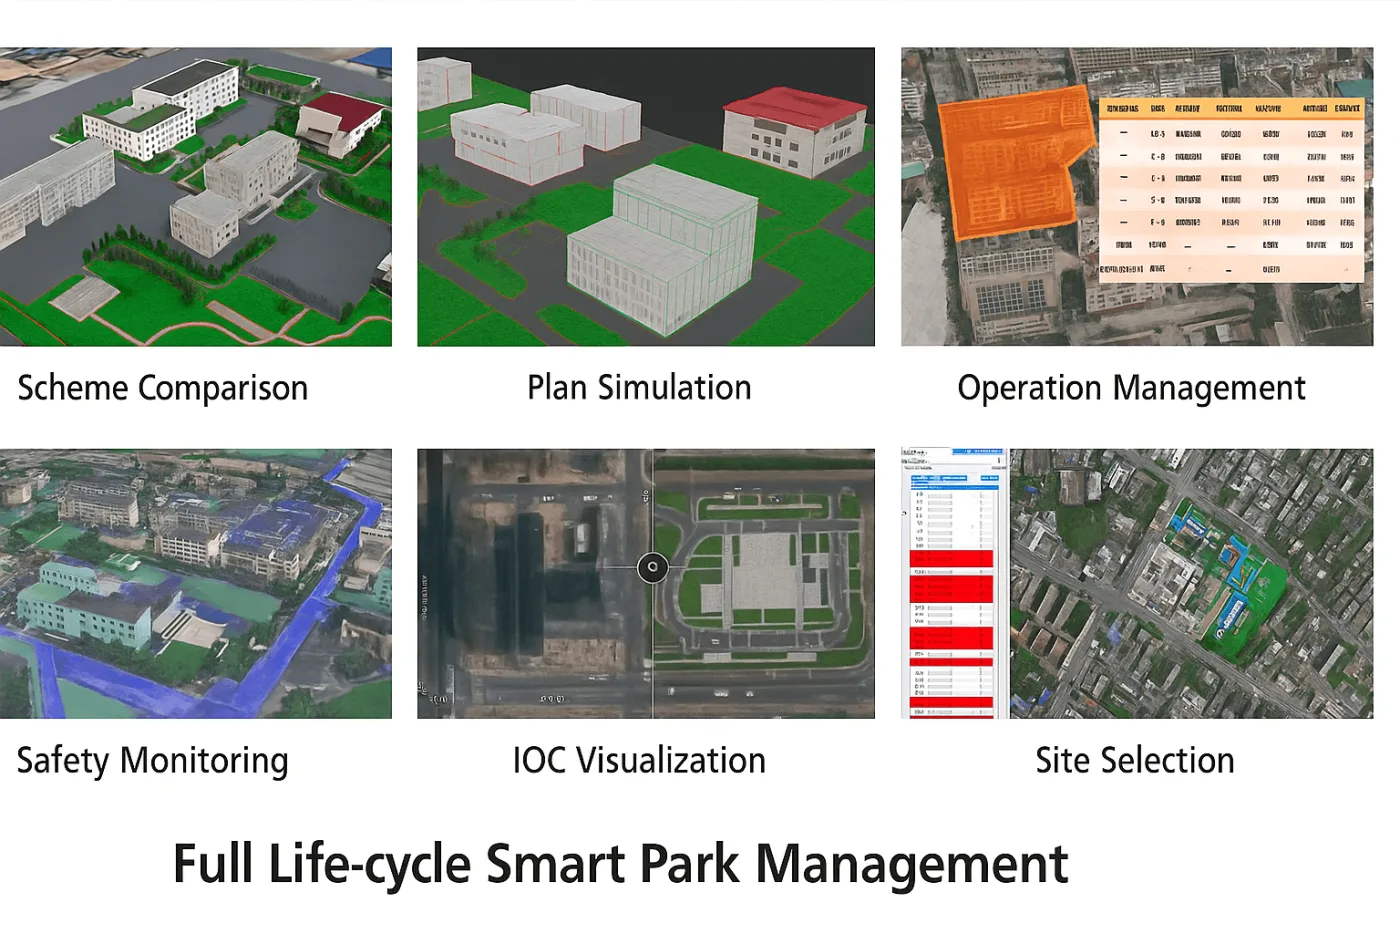
Multispectral classification separates impervious surface from vegetation and bare land, tracks construction progress, and supports land-use planning across a growing city over multi-year archives, covered in more depth in our guide to satellite-based urban growth change detection.
05. Emergency and disaster response
The NDWI and NBR combinations covered above turn into an emergency response tool within hours of a satellite pass, giving insurers and emergency managers a documented, geolocated record of flood extent or burn severity without waiting on a ground survey.
06. Forestry and land cover monitoring
Multispectral time series flag canopy stress, disease outbreaks, and illegal logging inside a forest concession long before a ground patrol would reach the same location, detailed further in our guide to forestry canopy monitoring with satellite imagery.
Satellites and Sensors That Capture Multispectral Imagery
Multispectral data comes from free government-operated missions and a much larger set of commercial constellations than most buyers realize. Across XRTech's own archive alone, more than twenty multispectral satellites and sensors are available, spanning sub-meter commercial imagery down to 50 m geostationary and thermal payloads, each suited to a different balance of resolution, revisit frequency, and cost.
Ultra-high and very-high resolution multispectral, under 1 m
| Satellite / sensor | Resolution | Bands and notes |
|---|---|---|
| SuperView Neo-1 | 0.25 to 0.3 m pan, 1 to 1.2 m MS | Panchromatic, Blue, Green, Red, NIR. Daily revisit at mid and high latitudes. |
| SuperView-2 (GFDM) | 0.42 m pan, 1.68 m MS | 1+8 bands incl. Purple, Yellow, Red Edge, dual NIR. Ag canopy health, chlorophyll stress, mineral analysis. |
| SuperView Neo-3 | 0.5 m pan, 2 m 8-band MS | 130 km swath, industry-leading wide-area VHR coverage. |
| SuperView-1 | 0.5 m pan, 2 m MS | Panchromatic, Blue, Green, Red, NIR. 4-satellite agile constellation, daily revisit, stereo capable. |
| BJ3N (Beijing-3B) | 0.3 m pan, 1.2 m 4-band MS | RGBN. First AI-operated satellite in the fleet, onboard AI for analytical processing. |
| Beijing-3A | 0.5 m pan, 2 m MS | 23.5 km swath. Mono, stereo, and tri-stereo 3D mapping. |
| GF-7 | Up to 0.65 m pan, 2.6 m MS | Panchromatic, Blue, Green, Red, NIR. Dual-linear CCD plus laser altimeter for 1 to 10,000-scale elevation modeling. |
| GF-2 | 0.8 m pan, 3.24 m MS | Panchromatic, Blue, Green, Red, NIR, 45 km swath. |
| TripleSat Constellation | 0.8 m pan, 3.2 m MS | Near-daily revisit. |
High and moderate resolution, wide-swath multispectral, 2 to 16 m
| Satellite / sensor | Resolution | Bands and notes |
|---|---|---|
| GF-6 | 2 m pan / 8 m MS, 90 km swath, plus 16 m Wide Field Imager, 800 km swath | RGB, NIR, plus Red Edge (690 to 730 nm and 730 to 770 nm), Purple, Yellow. Built specifically for precision agriculture. |
| GF-1 / B / C / D | 2 m pan / 8 m MS, 66 to 69 km swath, plus 16 m MS from 4 Wide Field Imagers, 830 km swath | Blue, Green, Red, NIR. |
| ZY-3 | 2.1 m nadir pan, 5.8 m MS | Blue, Green, Red, NIR. Built for 1 to 50,000-scale 3D mapping. |
| ZY-1 02C | 2.36 m / 5 m pan, 10 m MS | Wide-area optical monitoring. |
| Beijing-1 | 4 m optical | Deep historical archive for long-baseline change detection. |
| CBERS-04 / 04A | 2 to 5 m pan, 8 to 10 m MS, plus 17 to 73 m wide-swath channels | MUX, IRS (SWIR and thermal), and WFI sensors, up to an 866 km swath. |
| HJ-1A / HJ-1B | 30 m, 700 km swath | Blue, Green, Red, NIR CCD, plus a 100 m hyperspectral imager (1A) or 150 to 300 m SWIR / thermal channel (1B). |
Geostationary, thermal, and infrared multispectral, 20 to 50 m
| Satellite / sensor | Resolution | Bands and notes |
|---|---|---|
| GF-4 | 50 m VNIR, 400 m MWIR | Visible, NIR, MWIR (3.5 to 4.1 µm). Geostationary at 36,000 km, continuous regional observation with updates every 20 seconds. |
| GF-5B VIMS | 20 m VIS / SWIR, 40 m MWIR / LWIR | 12 bands spanning visible, SWIR, MWIR, and LWIR thermal (8 to 12.5 µm), for thermal anomaly, water quality, and gas monitoring. A separate payload on the same satellite from the 330-band AHSI hyperspectral instrument covered in our hyperspectral mineral exploration guide. |
| SJ-9A | 2.5 m pan, 10 m MS | Blue, Green, Red, NIR. |
| SJ-9B | 73 m | Long-wave infrared focal plane array, 8 to 12 µm. |
Free and open-access multispectral
| Satellite / sensor | Resolution | Bands and notes |
|---|---|---|
| Sentinel-2 | 10 to 60 m MS | 13 bands incl. Red Edge, NIR, SWIR. 5-day combined revisit, free via ESA Copernicus. |
| Landsat series (4, 5, 7, 8, 9) | 15 m pan, 30 m MS | TM, ETM+, and OLI/TIRS sensors covering RGB, NIR, SWIR, and thermal, with an archive back to 1982, free via USGS. |
Multispectral imaging by the numbers
Figures drawn from mission specifications and published remote sensing research, not marketing estimates.
Multispectral satellites and sensors in XRTech's own archive, from sub-meter commercial imagery down to free 30 m Landsat data.
Combined revisit time for the Sentinel-2 constellation, free of charge through ESA's Copernicus program.
Correlation reached in a state-level NDVI yield model validated against surveyed harvest data, versus 0.57 at the individual field level using machine-harvest data.
Accuracy of a 3-meter satellite NDVI model predicting Midwest cash-crop yield without any agrometeorological data as an input.
Where Multispectral Imagery Fits in Earth Observation
Multispectral data sits at the center of most operational Earth observation programs, positioned between three other data types rather than replacing any of them. RGB satellite imagery is cheaper to interpret visually but carries none of the band-math analytical power, and hyperspectral trades away multispectral's low cost and simple processing for far deeper material identification, covered in the comparison above. The fourth data type, Synthetic Aperture Radar, or SAR, works on an entirely different principle, sending its own microwave signal and reading what bounces back, which lets it see straight through cloud cover and darkness in a way no optical sensor, multispectral or hyperspectral, ever can. That is why radar and multispectral end up paired rather than swapped for one another on most working satellite programs, radar for structure and all-weather monitoring, multispectral for the material and vegetation detail radar cannot resolve.
Key takeaways
- Multispectral imaging captures 4 to 16 or so discrete bands, adding near-infrared, shortwave infrared, and often Red Edge and thermal data that a standard RGB photo cannot record at all.
- Vegetation, water, soil, minerals, and built surfaces each reflect and absorb these bands differently, which is the physical basis for every vegetation index and band combination covered in this guide.
- NDVI, GNDVI, EVI, SAVI, NDRE, and CWSI each isolate a slightly different signal, general vigor, chlorophyll, dense-canopy biomass, early-season soil correction, post-canopy-closure stress, and water stress respectively.
- Hyperspectral imaging uses the same principle but with hundreds of narrow, continuous bands instead of a handful of broad ones, trading data volume and processing complexity for lab-grade material identification.
- Free multispectral data from Landsat and Sentinel-2 covers most operational monitoring needs, while commercial sensors like SuperView-2 and SuperView Neo-1 add sub-meter resolution and tasked, on-demand capture.
Frequently asked questions
What is multispectral imaging?
Multispectral imaging is a remote sensing technique that captures reflected light across several discrete wavelength bands, typically 4 to 16, spanning the visible spectrum plus near-infrared and shortwave infrared. Each band reveals how vegetation, water, soil, minerals, or built structures absorb and reflect light differently, which standard RGB photography cannot show.
What is the difference between multispectral and RGB imaging?
RGB imaging only records red, green, and blue visible light, the same wavelengths a human eye responds to. Multispectral imaging adds bands the eye cannot see, most importantly near-infrared and shortwave infrared, which is where most of the useful information about vegetation health, moisture, and mineral composition actually lives.
What is the difference between multispectral and hyperspectral imaging?
Multispectral sensors capture 4 to 16 broad, separated bands, enough for vegetation indices and land cover classification. Hyperspectral sensors capture 150 to over 330 narrow, continuous bands, enough to identify specific mineral species and chemical composition with near lab-grade accuracy, at the cost of much larger data volumes and more complex processing.
What spectral bands does multispectral imagery typically include?
A standard configuration includes Blue, Green, Red, and near-infrared. Extended 1+8 band setups add a Purple or Coastal band, a Yellow band, a Red Edge band, a second near-infrared channel, shortwave infrared, and sometimes a thermal band, each tuned to a different material property.
What is NDVI and how is it calculated?
NDVI, the Normalized Difference Vegetation Index, is calculated as (NIR minus Red) divided by (NIR plus Red). It is the most widely used vegetation index in remote sensing, tracking general plant vigor and green biomass from a single multispectral pass.
How do multispectral satellites actually separate the different wavelength bands?
Most spaceborne multispectral instruments use a pushbroom sensor design, a line of detector elements swept across the ground by the satellite's own motion, with a separate detector array and bandpass filter behind the optics for each band. Handheld and drone-mounted multispectral, or multispectrum, cameras use a similar filter-per-band approach in a much smaller package.
What are the main applications of multispectral imagery?
Common applications include precision agriculture and crop monitoring, environmental and water quality monitoring, mining and geological exploration, urban planning and infrastructure tracking, flood and wildfire emergency response, and forestry and land cover monitoring.
Which satellites provide free multispectral imagery?
Landsat 8 and 9, operated by the USGS, and the Sentinel-2 constellation, operated by ESA's Copernicus program, both provide multispectral imagery free of charge. Landsat delivers 11 bands at 30 m resolution with an 8-day combined revisit, while Sentinel-2 delivers 13 bands at 10 to 60 m resolution with a 5-day revisit.
How much does commercial multispectral satellite imagery cost?
Cost depends on resolution, tasking versus archive access, and area of interest. Sub-meter commercial sensors such as SuperView-2 and SuperView Neo-1 cost more per square kilometer than free Landsat or Sentinel-2 data, but deliver far finer detail and, for tasked capture, a chosen acquisition date rather than waiting on the next scheduled pass.
Is multispectral imaging only used with satellites?
No. Multispectral imaging also runs on drones and handheld devices, where a compact multispectral or multispectrum camera is used for field-level crop scouting, color matching, and material inspection at a resolution no satellite pass can match, complementing rather than replacing satellite-scale monitoring.
How is multispectral imagery different from SAR, radar, imagery?
Multispectral imaging is an optical technique, it measures reflected sunlight and needs a cloud-free daytime pass. SAR, Synthetic Aperture Radar, sends its own microwave signal and reads what bounces back, working through cloud cover and darkness. The two are complementary, radar for all-weather structural monitoring, multispectral for vegetation and material detail radar cannot resolve.
For a deeper look at when the extra spectral detail is worth the added cost and complexity, see our guide to hyperspectral imaging in mineral exploration. To choose the right ground resolution for your own project once bands are covered, see choosing the right satellite resolution.
Sources and further reading
- USGS: Landsat 8/9 Operational Land Imager (OLI-2) band specifications and revisit cycle
- ESA Copernicus: Sentinel-2 MSI band, resolution, and revisit specifications
- China Siwei and XRTech Group: SuperView, GF, ZY, Beijing, CBERS, HJ, and SJ series satellite and sensor specifications
- NASA Science, Earth Observatory: how to interpret a false-color satellite image
- Peer-reviewed remote sensing studies on NDVI-based crop yield prediction accuracy, field- and state-level validation
Ready to put multispectral data to work?
Search free and commercial multispectral archive over your area of interest, or request tasking for a specific acquisition date. Get a first estimate in minutes, no account required.