Satellite Imagery for Crop Stress and Disease Detection
On this page
- What counts as crop stress versus crop disease
- How AI models classify pest and disease risk
- The spectral bands that reveal stress before it is visible
- Red Edge (690 to 770 nm)
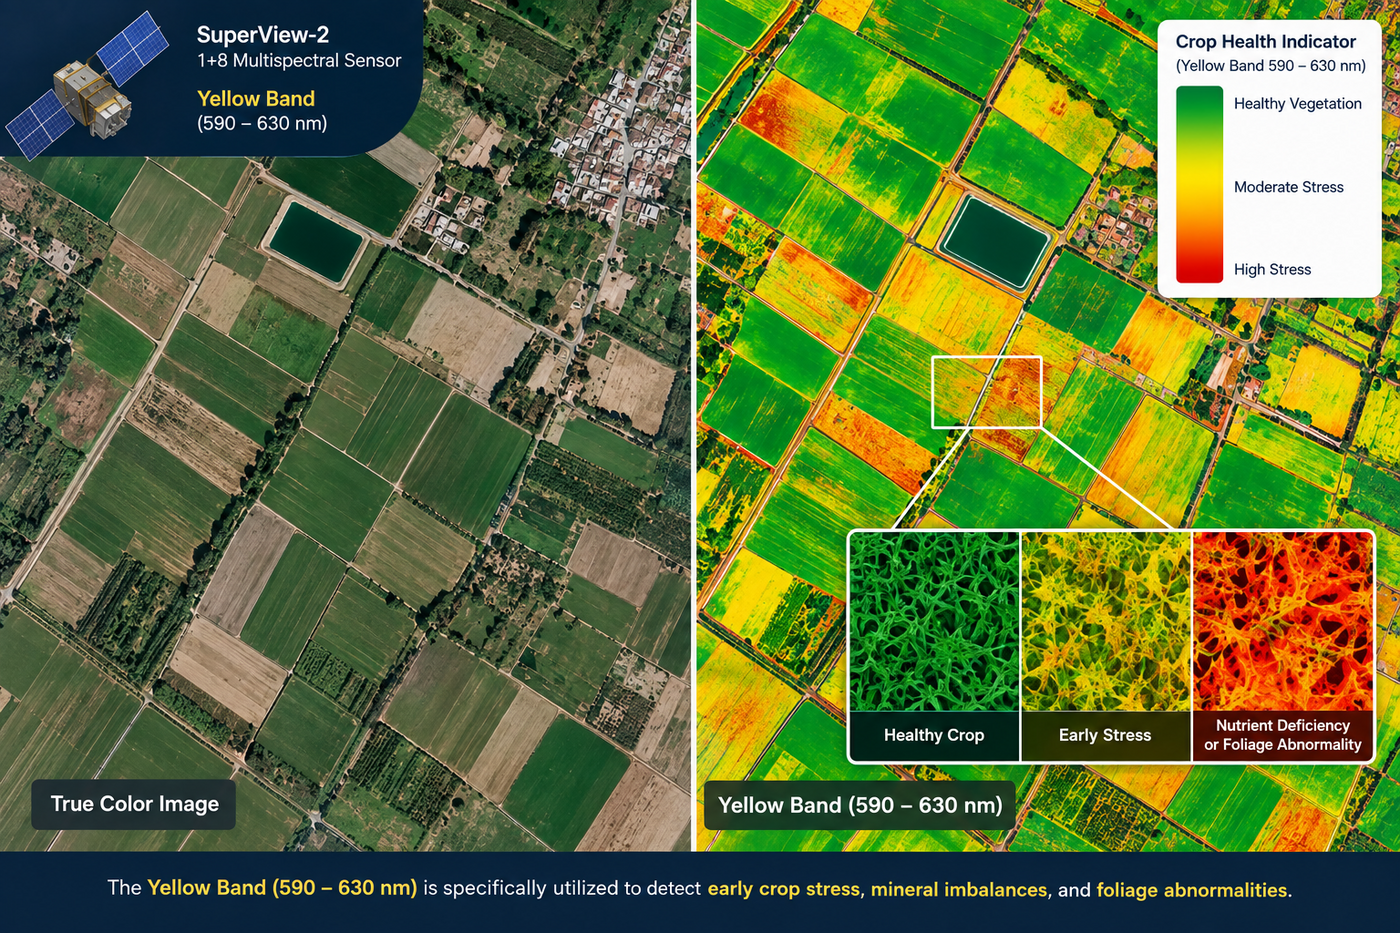
- Yellow Band (590 to 630 nm)
- Near-Infrared, NIR1 and NIR2
- The vegetation indices used to diagnose crop stress
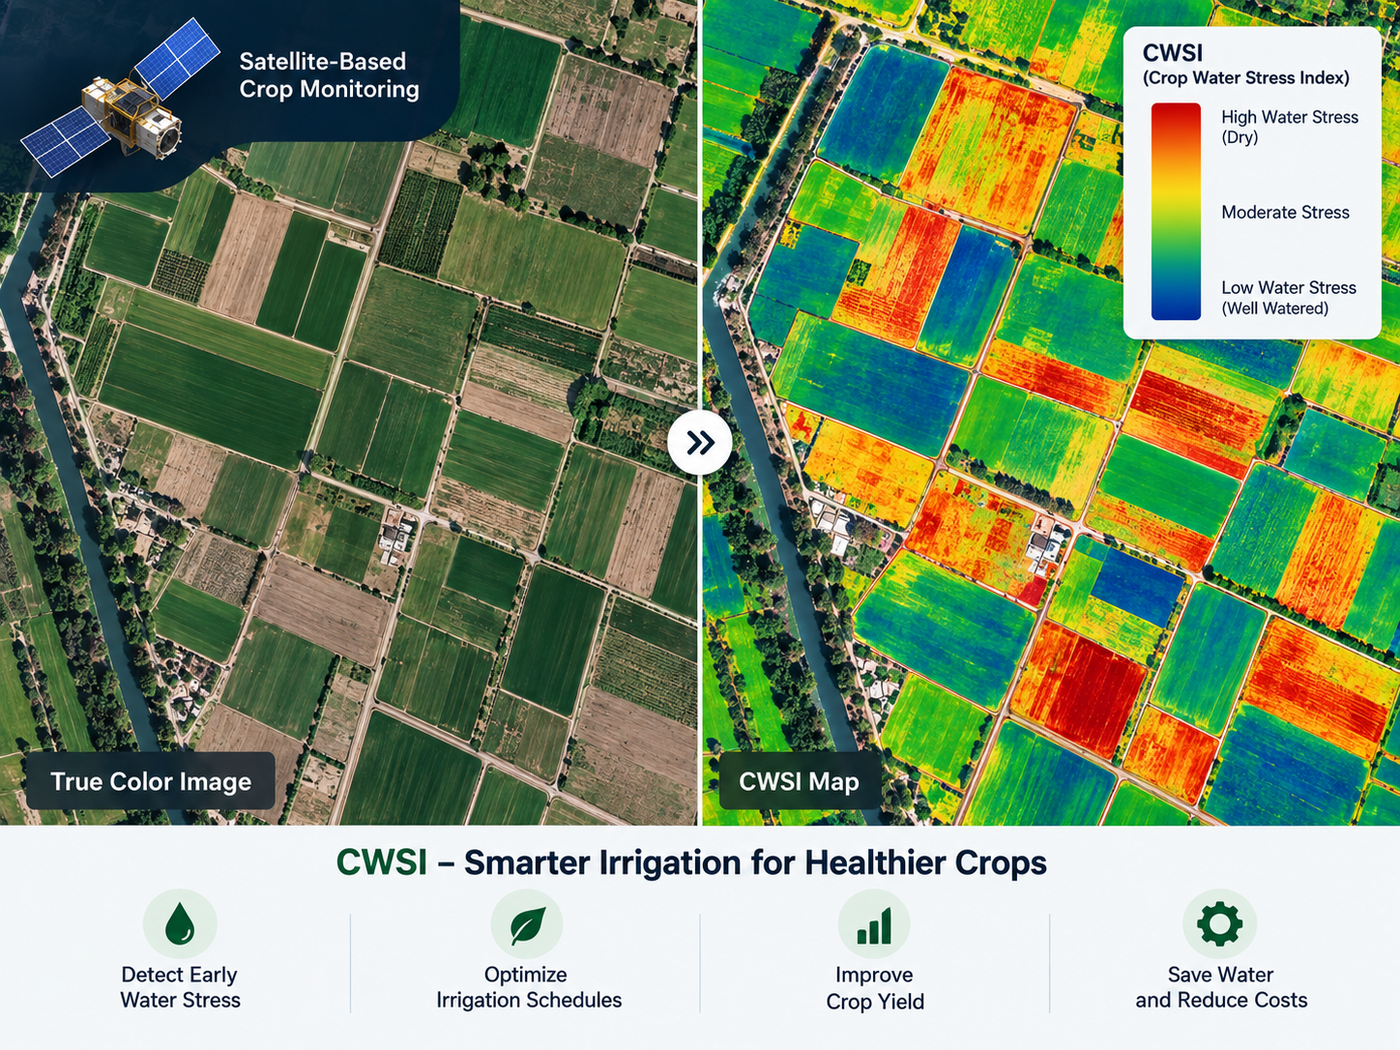
- CWSI, Crop Water Stress Index
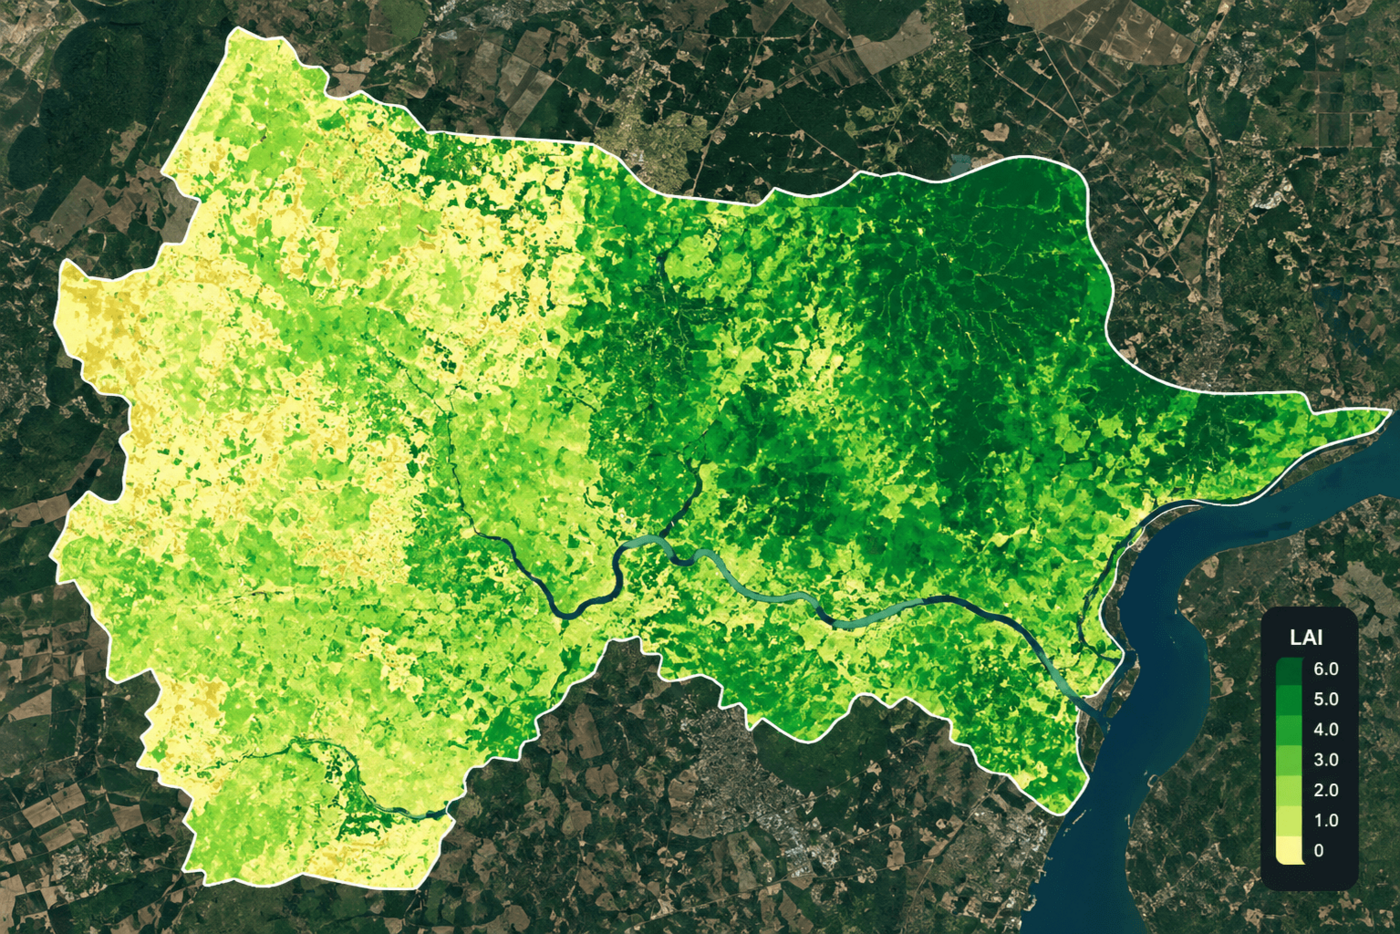
- LAI, Leaf Area Index
- Daily revisit and all-weather coverage keep detection current
- A real-world early warning example
- Frequently asked questions
- Sources and further reading
By the time a fungal disease or a nutrient deficiency changes the color of a leaf, it has already been damaging the plant for days. Satellite-based stress detection works earlier in that timeline, reading wavelengths the human eye cannot see at all rather than waiting for visible discoloration. The bands and indices below are what makes that possible, and what separates a general growth check from a targeted stress or disease diagnosis.
Quick answer
Satellite imagery detects crop stress and disease by measuring wavelengths beyond visible light, mainly the red edge, yellow, and near-infrared bands, and converting them into diagnostic indices such as NDRE, CWSI, LAI, NNI, and CCCI. These indices flag chlorophyll loss, water deficit, and canopy thinning days to weeks before a plant shows visible symptoms. AI models trained on multi-temporal, multi-band imagery classify the specific risk, disease, pest, or nutrient deficiency, at better than 90% accuracy in tested deployments, while daily-revisit optical constellations and all-weather SAR keep that detection running through cloud cover and monsoon seasons.
What counts as crop stress versus crop disease
Crop stress is a broad category, any condition, water deficit, nutrient deficiency, heat, or pest pressure, that reduces a plant's vigor below what its growth stage should show. Crop disease is a specific cause of stress, a fungal, bacterial, or viral infection with its own spectral signature. Satellite-based detection works because both categories change how a leaf reflects light before either is visible to the eye, which is why the same sensors and indices, tuned differently, are used to screen for stress broadly and then narrow down toward a specific disease. For a full walkthrough of the bacterial, fungal, viral, and nematode causes behind that second category, see our guide to crop disease types, symptoms, and control. Telling that disease signature apart from drought, pest pressure, or a nutrient deficiency in the first place is its own diagnostic problem, covered in full in our guide to diagnosing crop stress in satellite imagery.
How AI models classify pest and disease risk
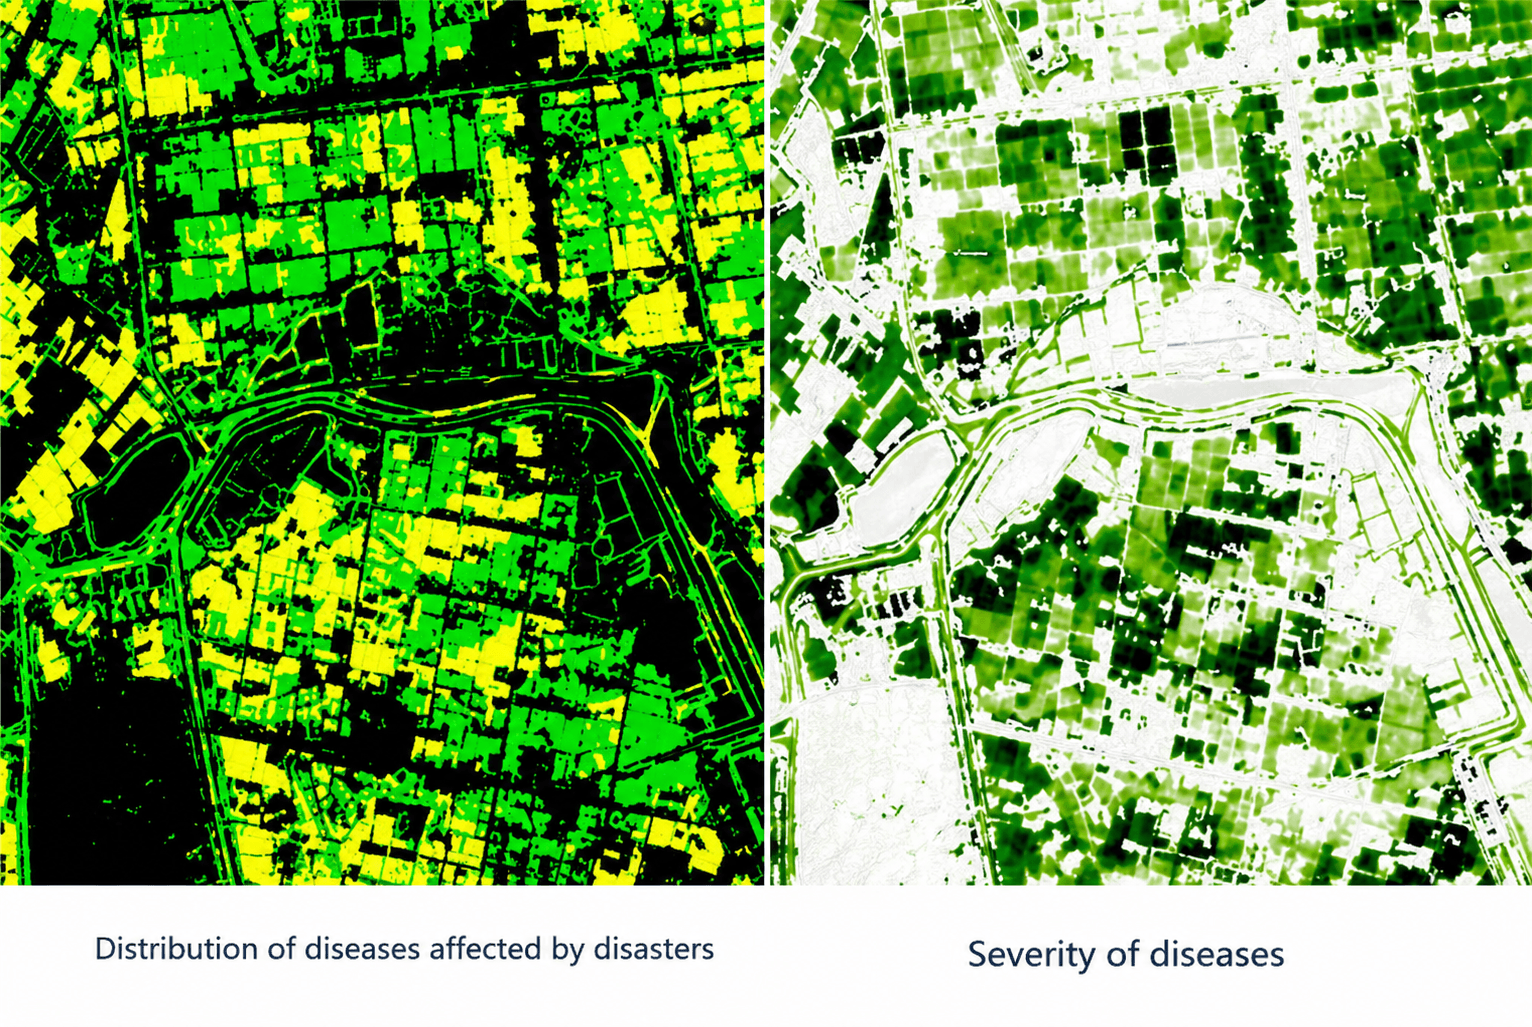
Deep-learning models trained on multi-temporal satellite imagery classify agricultural risk across an entire farming cycle, not just a single date. In tested field scenarios, AI-driven pest and disease classification models exceed 90% accuracy, combining optical greenness, red-edge and yellow-band reflectance, and in more advanced setups, radar backscatter and weather data, to separate a real disease outbreak from a nutrient gap or drought stress that can look similar on a plain vegetation-index map. Current research is also moving from single-index thresholds toward disease-specific spectral indices, such as a red-edge-based index built specifically for wheat yellow rust, and toward multimodal models that fuse satellite bands with weather and ground-sensor data rather than reading spectral bands alone.
The spectral bands that reveal stress before it is visible
Standard true-color imagery uses red, green, and blue, the same three bands a camera or the human eye already sees. Stress and disease detection needs bands beyond that range, each tuned to a different physical change inside a stressed leaf.
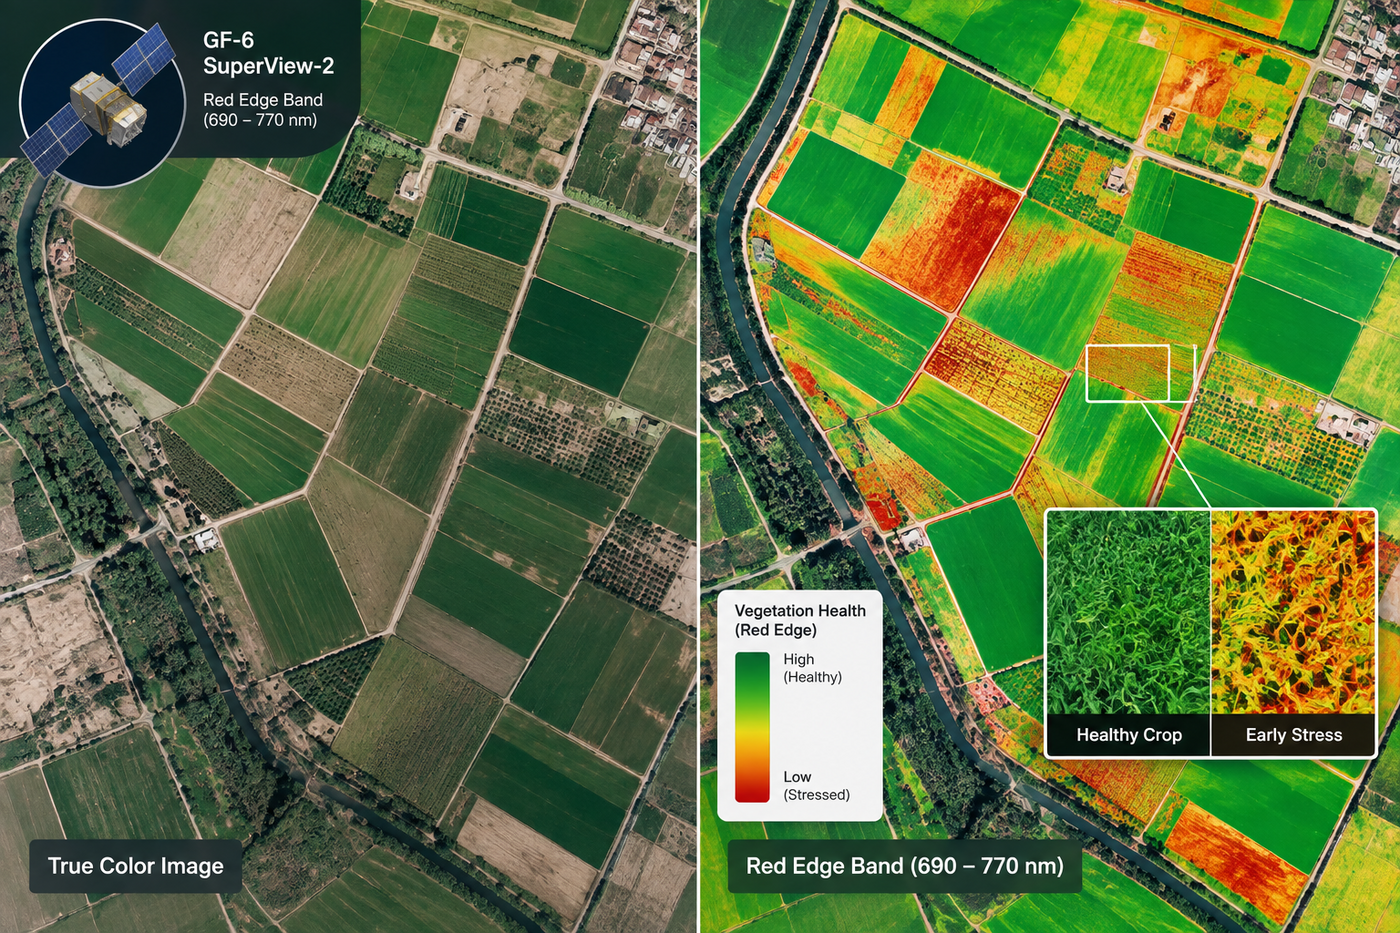
Red Edge (690 to 770 nm)
Carried by satellites such as GF-6 and SuperView-2, this band sits at the exact transition zone where chlorophyll absorption drops off. It reads changes in leaf cell structure and pigment concentration days before a leaf visibly discolors.
Yellow Band (590 to 630 nm)
Captured by 1+8 band multispectral sensors like SuperView-2, this band is tuned specifically to flag early crop stress, mineral imbalance, and foliage abnormality, a distinct signal from the general vigor NDVI already tracks.
Near-Infrared, NIR1 and NIR2
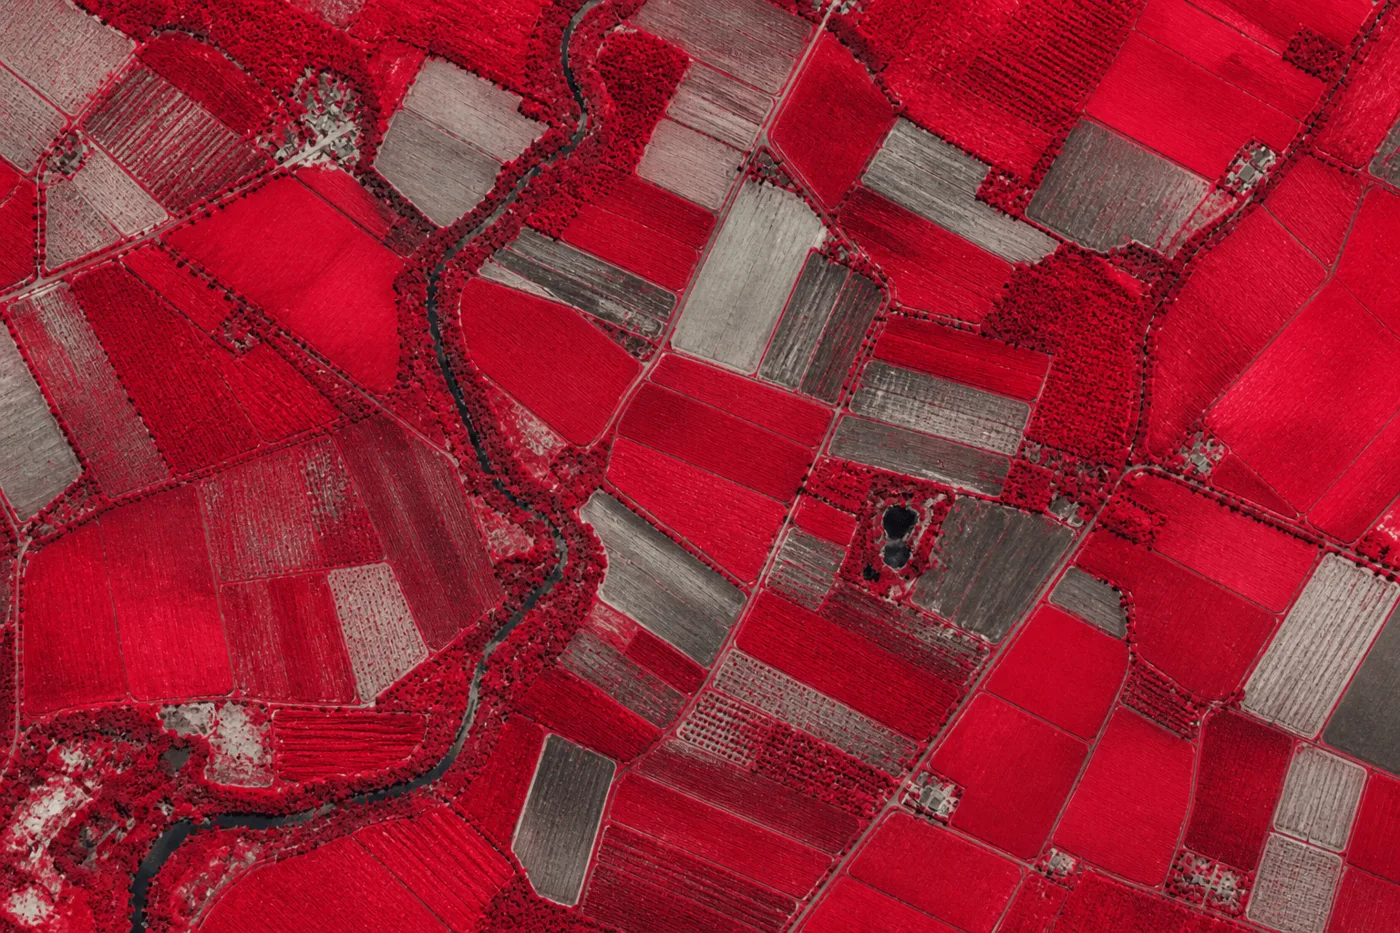
Two separate near-infrared channels measure general plant vigor, leaf density, canopy water content, and green biomass, the baseline every red-edge and yellow-band comparison is measured against.
| Band | Wavelength range | What it reveals |
|---|---|---|
| Red Edge | 690 to 770 nm | Early chlorophyll and leaf cell-structure stress, before visible discoloration |
| Yellow | 590 to 630 nm | Early crop stress, mineral imbalance, and foliage abnormality |
| Near-Infrared (NIR1 / NIR2) | Two channels beyond 770 nm | Plant vigor, leaf density, canopy water content, and biomass |
| Thermal | Long-wave infrared | Canopy temperature and water stress, covered in our guide to how satellite imagery monitors crop growth |
| SAR (radar) | Microwave | All-weather canopy structure and moisture, unaffected by cloud cover |
Need this over your own fields?
Search live multispectral and SAR archive, or task a fresh capture timed to a suspected outbreak. See our agriculture satellite imagery services for coverage and delivery formats.
The vegetation indices used to diagnose crop stress
A spectral band is a raw measurement. An index is what turns that measurement into a diagnosis, usually by comparing two bands against each other so lighting and soil-background differences cancel out.
CWSI, Crop Water Stress Index
Built from canopy-temperature data, CWSI separates dehydrating zones from well-watered ones, flagging where irrigation is actually needed before wilting sets in.
LAI, Leaf Area Index
LAI measures total leaf surface area per unit of ground, tracking canopy development and flagging zones where a thin canopy signals poor establishment or disease-driven leaf loss.
NDRE = (NIR minus Red Edge) divided by (NIR plus Red Edge), the primary index for stress detection once a canopy has closed and standard NDVI has saturated
NDRE is the default stress-detection index for a dense, closed canopy, because it stays sensitive to chlorophyll changes well past the point where NDVI has plateaued. NDVI itself is still useful earlier in the season for general growth and biomass tracking, covered in full in our guide to how satellite imagery monitors crop growth.
| Index | Full name | What it flags |
|---|---|---|
| NDRE | Normalized Difference Red Edge | Early nitrogen stress and disease in a dense, closed canopy |
| CWSI | Crop Water Stress Index | Dehydration risk and irrigation timing |
| LAI | Leaf Area Index | Canopy density and development stage |
| NNI | Nitrogen Nutrition Index | Fertilizer prescription accuracy |
| CCCI | Canopy Chlorophyll Content Index | Nitrogen stress independent of canopy density |
| NDVI | Normalized Difference Vegetation Index | General biomass and growth-stage tracking |
Daily revisit and all-weather coverage keep detection current

A disease-detection program is only as good as its worst week of coverage. High-resolution optical constellations such as SuperView Neo-1, at 0.3 m resolution with daily revisit, supply fresh imagery through the growing season, and all-weather SAR fills the gap during cloudy or monsoon-prone stretches when optical satellites cannot capture anything usable. Running both together is what keeps a disease-risk model fed with data through the exact conditions, humid, overcast, wet-season weather, that also favor fungal and bacterial outbreaks.
A real-world early warning example
Across China's major wheat-growing belt, multi-temporal satellite imagery and AI models flagged drought stress, disease outbreaks, and nutrient deficiencies early enough for growers and local authorities to apply targeted irrigation and localized treatment rather than a blanket response. The same monitoring program's yield-forecasting results are covered in our guide to precision agriculture with satellite imagery.
Stress and disease detection by the numbers
Red edge wavelength range, tuned to the exact chlorophyll transition zone stressed leaves change first.
Reported accuracy of AI-driven pest and disease classification models in tested field scenarios.
Native resolution and revisit cadence of SuperView Neo-1 class optical constellations.
Typical lead time red-edge and yellow-band stress signals give before symptoms are visible on the ground.
Key takeaways
- Red edge and yellow bands reveal cell-structure and pigment stress before any visible color change reaches the leaf surface.
- NDRE, not NDVI, is the right index for stress detection once a canopy has closed and NDVI has saturated.
- CWSI and LAI diagnose two different problems, water stress from canopy temperature and canopy density from leaf area, not the same signal read twice.
- AI classification models trained on multi-band, multi-temporal imagery flag disease and pest risk at better than 90% accuracy in tested deployments.
- Daily-revisit optical constellations paired with all-weather SAR keep detection running through the cloudy, humid conditions that also favor disease outbreaks.
Frequently asked questions
What is crop stress detection using satellite imagery?
It is the use of spectral bands beyond visible light, mainly red edge, yellow, and near-infrared, to measure changes inside a plant's leaves that happen before any visible symptom appears. Software converts those readings into indices like NDRE and CWSI to flag exactly which zones of a field need attention.
How does satellite imagery detect crop disease before symptoms appear?
Disease damages chlorophyll and internal leaf structure before it changes a leaf's visible color. The red edge band is tuned to that exact transition, so an NDRE map built from it shows a stress signal days to weeks ahead of a symptom a ground scout could see.
What is the red edge band and why does it matter for crop stress?
The red edge band, 690 to 770 nm, sits at the wavelength where healthy chlorophyll absorption drops off sharply. Stressed or diseased leaves shift that transition point, which is why red edge based indices like NDRE catch problems earlier than standard NDVI.
What does the yellow band show in agriculture satellite imagery?
The yellow band, 590 to 630 nm, available on 1+8 band multispectral sensors, is tuned specifically to detect early crop stress, mineral imbalances, and foliage abnormalities, a signal distinct from the general vigor that NDVI already tracks.
What is CWSI and how does it detect water stress?
The Crop Water Stress Index uses canopy-temperature data, since a water-stressed plant closes its stomata and loses evaporative cooling, which raises leaf temperature. CWSI turns that temperature difference into a map of which zones are dehydrating before wilting sets in.
What is LAI and what does it measure?
The Leaf Area Index measures total leaf surface area per unit of ground area. It tracks canopy development through the season and flags zones with a thinner canopy than expected, which can signal poor establishment, drought, or disease-driven leaf loss.
How accurate is AI-based crop disease detection from satellite data?
AI models trained on multi-temporal, multi-band satellite imagery report better than 90% accuracy for pest and disease classification in tested field deployments, though results vary by crop, disease, and how much ground-truth data trained the model.
Can satellite imagery detect crop stress through clouds?
Optical sensors carrying the red edge, yellow, and near-infrared bands cannot see through cloud cover. All-weather SAR radar fills that gap, imaging canopy structure and moisture regardless of cloud, rain, or darkness, which matters most during the humid, overcast conditions that also favor disease outbreaks.
Does satellite-based stress detection replace field scouting?
No. Satellite data screens an entire farm or region and narrows down which specific zones need a closer look. A scout or agronomist still confirms the exact cause, disease, pest, or nutrient deficiency, in the flagged area before treatment.
Sources and further reading
- China Siwei and 21AT: GF-6, SuperView-2, and SuperView Neo satellite and sensor specifications
- ESA Copernicus: Sentinel-1 (SAR) and Sentinel-2 (multispectral) mission specifications
- Peer-reviewed remote-sensing literature on red-edge disease indices and multi-temporal crop stress classification
- Industry deployment reports on AI-based pest and disease classification accuracy
Ready to screen your fields for stress and disease?
Search our live archive or request new tasking over your area, optical, multispectral, or SAR. No account needed to get a first estimate.