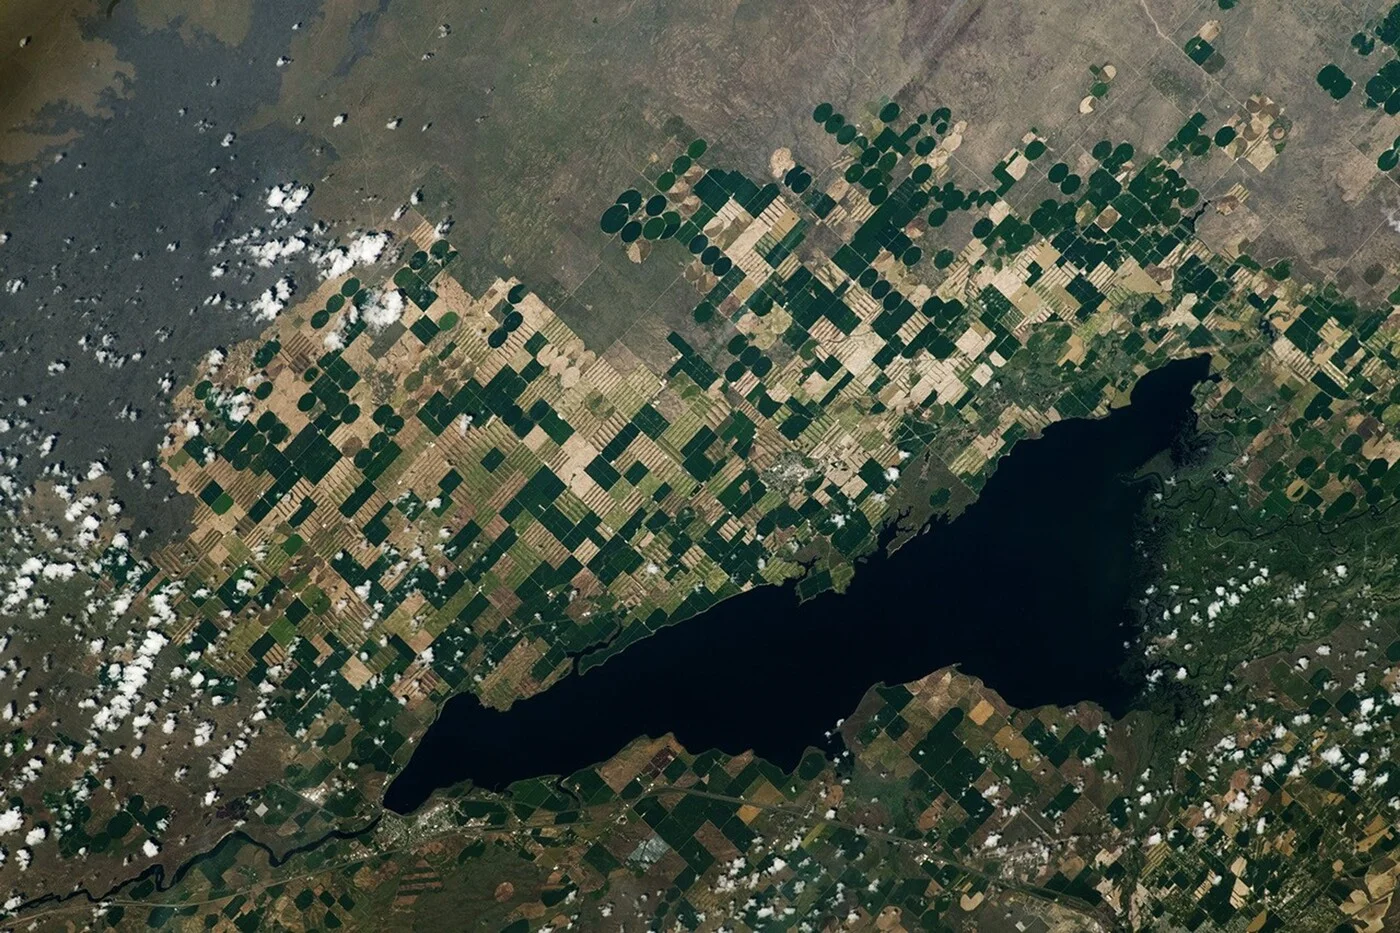
How Satellite Imagery Monitors Crop Growth
On this page
- How satellite imagery follows a crop from planting to harvest
- The growth stages satellite imagery can identify
- 01. Multispectral sensors measure reflected light, not a photograph
- 02. NDVI converts that reflectance into one growth number
- 03. NDRE and red-edge bands catch stress before NDVI does
- 04. Thermal bands add canopy temperature to the picture
- 05. Radar tracks canopy structure through cloud and darkness
- 06. AI models turn the pixel data into a classification, not just a color map
- What growth tracking feeds into once the season is underway
- New sensors improving crop growth monitoring for 2027
- Frequently asked questions
- Sources and further reading
A single satellite image only shows a field on one day. Growth monitoring comes from stacking repeat images of that same field into a record, then reading how the record compares to what a healthy crop should look like at that point in the season. That comparison is what separates a field on pace from one quietly falling behind, often weeks before the gap is visible from the ground. What follows breaks down the specific growth stages a satellite record can identify and the sensors and models behind each one.
Quick answer
Satellite imagery monitors crop growth through repeat passes over the same field, multispectral sensors that measure red and near-infrared reflectance, and vegetation indices such as NDVI and NDRE that convert those readings into a growth-stage and health score. Thermal sensors add canopy-temperature data for water stress, radar sensors add all-weather structure and moisture data, and AI models turn the combined data into automated crop classification, stress alerts, and yield forecasts. A field is typically imaged anywhere from daily to every 3 to 5 days, depending on the satellite, letting growers track emergence, canopy closure, flowering, and maturity as they happen rather than waiting for a scouting visit.
How satellite imagery follows a crop from planting to harvest
A single satellite image is a snapshot. Crop growth monitoring comes from stacking many snapshots of the same field, taken days or weeks apart, into a time series. Constellations built for agriculture revisit the same location on a fixed schedule, daily for the highest-resolution commercial satellites, every 3 to 5 days for open-access Sentinel-2, and every 12 days for the radar-based NISAR mission. Plotting a vegetation index like NDVI against each capture date produces a curve that rises during emergence and vegetative growth, plateaus at peak canopy, and falls again as the crop matures and dries down. That curve, not any single image, is what agronomists actually read.

The growth stages satellite imagery can identify
Agronomists call this phenology, the timing of a crop's life-cycle stages, and satellite time series map it directly onto the shape of the NDVI curve.
- Emergence and establishment. NDVI starts low, close to bare-soil values, and climbs as seedlings fill in the row. A slow or uneven rise here flags poor germination or replant zones.
- Vegetative growth. NDVI climbs steeply as leaf area and canopy cover expand. This is the window where nitrogen deficiency and early weed pressure show up as zones lagging the field average.
- Peak canopy and flowering. NDVI plateaus, typically between 0.75 and 0.90 for a dense, healthy crop, because the index saturates once the canopy fully closes. NDRE, which does not saturate as early, becomes the more useful index from this point on.
- Grain fill and maturity. NDVI holds near its peak, then begins a controlled decline as lower leaves senesce and the plant redirects energy into grain or fruit.
- Senescence and harvest readiness. NDVI drops sharply as chlorophyll breaks down across the canopy. Comparing the rate of that drop against the crop's accumulated growing-degree days is a standard way to time harvest.
Six things happen behind that curve, from the physics of reflected light to the AI models that turn a pixel value into a decision.
01. Multispectral sensors measure reflected light, not a photograph
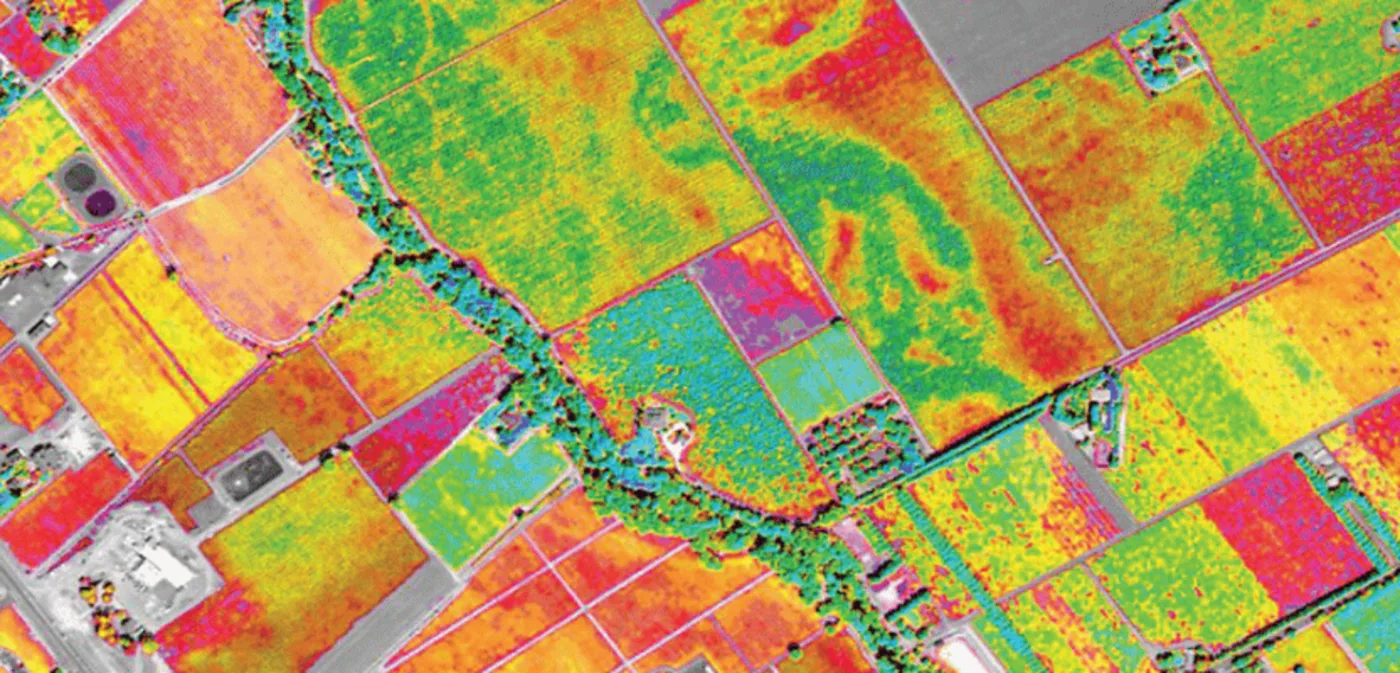
A crop-monitoring satellite is not taking pictures in the everyday sense. Its sensor records how much energy bounces back at specific wavelength bands, typically blue, green, red, and near-infrared, sometimes red edge and short-wave infrared as well. Chlorophyll in a healthy leaf absorbs most red light for photosynthesis and scatters near-infrared light back out through the leaf's internal cell structure. A stressed, diseased, or dying leaf absorbs less red and reflects less near-infrared, which is the physical signal every vegetation index is built on.
02. NDVI converts that reflectance into one growth number
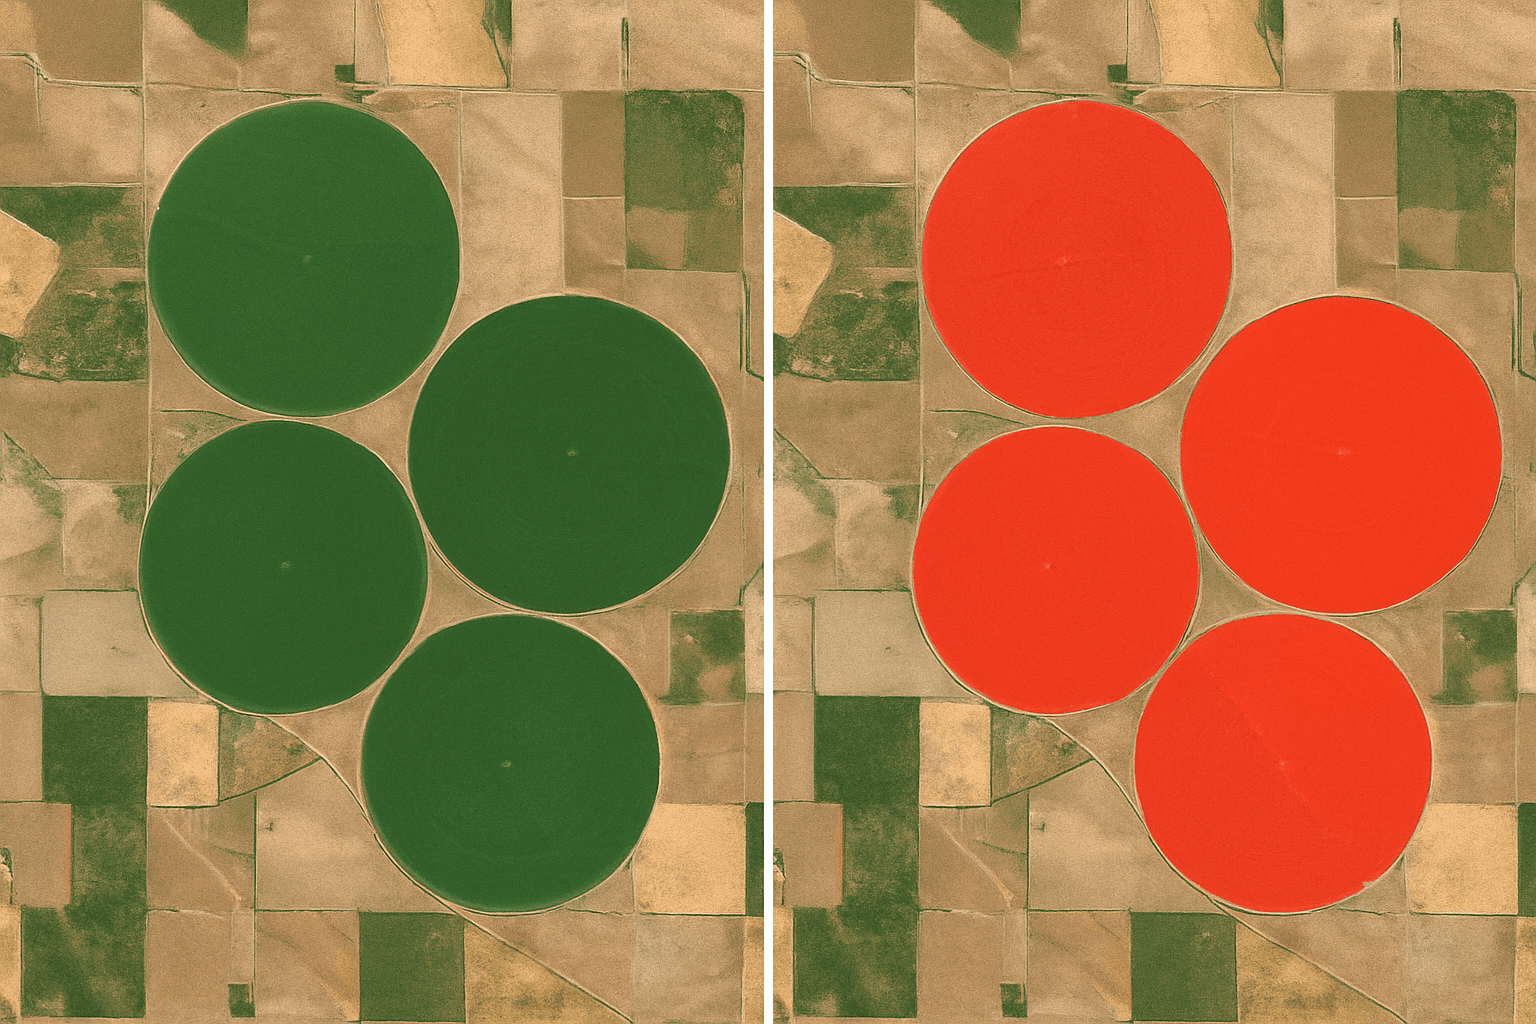
NDVI = (NIR minus Red) divided by (NIR plus Red), scored from -1 to 1, with dense healthy canopy scoring 0.75 to 0.90
Because the formula only needs red and near-infrared bands, NDVI can be generated from almost any optical satellite in orbit, which is why it remains the default first check for field-wide growth tracking before a more specific index gets involved.
03. NDRE and red-edge bands catch stress before NDVI does
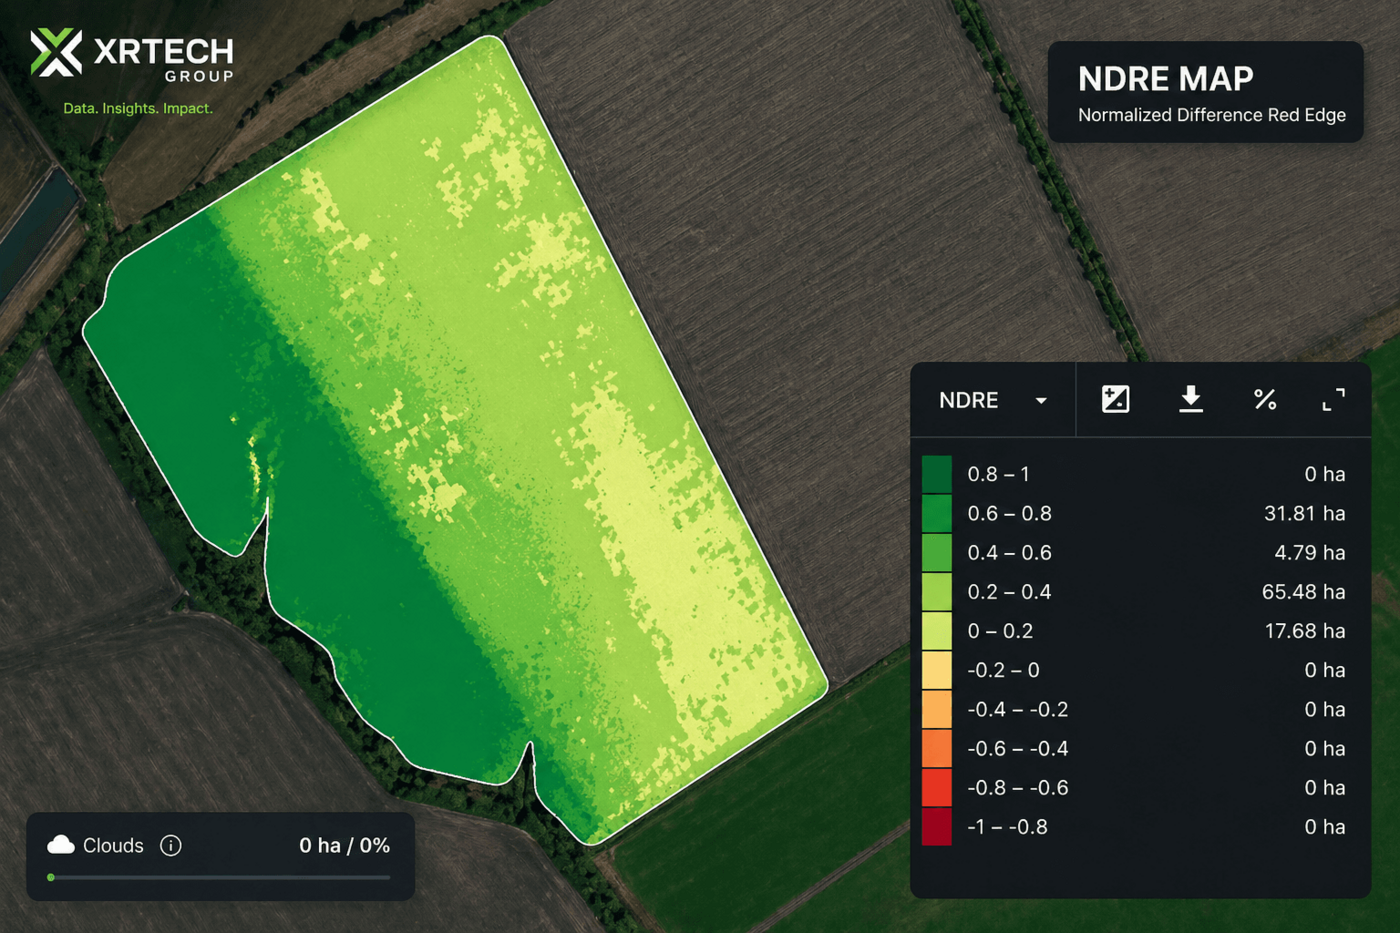
NDVI saturates once canopy cover is complete, so a nitrogen-deficient or disease-stressed crop can still return a high NDVI reading mid-season. NDRE substitutes the red-edge band for red and stays sensitive to chlorophyll changes well past the point where NDVI has plateaued, which is why it is the index agronomists switch to for in-season nitrogen and disease checks rather than early-season growth tracking. For the fuller vegetation and soil index library, including SAVI, CWSI, LAI, and NNI, see our guide to precision agriculture with satellite imagery.
04. Thermal bands add canopy temperature to the picture
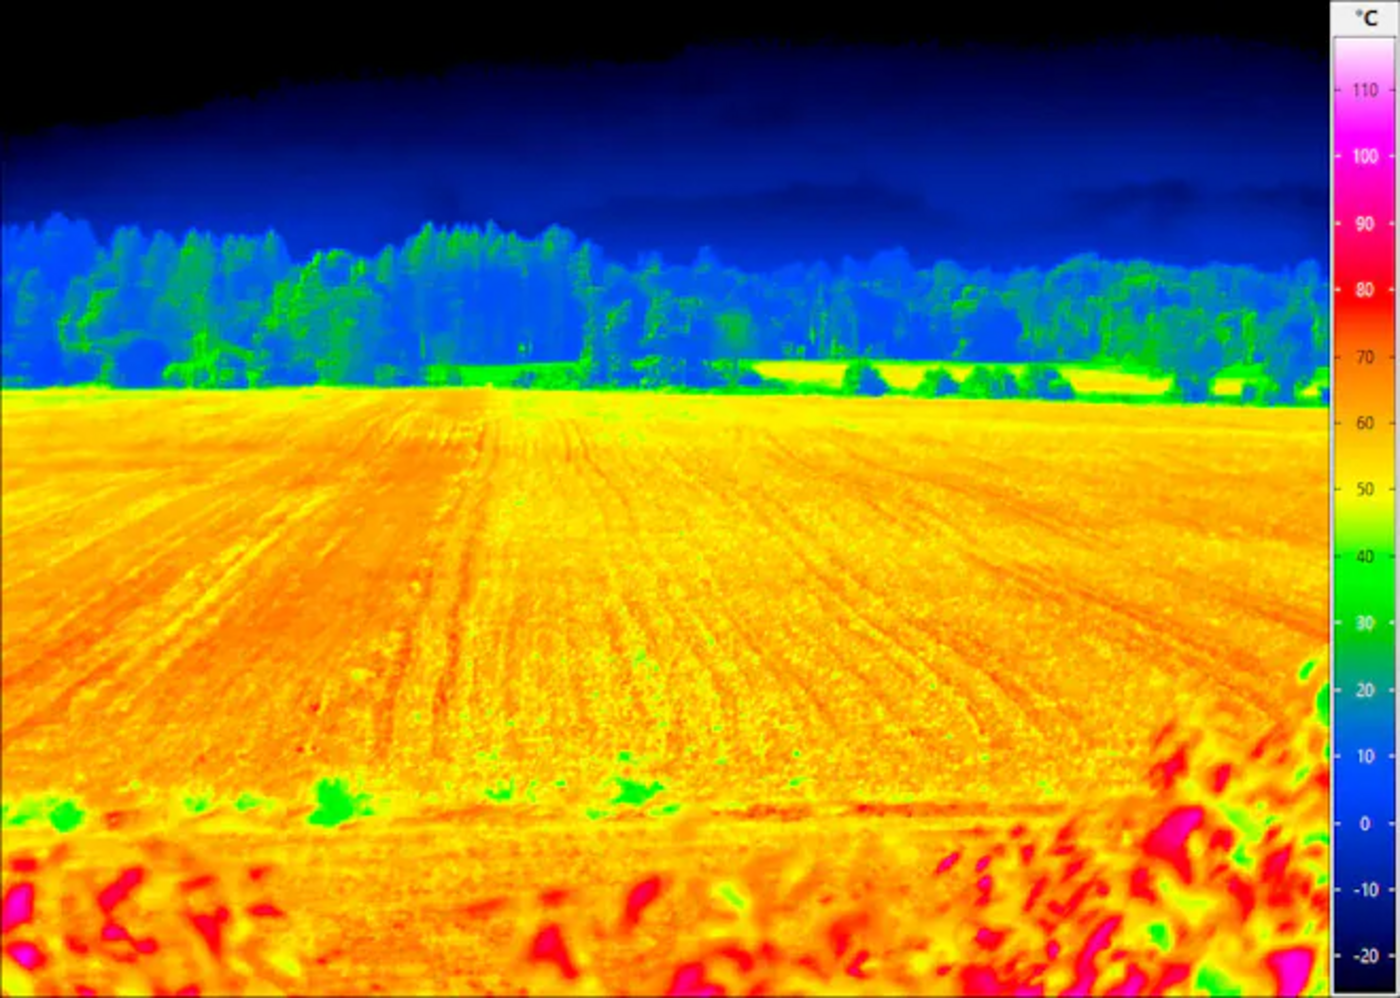
A water-stressed plant closes its stomata to conserve moisture, which stops evaporative cooling and raises leaf temperature above a well-watered plant nearby. Landsat's thermal band and dedicated thermal sensors turn that temperature difference into the Crop Water Stress Index, which explains why a field's growth curve is flattening even when its NDVI still looks acceptable.
05. Radar tracks canopy structure through cloud and darkness
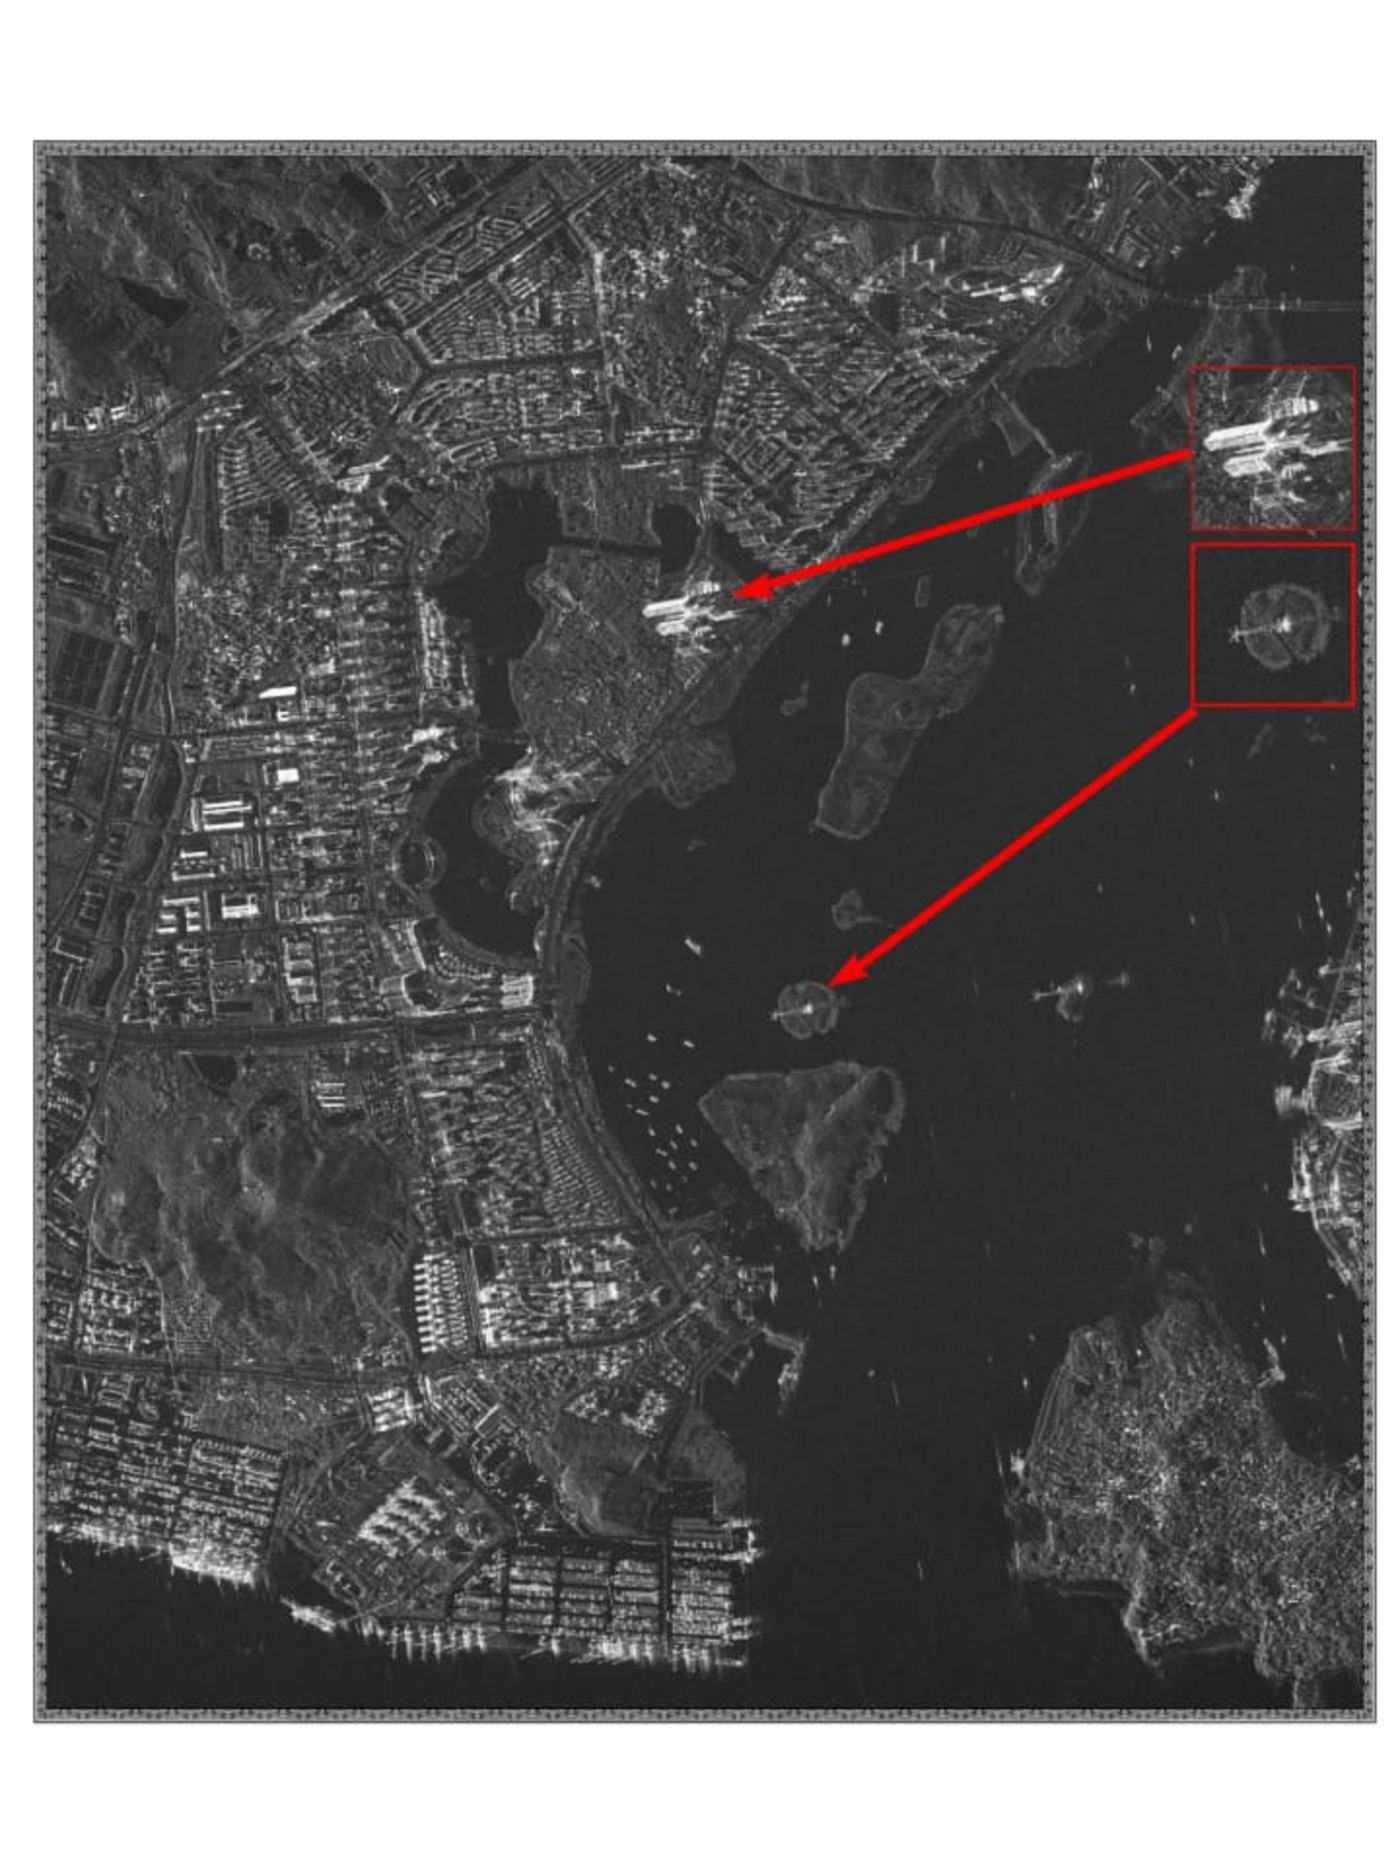
Optical sensors go blind under cloud cover, which is a real gap during a wet-season growth window. Radar, or SAR, satellites transmit their own microwave signal and read what bounces back, so they keep imaging regardless of cloud, rain, or time of day. Sentinel-1's C-band SAR already does this on a near-daily basis for soil moisture and canopy structure. NASA and ISRO's NISAR mission, now operating with a dual L-band and S-band radar and a 12-day global revisit, adds a second frequency tuned to see deeper into a canopy, which is expected to sharpen radar-based growth and biomass tracking through 2027 as its data becomes standard in more monitoring platforms.
06. AI models turn the pixel data into a classification, not just a color map
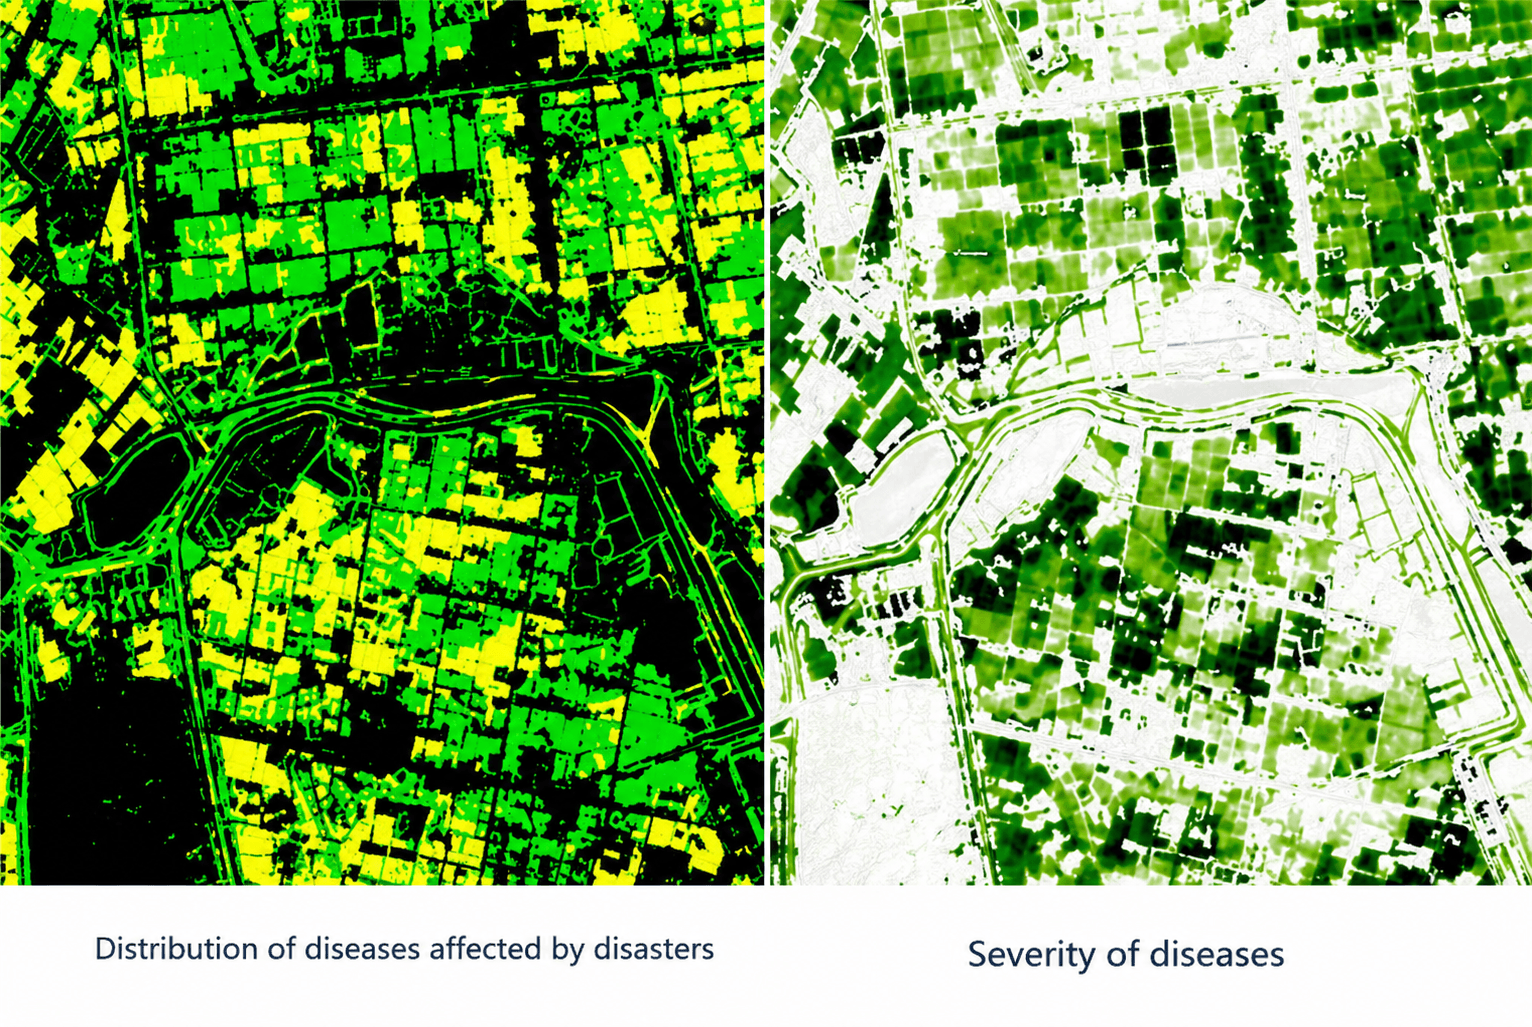
Deep-learning models trained on multi-season, multi-satellite imagery now classify crop type and flag non-grain land-use changes at better than 90% accuracy, and separate disease-diagnosis models combining optical greenness, radar backscatter, and weather data identify disease presence and severity at a similar accuracy in tested scenarios. Run across a growing season instead of a single date, the same pipeline is what turns a raw time series into an automated stress alert instead of a map a human still has to interpret.
Need this running on your own fields?
Search live optical, multispectral, and SAR archive over your farm, or task a fresh capture timed to a specific growth stage. See our agriculture satellite imagery services for pricing and delivery formats.
What growth tracking feeds into once the season is underway
A growth curve is not the end product, it is the input to a decision. Comparing a field's current NDVI trend against its own multi-season history separates a real anomaly from normal variation. Combining that trend with soil-moisture readings points to whether a lagging zone needs water, nitrogen, or pest treatment. Feeding the same growth-stage and biomass data into a yield model, alongside ground-truth measurements, produces county-level yield estimates that reach roughly 85% accuracy well before harvest. Each of these is a deeper topic on its own, covered in full in our guide to precision agriculture with satellite imagery.

Growth monitoring by the numbers
Typical NDVI range at peak canopy for a dense, healthy crop, before the index saturates.
Global revisit of NASA and ISRO's dual-frequency NISAR radar mission, tracking crop structure through cloud and darkness.
Reported accuracy of AI-based crop-type and land-use classification models trained on multi-satellite time series.
County-level yield estimation accuracy from models combining satellite growth tracking with ground-truth data.
New sensors improving crop growth monitoring for 2027
Two changes are pushing growth monitoring past what a single optical satellite alone can do. First, NISAR's dual L-band and S-band radar gives growth tracking an all-weather structural signal that goes deeper into a canopy than Sentinel-1's single C-band, useful for taller or denser crops where surface-only radar underestimates biomass. Second, expanded band configurations, such as 1+8 band optical sensors adding yellow, red edge, and two separate near-infrared channels, plus genuinely hyperspectral sensors capturing hundreds of narrow bands, are moving specialized indices like CWSI, LAI, and NNI from research tools into commercially available products. Neither replaces NDVI as the everyday check, but both close gaps NDVI alone has always had, cloud cover for one, and saturation at peak canopy for the other.
Key takeaways
- Crop growth monitoring reads a time series of vegetation-index values, not any single satellite image.
- NDVI tracks overall canopy growth well until peak canopy, where it saturates around 0.75 to 0.90 and NDRE takes over for stress detection.
- Thermal bands add water-stress data and radar adds all-weather structure data that optical sensors cannot capture on their own.
- NASA and ISRO's NISAR mission adds dual-frequency radar with a 12-day global revisit, sharpening structural growth tracking into 2027.
- AI classification models built on multi-season time series now flag crop type, land-use change, and disease risk at better than 90% accuracy.
Frequently asked questions
How does satellite imagery track crop growth stages?
By comparing a vegetation index like NDVI across repeat satellite passes over the same field. The index rises during emergence and vegetative growth, plateaus at peak canopy, then falls as the crop matures, and each part of that curve corresponds to a specific growth stage.
What does NDVI actually show about crop growth?
NDVI compares red and near-infrared reflectance to score vegetation density and vigor from -1 to 1. Bare soil scores near 0, and dense, healthy canopy typically scores between 0.75 and 0.90 at its peak.
Can satellite imagery detect crop stress before it is visible on the ground?
Yes. Red-edge based indices like NDRE, and thermal readings that flag rising canopy temperature, both change before a nutrient deficiency, disease, or water stress becomes visible to the eye, often by a week or more.
What is the difference between NDVI and NDRE for tracking growth?
NDVI uses red and near-infrared light and works well from emergence through early canopy closure, then saturates once the canopy is dense. NDRE substitutes the red-edge band for red and stays sensitive to chlorophyll changes after NDVI has plateaued, making it the better choice for mid- and late-season stress checks.
How often is satellite imagery updated during the growing season?
It depends on the satellite. Commercial very-high-resolution constellations can revisit daily, open-access Sentinel-2 revisits every 3 to 5 days, and the NISAR radar mission revisits globally every 12 days. Growth-curve tracking works with any of these cadences, though faster revisit catches shorter-lived issues sooner.
Can radar satellites monitor crop growth through clouds?
Yes. Radar satellites such as Sentinel-1 and NISAR transmit their own microwave signal instead of relying on sunlight, so they continue imaging canopy structure and soil moisture through cloud cover, rain, and darkness, which optical satellites cannot do.
How accurate is satellite-based crop growth monitoring?
AI-based crop-type and land-use classification built on multi-satellite time series now exceeds 90% accuracy in commercial deployments, and yield models that combine growth-stage tracking with ground-truth data reach roughly 85% accuracy at the county level.
What new satellites are improving crop growth monitoring for 2027?
NASA and ISRO's NISAR mission adds dual L-band and S-band radar with a 12-day global revisit, giving growth tracking a deeper structural signal than single-frequency radar. Expanded multispectral band sets and hyperspectral sensors are also moving specialized indices like CWSI and LAI from research use into standard commercial products.
Does satellite growth monitoring replace in-field crop scouting?
No. Satellite data is the most efficient way to screen an entire farm or region and flag which zones are off their expected growth curve. Ground scouting and drones still confirm the specific cause, disease, pest, nutrient deficiency, or water stress, in the flagged area.
Sources and further reading
- NASA and ISRO: NISAR mission specifications, dual-frequency L-band and S-band radar, 12-day global revisit
- ESA Copernicus: Sentinel-1 (SAR) and Sentinel-2 (multispectral) mission specifications and revisit cadence
- Peer-reviewed remote-sensing literature on NDVI time series and phenology-stage classification accuracy
- China Siwei and 21AT: SuperView Neo, TripleSat, and Beijing-3 series satellite specifications
Ready to track a growing season from orbit?
Search our live archive or request new tasking timed to your crop's next growth stage, optical, multispectral, or SAR. No account needed to get a first estimate.