How to Know if Crop Stress Is Drought, Pests, or More
On this page
- Read the Shape and Speed First
- Specialized Bands That Separate the Causes
- The Right Index for Each Suspect
- Nutrient Deficiency Has Its Own Signature
- Cross-Referencing With Soil Moisture, SAR, and Terrain
- AI Multi-Temporal Classification
- The Ground-Truth Protocol That Confirms It
- Frequently asked questions
- Sources and further reading
A practical guide to diagnosing crop stress in satellite imagery, why a red patch on an NDVI map never explains itself, the spatial patterns and onset speeds that separate drought from pests from disease from nutrient deficiency, the specific bands and indices that isolate each cause, and the ground-truth check that confirms it.
Quick answer
NDVI alone cannot tell you why a field is stressed, only that it is. Diagnosing the cause takes a layered read, the shape and speed of the stress pattern (broad and gradual points to drought, irregular hotspots expanding fast point to pests, geometric zones that repeat every year point to nutrients), then specialized bands and indices that isolate a specific mechanism, Red Edge and NDRE for chlorophyll loss, NDMI for canopy water content, CWSI for canopy temperature, and a Chlorophyll Index or Nitrogen Nutrition Index for fertility. Cross-referencing that spectral read against soil moisture, SAR, a Digital Elevation Model, and weather data rules causes in or out objectively, and a short ground-truth visit to the exact flagged coordinates confirms it before any decision gets made.
Read the Shape and Speed First
Before opening a single index, the geometry and timing of a stress pattern already narrow the list of suspects, the same way a doctor reads a rash's shape before ordering a blood test.
| Signal | Drought or water stress | Pest or disease | Nutrient or soil issue |
|---|---|---|---|
| Spatial pattern | Broad, contiguous, follows topography, sandy soil pockets, or an entire regional boundary | Small, irregular hotspots that expand along rows, field margins, or low micro-climates | Geometric, matches old management zones or fertilizer-pass boundaries |
| Onset speed | Gradual, builds over weeks across a region | Rapid, can balloon within days as a pest generation hatches or a fungus spreads | Static, present early in the season or repeats in the same zones year after year |
The pattern reads differently by crop, too. Wheat rust typically starts as a small orange-flecked hotspot that spreads down-row with the prevailing wind, corn rootworm or armyworm damage tends to expand as roughly circular patches radiating from a hatch site, and rice blast or bacterial blight concentrates in the lowest-lying paddies where standing water sits longest, exactly the pattern a broad drought signature would never produce. A drought signature in wheat instead tracks the sandy ridges and thin-soil knolls visible on a terrain map, and a corn nitrogen deficiency shows up as pale, striped strips that line up precisely with a fertilizer applicator's old pass width.

Specialized Bands That Separate the Causes
Standard true-color imagery only shows damage after a plant has already visibly degraded. The bands below read the plant's internal chemistry before that happens, and each one is sensitive to a different mechanism.
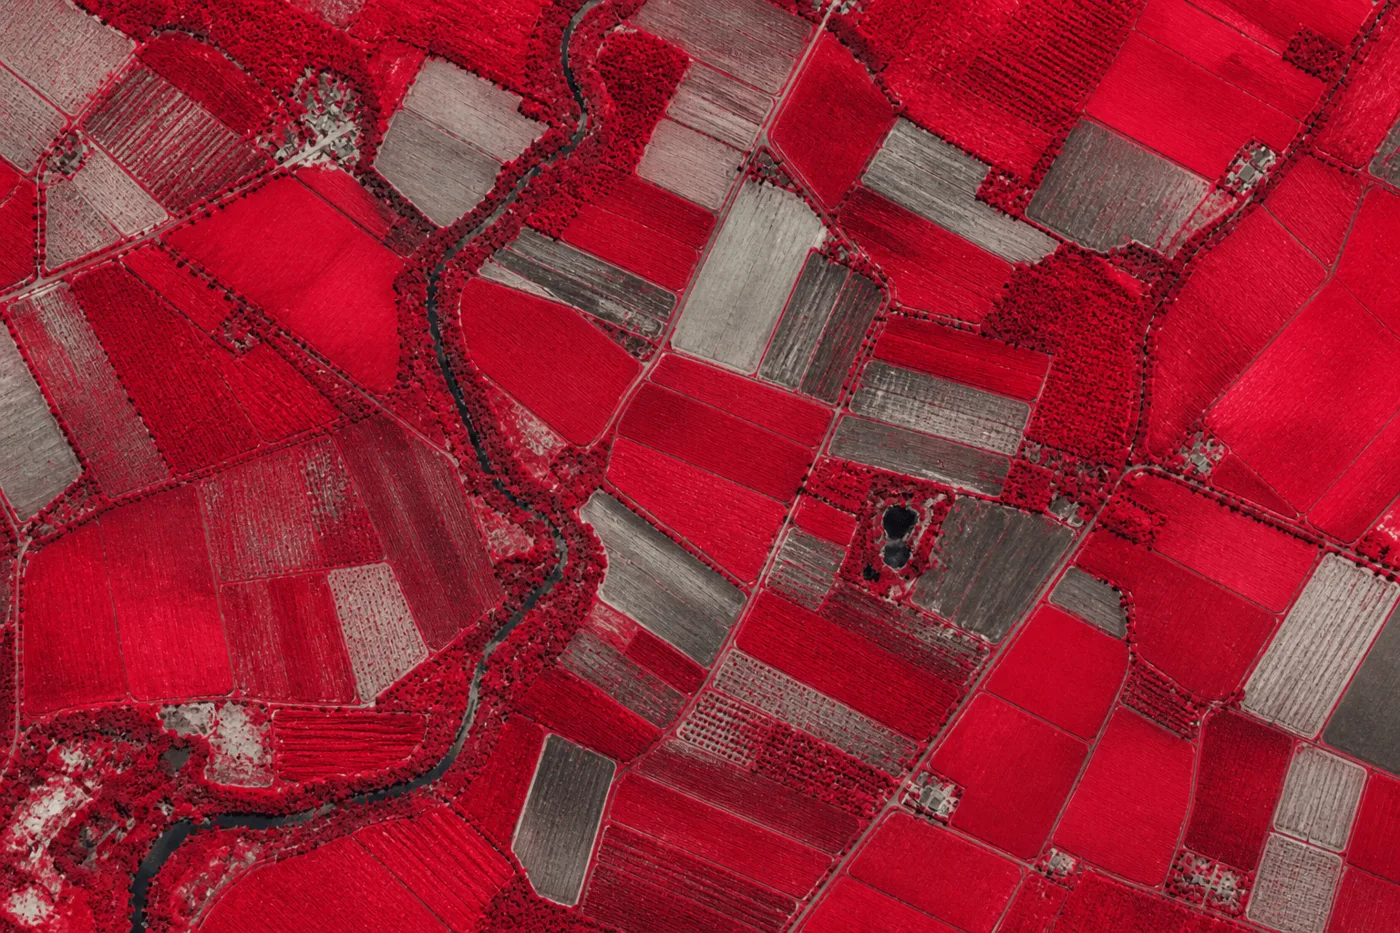
- Red Edge (690 to 770 nm): available on SuperView-2 and GF-6, penetrates the canopy and reads chlorophyll content and leaf cell structure directly. A drop here, days before any visible yellowing, points to disease, viral infection, or a nitrogen shortfall rather than simple water shortage.
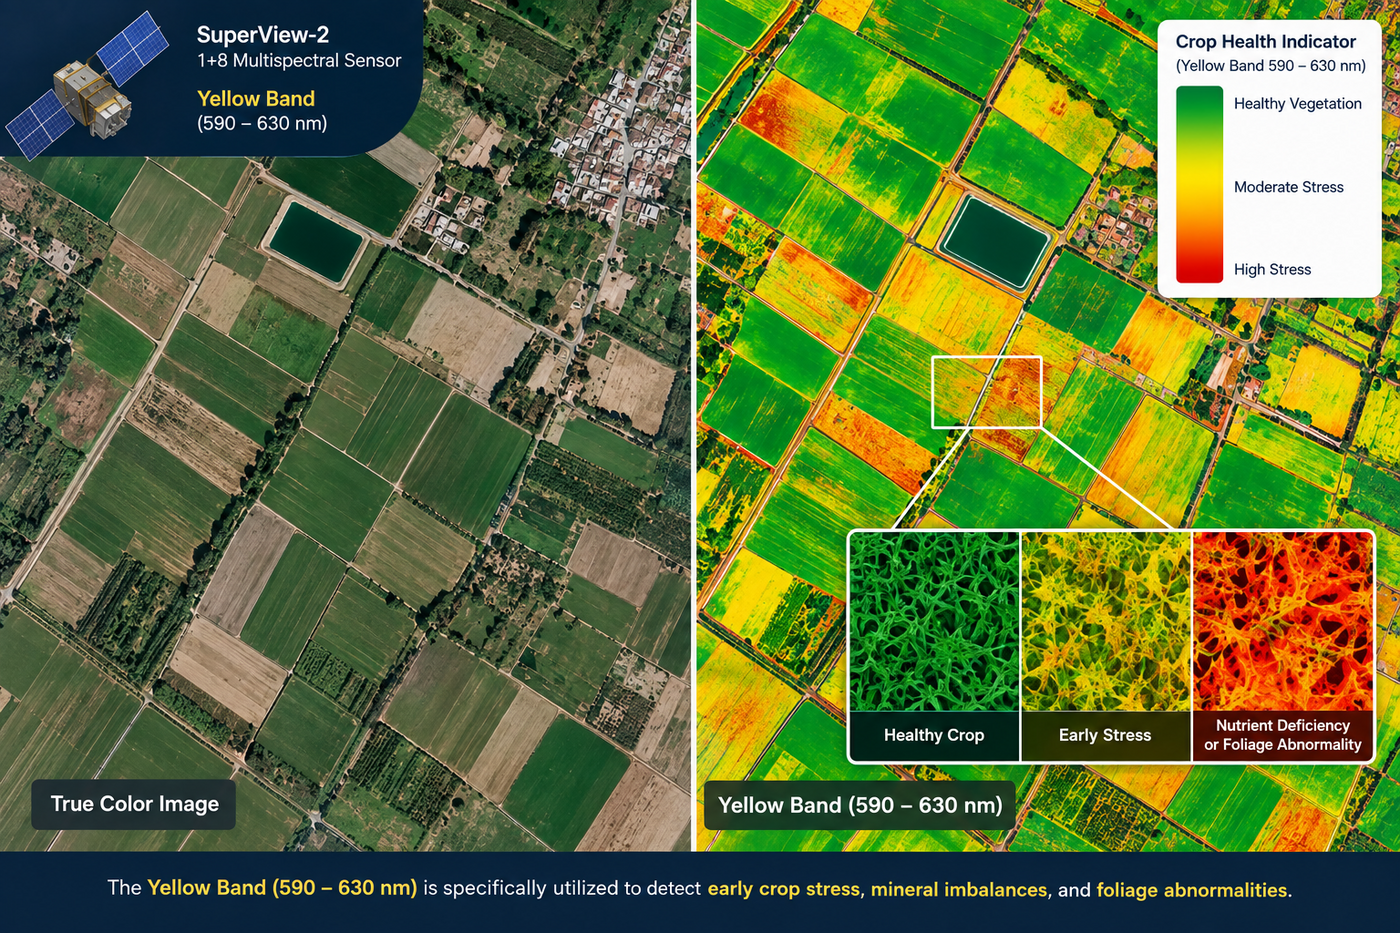
- Yellow (590 to 630 nm): flags early foliage discoloration and mineral imbalance, often the first visible-light band to shift under a nutrient or physiological stress.
- SWIR and thermal bands: capture canopy temperature and reduced evapotranspiration, a direct physical signal of water dehydration rather than a biological one.
- NIR1 and NIR2 (770 to 1040 nm): track overall green biomass, canopy density, and total moisture content, the general-health layer every other band gets compared against.
The Right Index for Each Suspect
A single vegetation index averages away exactly the distinction a diagnosis needs. Pairing indices against each other, not reading one in isolation, is what actually isolates a cause.
- NDVI versus NDRE. Standard NDVI (NIR and Red) measures overall biomass and saturates over a dense, closed canopy. NDRE (NIR and Red Edge) keeps resolving chlorophyll density past that saturation point, which is what makes it the more sensitive flag for an early disease outbreak or nitrogen shortfall in a crop that already looks fully grown.
- NDMI, not NDWI, for canopy moisture. The index that actually measures water inside a leaf is NDMI (Gao, 1996, NIR and SWIR). The similarly-named NDWI (McFeeters, 1996, Green and NIR) was built to delineate open water bodies, not canopy moisture, and some agricultural software labels the NDMI calculation "NDWI" anyway, so check which formula a tool is actually running before trusting the number. If NDVI is dropping but a correctly-calculated NDMI stays high, the cause is very unlikely to be drought.
- Chlorophyll Index (CI). CIgreen (NIR over Green, minus 1) and CIrededge (NIR over Red Edge, minus 1) isolate chlorophyll and nitrogen content specifically, useful for telling a fertility problem apart from early pest damage that has not yet reduced canopy density.
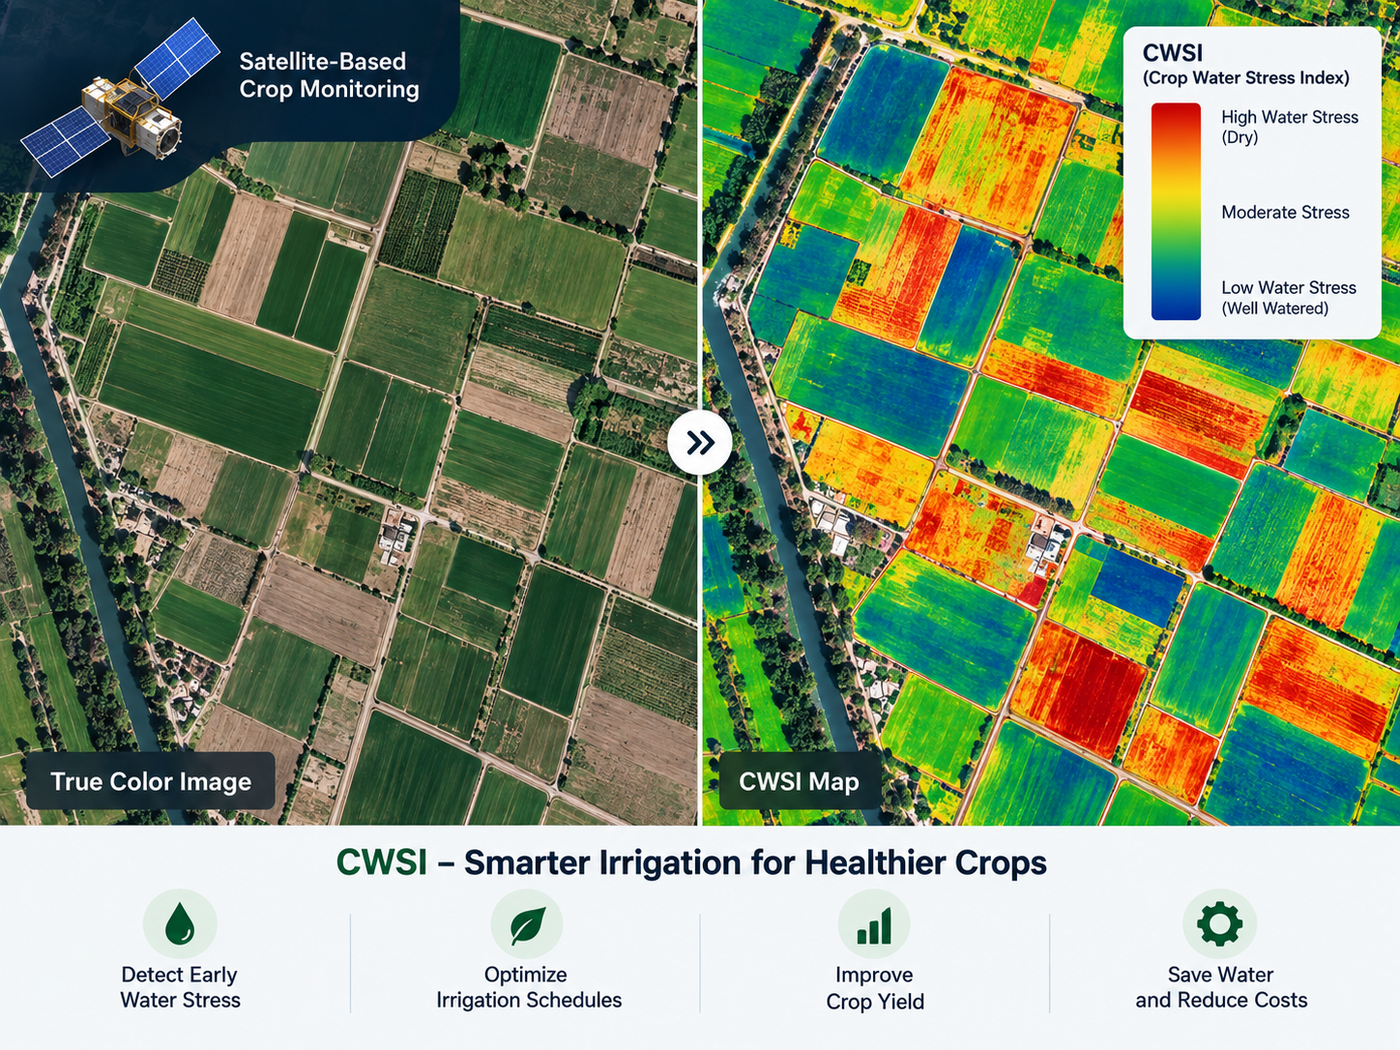
- Crop Water Stress Index (CWSI). Built from canopy-minus-air temperature, normalized between a well-watered baseline and a fully stressed, non-transpiring baseline, CWSI isolates water stress directly from heat rather than from reflectance, since a thirsty plant closes its stomata and its canopy temperature spikes hours to days before its leaves visibly wilt, which is what makes it a drought and irrigation-demand signal specifically, rather than a biotic-damage one.
- Nitrogen Nutrition Index (NNI) and Leaf Area Index (LAI). Together these separate a fertility deficit, low nutrient uptake against a known canopy size, from pest damage, a canopy that is physically smaller because tissue has been eaten or killed.

Nutrient Deficiency Has Its Own Signature
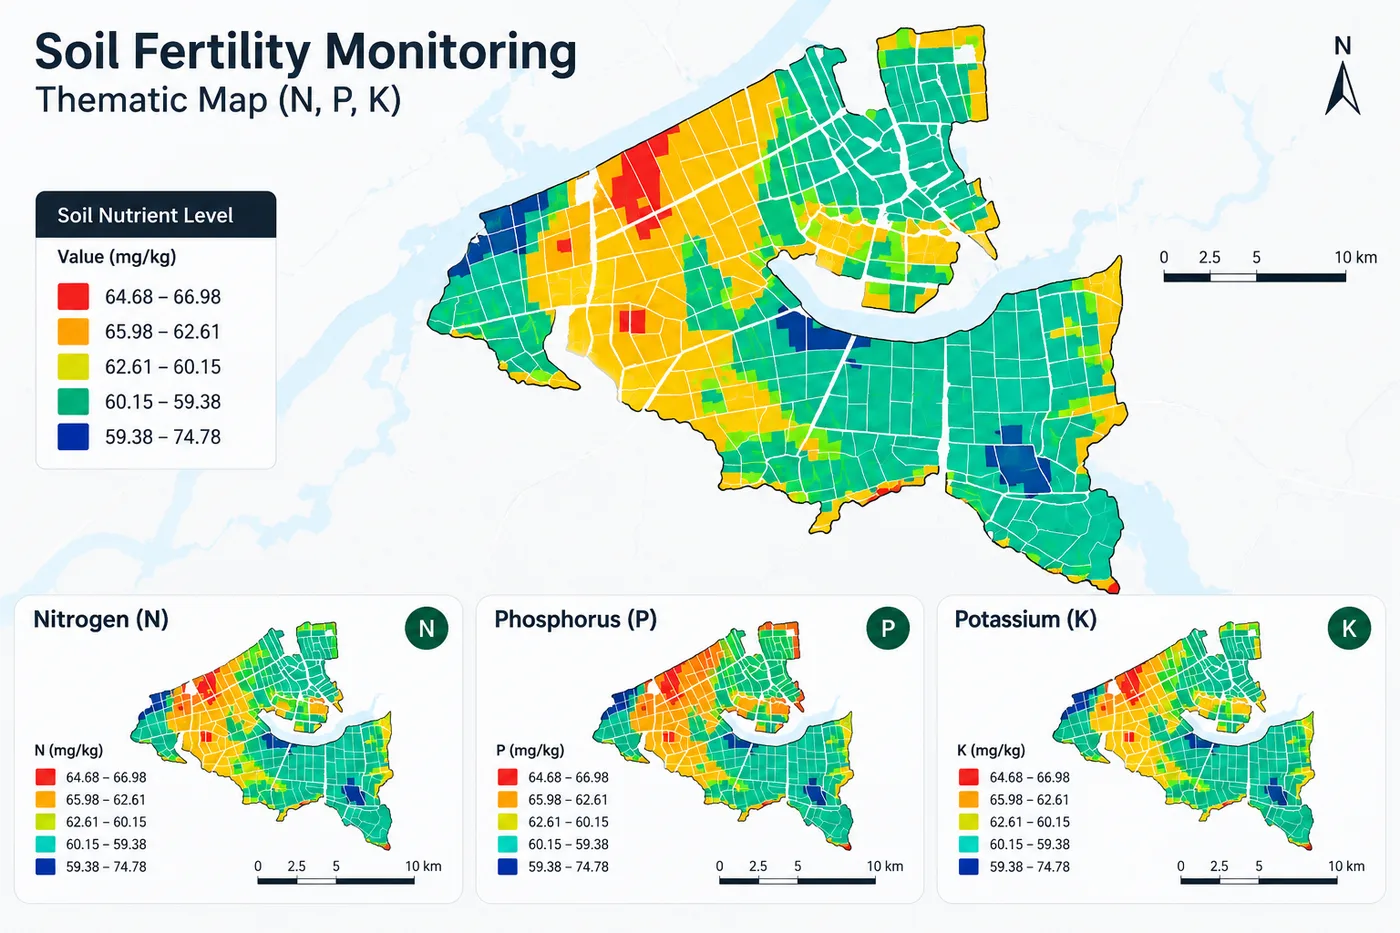
A nutrient problem is the one cause on this list that rarely moves. Nitrogen, phosphorus, and potassium deficiency zones tend to sit exactly on top of a field's known soil-productivity map or an old variable-rate application boundary, appearing early in the season and returning to the same coordinates year after year, the static counterpart to drought's gradual spread and pest pressure's rapid, irregular bloom.
Cross-Referencing With Soil Moisture, SAR, and Terrain
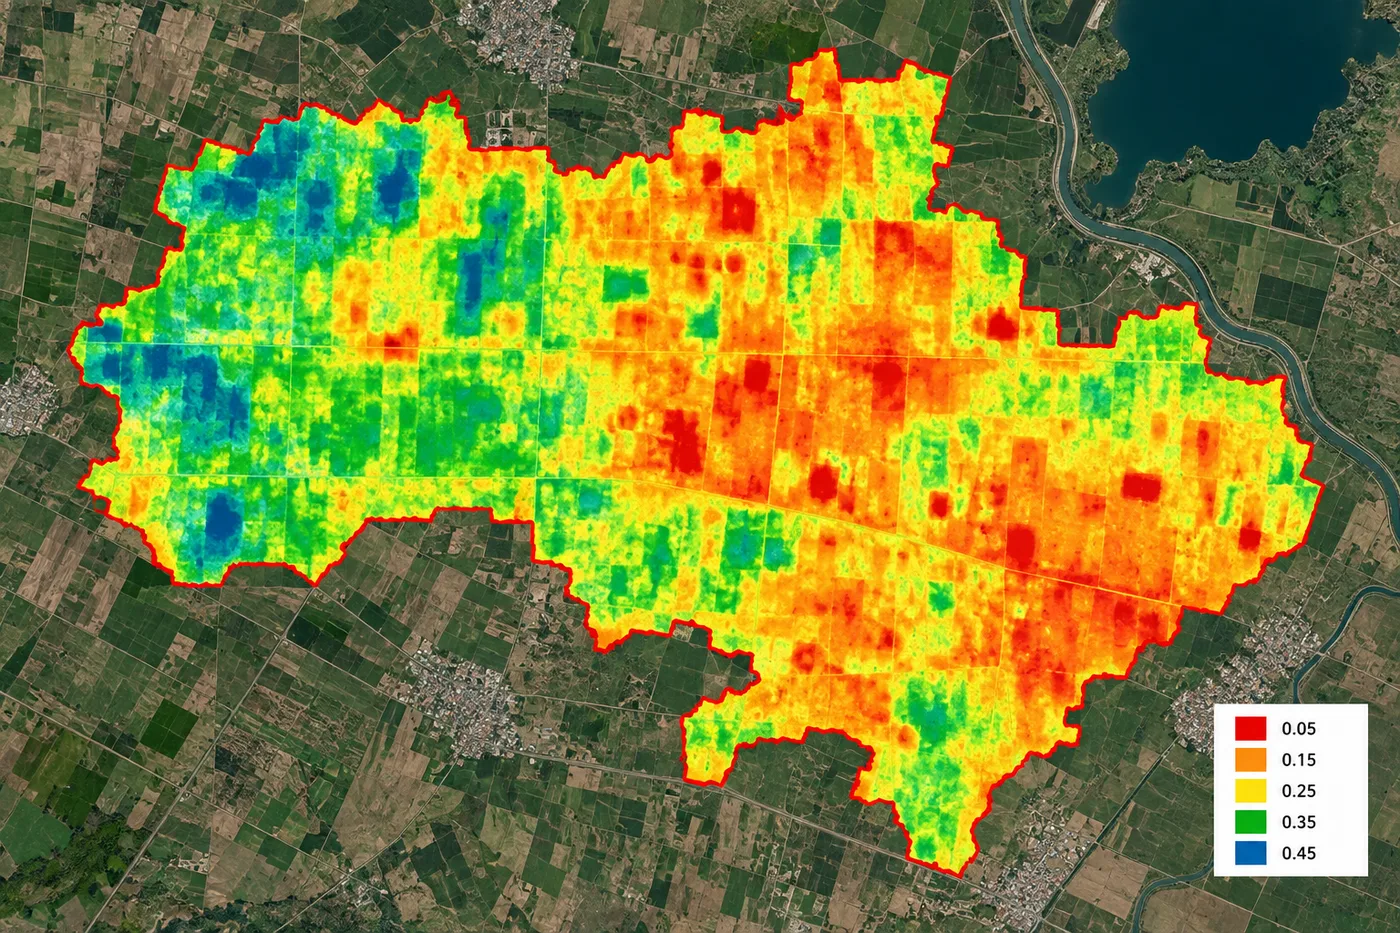
The single most useful cross-check for ruling drought in or out does not come from an optical band at all, it comes from measuring the soil directly. If soil moisture stays at an optimal level while a vegetation index keeps dropping, the stress almost has to be biotic, a pest or a disease, not water shortage.
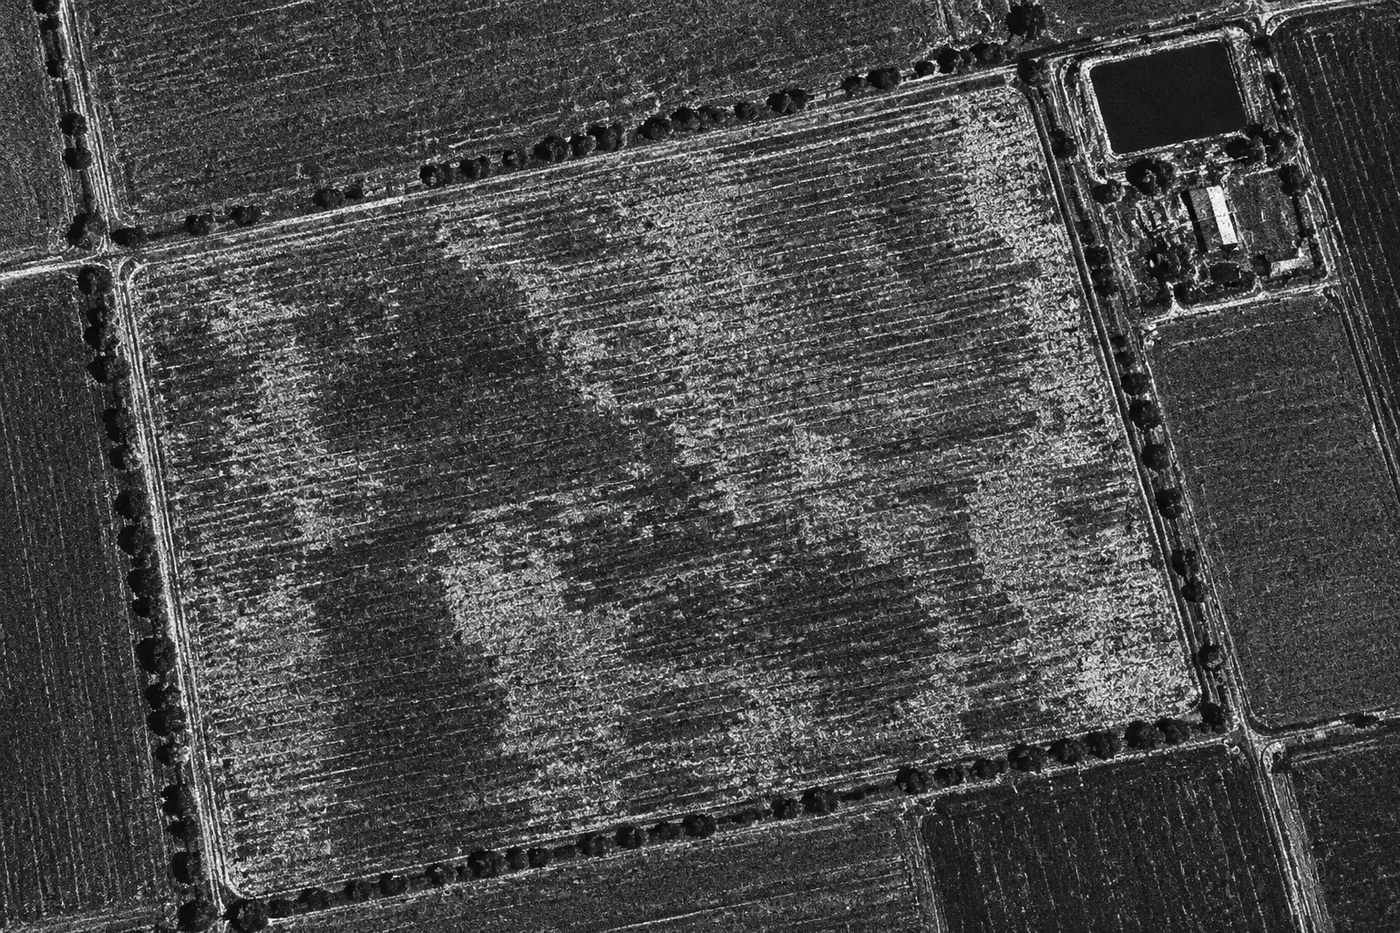
- SAR soil moisture and roughness. GF-3 and LT-1 read field-scale surface soil moisture and roughness on a daily basis, day or night, through the exact cloud cover that a monsoon-season disease outbreak or drought event tends to bring with it.
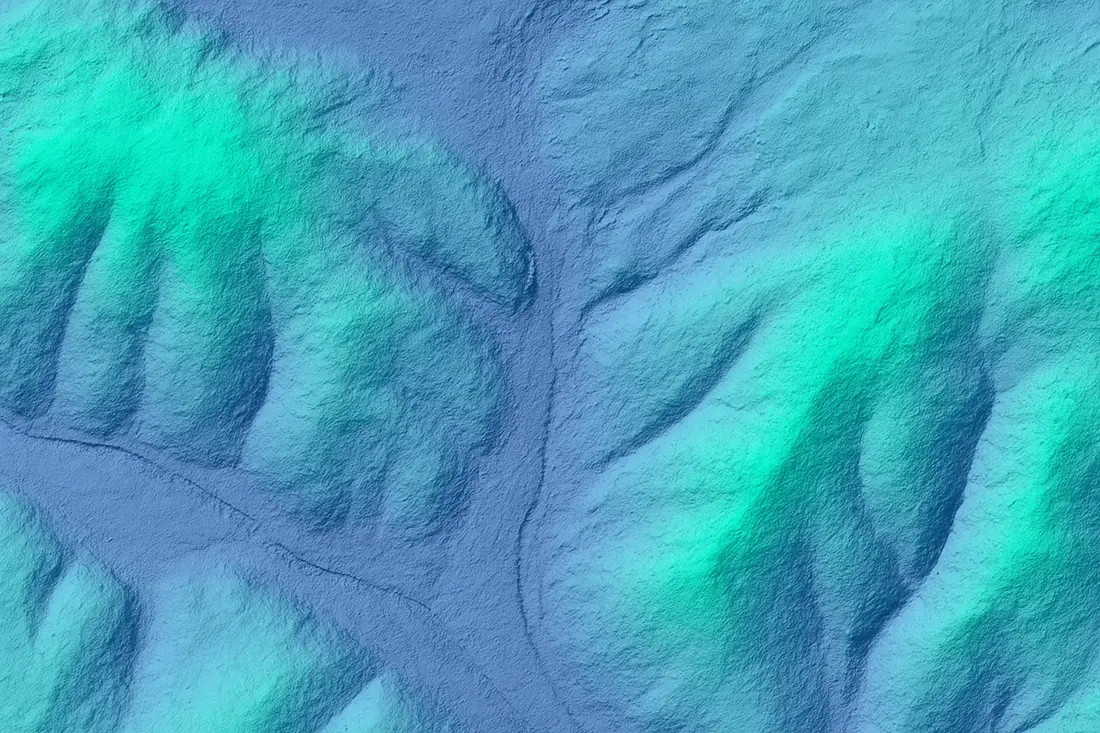
- Digital Elevation Model overlay. Stress confined to the highest, sandiest knolls on a DEM points to water stress. Stress that instead pools in low-lying, poorly-drained hollows points the other way entirely, toward root rot, fungal disease, or waterlogging, the exact pattern that shows up in a rice paddy's lowest corners during a wet season.
- Weather records. A quick check against local precipitation and evapotranspiration data rules drought out immediately if the field has actually received adequate rainfall or irrigation despite the stress reading.
AI Multi-Temporal Classification
Individual indices narrow the diagnosis. A model that watches how those indices change over several passes, not just one snapshot, is what actually classifies specific agricultural risks, fungal infection, viral disease, and pest attack among them, with confidence, since drought, pests, and disease each unfold on a different timeline, pest and disease pressure typically resolves or peaks within 1 to 4 weeks, while a drought signal builds and persists over 1 to 6 months.
Recent multi-satellite fusion research backs this up with real numbers, individual sensors classify crop condition at 87% accuracy for Landsat 8/9, 89% for Meteor-M, and 93% for Sentinel-2, and combining sources pushed overall classification accuracy from 92 to 96% in 2022 up to 96 to 97% in 2023. A 2026 hybrid framework applied specifically to wheat fields in northwest Tunisia fused multi-temporal Sentinel-2 and Landsat-8 imagery with meteorological data, running Random Forest, Support Vector Machine, and ConvLSTM models in a two-stage pipeline to classify current stress and predict its short-term trajectory, exactly the kind of system that turns a single confusing NDVI dip into a specific, dated diagnosis.

Not sure what's stressing a specific field?
Search our multispectral, SAR, and soil-moisture archive over your area of interest, or request a custom NDRE, NDMI, and CWSI workup. No account needed for a first estimate.
The Ground-Truth Protocol That Confirms It
Satellite imagery narrows the search radius from an entire county down to a handful of coordinates. It never replaces walking out to look, and skipping that last step is the single most common mistake in acting on a stress map.
- Drop a GPS pin directly in the center of the flagged anomaly, not at the field's edge, and walk straight to those coordinates.
- For a suspected pest cause, look for physical bite marks, egg masses, or frass, in corn specifically check the stalk base for rootworm larvae or lodged stalks, and in rice check for planthoppers at the stem base.
- For a suspected nutrient deficiency, check for uniform bottom-leaf yellowing or striping, in corn this often runs in strips that match an old fertilizer pass exactly.
- For suspected drought, look for soil cracking or tight leaf rolling across a wide, contiguous zone, in wheat this tracks the same sandy ridges a DEM overlay already flagged.
- For suspected disease, check for lesions, pustules, or discoloration patterns specific to the crop, wheat rust shows as orange-brown pustules, rice blast as diamond-shaped lesions, and root rot as a wet, foul-smelling root mass in the lowest-lying paddies or rows.

Key takeaways
- Shape and speed narrow the diagnosis first, drought spreads broadly and gradually with topography, pests and disease appear as fast-expanding irregular hotspots, and nutrient deficiency sits in static, geometric zones that repeat every year.
- Red Edge and NDRE catch chlorophyll loss from disease or nitrogen shortfall before visible yellowing, while NDMI, not NDWI, is the correct index for canopy water content, and CWSI reads water stress directly from canopy temperature.
- The fastest way to rule drought in or out is a direct soil-moisture read, if soil moisture is optimal but a vegetation index keeps dropping, the cause is almost certainly biotic, not water shortage.
- A Digital Elevation Model overlay separates a drought signature on high, sandy ground from waterlogging or root rot pooling in a low-lying hollow.
- Multi-temporal AI classification fusing several satellites reaches 96 to 97% accuracy in recent research, and pest or disease pressure typically resolves within 1 to 4 weeks against drought's 1 to 6 month timeline, a timing difference that itself helps confirm the cause.
- Satellite imagery narrows a diagnosis to a specific set of coordinates, it never replaces a ground-truth visit to confirm what is actually happening in the field.
Frequently asked questions
How can I tell if crop stress in satellite imagery is from drought or pests?
Start with the shape and speed of the stress pattern, drought spreads broadly and gradually across a field or region following topography, while pest pressure appears as small, irregular hotspots that expand rapidly, sometimes within days. Cross-referencing a vegetation index against direct soil moisture data confirms it, if soil moisture is optimal but the vegetation index keeps dropping, the cause is very likely biotic rather than drought.
What is the difference between NDVI and NDRE for crop stress detection?
NDVI uses Near-Infrared and Red bands and measures overall biomass, but it saturates over a dense, healthy-looking canopy. NDRE uses Near-Infrared and Red Edge bands instead and keeps resolving chlorophyll density past that saturation point, making it more sensitive to an early disease outbreak or nitrogen shortfall in a crop that already appears fully grown.
Is NDWI or NDMI the correct index for crop water stress?
NDMI, developed by Gao using Near-Infrared and SWIR bands, is the correct index for canopy water content in vegetation. The similarly named NDWI, developed by McFeeters using Green and Near-Infrared bands, was actually built to delineate open water bodies, not crop canopy moisture, though some agricultural software mislabels the NDMI calculation as NDWI, so it is worth checking which formula a given tool is actually running.
What is the Crop Water Stress Index and how does it work?
The Crop Water Stress Index, CWSI, is built from the difference between canopy temperature and air temperature, normalized between a well-watered baseline and a fully stressed, non-transpiring baseline. It isolates water stress directly from heat rather than reflectance, since a thirsty plant closes its stomata and its canopy temperature rises hours to days before its leaves visibly wilt.
Can satellite imagery distinguish nutrient deficiency from disease?
Yes, mainly by pattern and index cross-referencing. Nutrient deficiency tends to sit in static, geometric zones that match a field's soil-productivity map or an old fertilizer-pass boundary and repeat in the same spots every year, while disease appears as irregular, expanding hotspots. A Chlorophyll Index or Nitrogen Nutrition Index alongside Leaf Area Index further separates a fertility shortfall, normal canopy size with low nutrient uptake, from disease or pest damage that has physically reduced the canopy.
How does terrain data help diagnose the cause of crop stress?
Overlaying a stress map on a Digital Elevation Model separates causes by where they occur on the landscape. Stress confined to high, sandy knolls points to drought, while stress pooling in low-lying, poorly-drained hollows points instead to root rot, fungal disease, or waterlogging, the opposite diagnosis for what can look like a similar vegetation-index drop from above.
How accurate is AI classification at separating drought, pest, and disease stress?
Individual satellite sensors classify crop condition at 87 to 93% accuracy depending on the platform, and fusing multiple satellites together pushed overall classification accuracy to 96 to 97% in recent published research. Pest and disease pressure also typically resolves within 1 to 4 weeks, while a drought signal builds and persists over 1 to 6 months, a timing difference that itself helps confirm which cause is at work.
Do drought, pest, and disease patterns look different across crops like wheat, corn, and rice?
Yes. Wheat rust typically starts as a small hotspot that spreads down-row with the wind, corn rootworm or armyworm damage expands as roughly circular patches from a hatch site, and rice blast or bacterial blight concentrates in the lowest-lying paddies where water sits longest. Drought in wheat instead tracks sandy ridges and thin-soil knolls, and nitrogen deficiency in corn shows up as pale stripes matching an old fertilizer applicator's pass width.
Does satellite imagery replace walking a field to check on crop stress?
No. Satellite imagery narrows the search from an entire field or county down to a small set of GPS coordinates worth checking, but confirming the actual cause still requires a ground-truth visit, checking for bite marks or frass for pests, uniform leaf striping for nutrient deficiency, soil cracking or leaf rolling for drought, and crop-specific lesions or pustules for disease.
Sources and further reading
- Gao, B.C., 1996, NDMI (Normalized Difference Moisture Index) methodology, NIR/SWIR canopy water content retrieval
- McFeeters, S.K., 1996, NDWI (Normalized Difference Water Index) methodology, Green/NIR open-water delineation
- Idso, S.B., and Jackson, R.D., 1981, Crop Water Stress Index methodology, canopy-air temperature differential
- Published remote sensing literature on CIgreen and CIrededge chlorophyll index formulas and nitrogen content estimation
- 2026 multi-satellite fusion classification accuracy research (Landsat 8/9, Meteor-M, Sentinel-2) and a hybrid ML/deep-learning wheat crop stress framework, northwest Tunisia
- XRTech Group satellite archive, multispectral, SAR, and soil-moisture data sources
Ready to diagnose a stressed field with confidence?
Get NDRE, NDMI, and CWSI layers over your area of interest, cross-referenced against soil moisture, SAR, and terrain. No account needed to get a first estimate.