Yield Estimation With Satellite Imagery
On this page
- How satellite imagery estimates crop yield
- 01. Real-time growth and biomass tracking
- 02. Spectral analysis with NDVI
- How accurate are satellite based yield models
- The data and satellites behind a yield prediction model
- 03. Multi-source data inputs
- 04. Specialized satellite platforms
- How yield prediction models are actually built
- 05. Statistical yield models
- 06. Biophysical yield models
- What yield forecasts are actually used for
- 07. Harvest and logistics planning
- 08. Agricultural insurance and credit
- 09. Market intelligence and food security planning
- 10. Land bank and resource management
- Case study, China's wheat belt regional yield forecasting
- Tracking a wheat belt from germination to yield forecast
- Frequently asked questions
- Sources and further reading
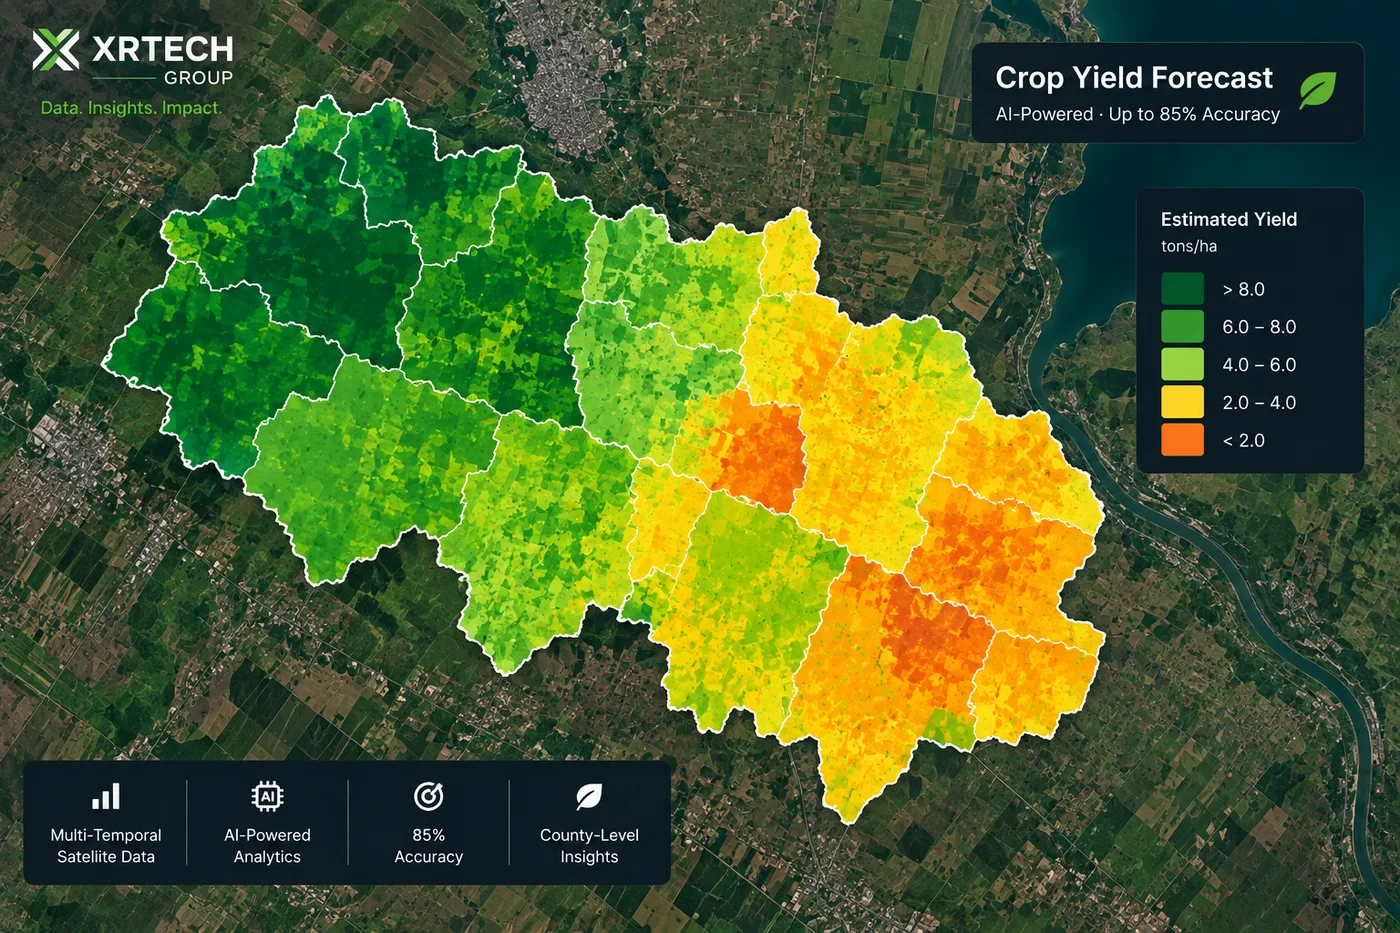
Yield estimation is the practice of forecasting how much a field will produce before it is actually harvested, and satellite imagery has become the fastest way to do that at scale. Multispectral and hyperspectral sensors read how much light a crop canopy reflects, artificial intelligence turns that signal into a number, and the result is a yield prediction that shows up weeks or months ahead of the combine. In 2026, the strongest yield models combine that spectral read with weather data, soil moisture, and years of regional harvest records, and they now reach roughly 85% accuracy at the county level. What follows is how yield modeling actually works, which satellites and indices drive it, and what a forecast like that gets used for once it exists. If you want the monitoring service itself rather than the background, see our agriculture satellite imagery page.
Quick answer
Yield estimation from satellite imagery works by tracking a crop's growth, biomass, and canopy health across the season with multispectral and hyperspectral sensors, then feeding that spectral record into an AI-based yield model alongside weather data, soil moisture, and historical harvest baselines. The output is a yield forecast generated before harvest, accurate to roughly 85% at the county level in current commercial deployments. Farmers, agronomists, insurers, and grain buyers use these forecasts to plan harvest logistics, verify insurance claims, and set storage and distribution schedules ahead of time instead of waiting for the combine to confirm what a field actually produced.
How satellite imagery estimates crop yield
A yield model needs two things before it can say anything useful, a record of how the crop is actually growing, and a way to turn that record into a number tied to real harvest weight.
01. Real-time growth and biomass tracking
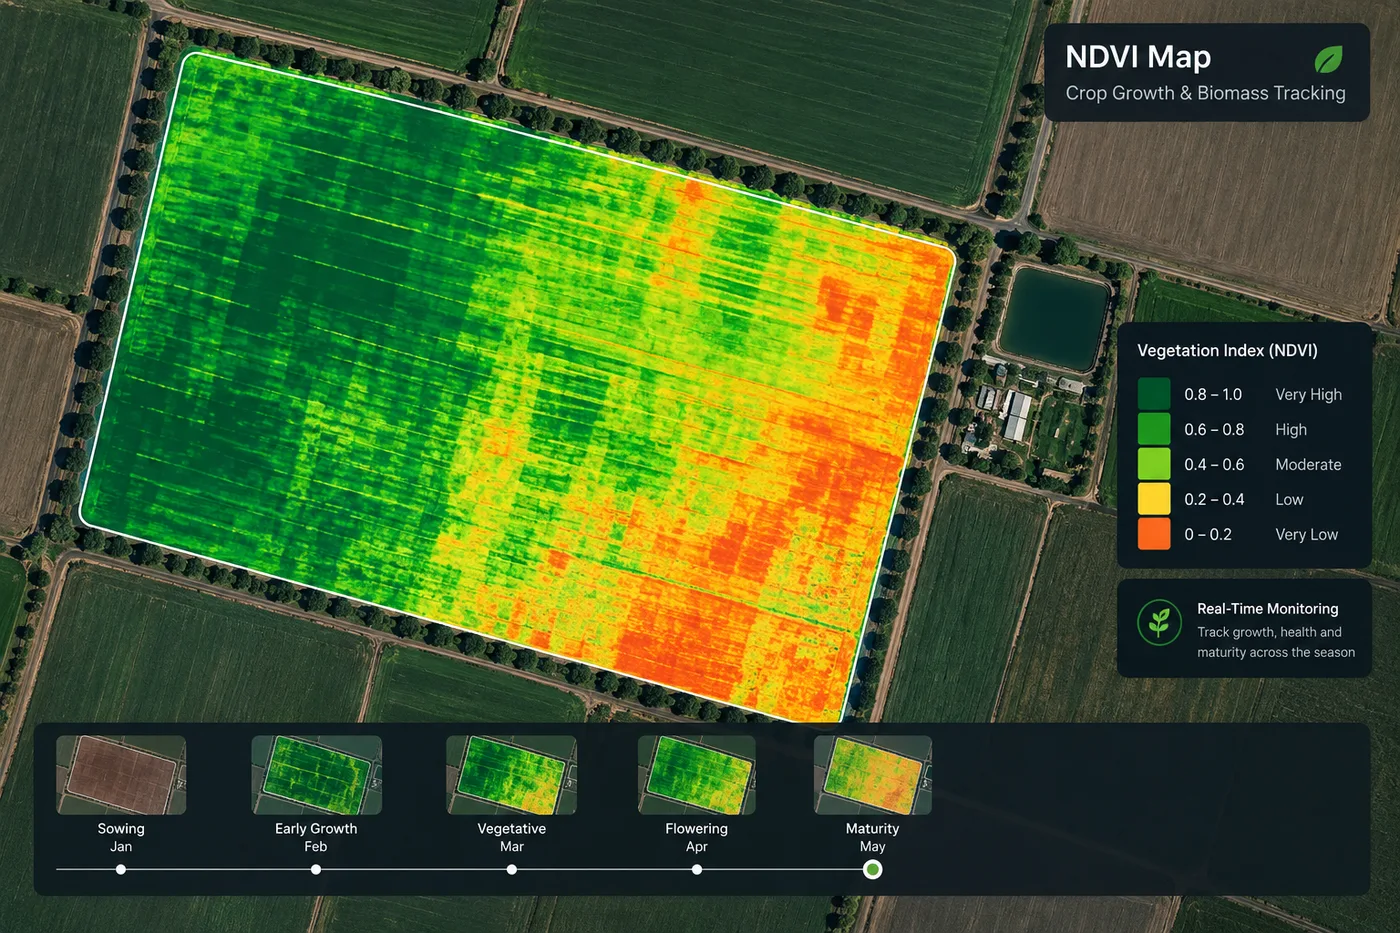
Multi-source satellite imagery gives continuous observation of crop growth, canopy density, and maturity across the full farming cycle, from sowing through emergence, vegetative growth, flowering, and grain fill. A single image only shows one moment. What a yield model actually needs is the shape of the whole curve, how fast biomass built up, when it peaked, and whether that peak arrived on schedule or late, since a canopy that stalls mid-season rarely catches back up by harvest.
02. Spectral analysis with NDVI
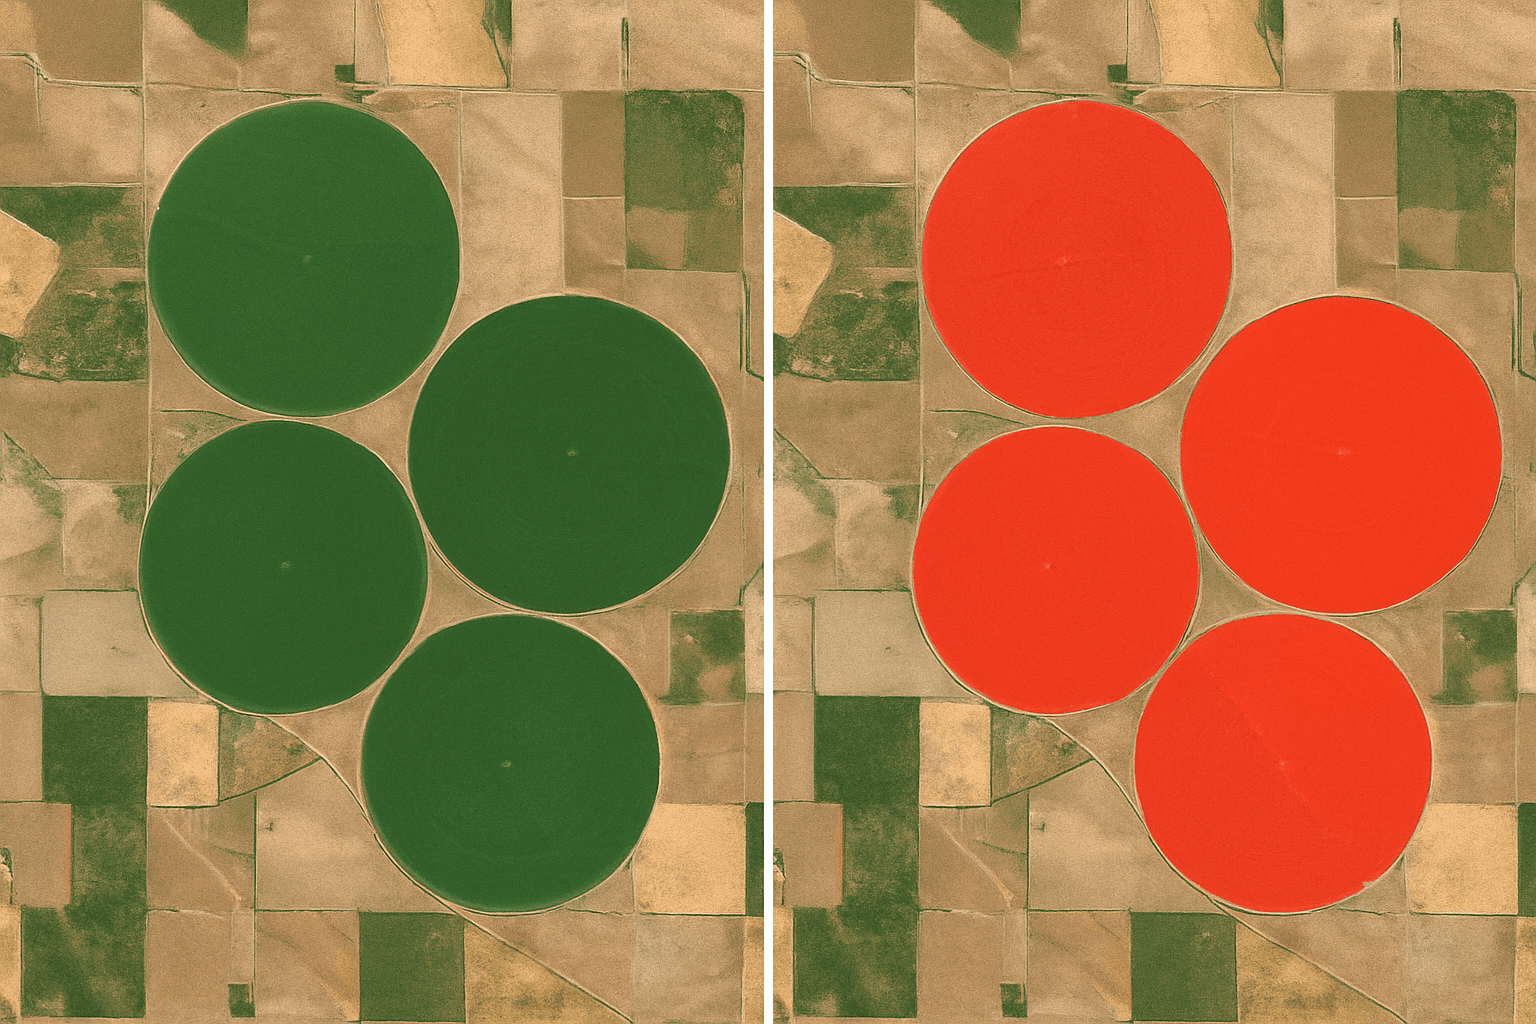
The Normalized Difference Vegetation Index, or NDVI, is the workhorse behind most yield models. It compares Red and Near-Infrared reflectance, since healthy, dense vegetation absorbs red light for photosynthesis and reflects NIR strongly, while stressed or sparse canopy does the opposite. That single ratio turns a raw satellite pass into a usable read on green biomass, plant vigor, and, combined with other bands, soil moisture. Because NDVI can be pulled from nearly every optical satellite in orbit, it is also the cheapest signal to get at scale, which is why it anchors even the more advanced hyperspectral and multi-sensor models described below.
NDVI = (NIR minus Red) divided by (NIR plus Red), the input behind the biomass curve every yield model starts from
How accurate are satellite based yield models
Accuracy is the number every grower, insurer, and grain buyer actually cares about, and it has moved a lot in the last few seasons.
By combining multi-temporal satellite data with AI algorithms trained on ground-truth harvest records, current yield models estimate crop production with up to 85% accuracy at the county level, a figure commercial platforms and recent research both converge on. A few more specific results from 2026 research fill in what that number actually rests on.
- A study using SkySat's 0.5 m imagery to estimate squash yield found the imagery explained 75 to 76% of yield variation (R squared 0.75 to 0.76), with a prediction error of 0.8 to 1.9 tons per hectare, outperforming coarser platforms tested alongside it.
- A deep learning model trained directly on raw satellite bands reached 89.44% accuracy forecasting wheat, soybean, and corn yields together, ahead of the 87.22% accuracy from an older approach that relied on vegetation indices alone.
- The earliest reliable signal tends to show up sooner than most growers expect. Correlations between satellite data and final yield start strengthening as early as 29 to 76 days after planting, while the canopy is still filling in, not waiting until flowering or grain fill to become useful.
None of these models replace ground-truth data, they are trained on it. The satellite record supplies the scale and the frequency, while historical harvest records supplied by agronomists and regional statistics offices keep the model honest about what a given spectral signature actually turns into at the scale.
The data and satellites behind a yield prediction model
No single sensor or dataset carries a yield model on its own. The accuracy numbers above come from stacking several data sources on top of each other.
03. Multi-source data inputs
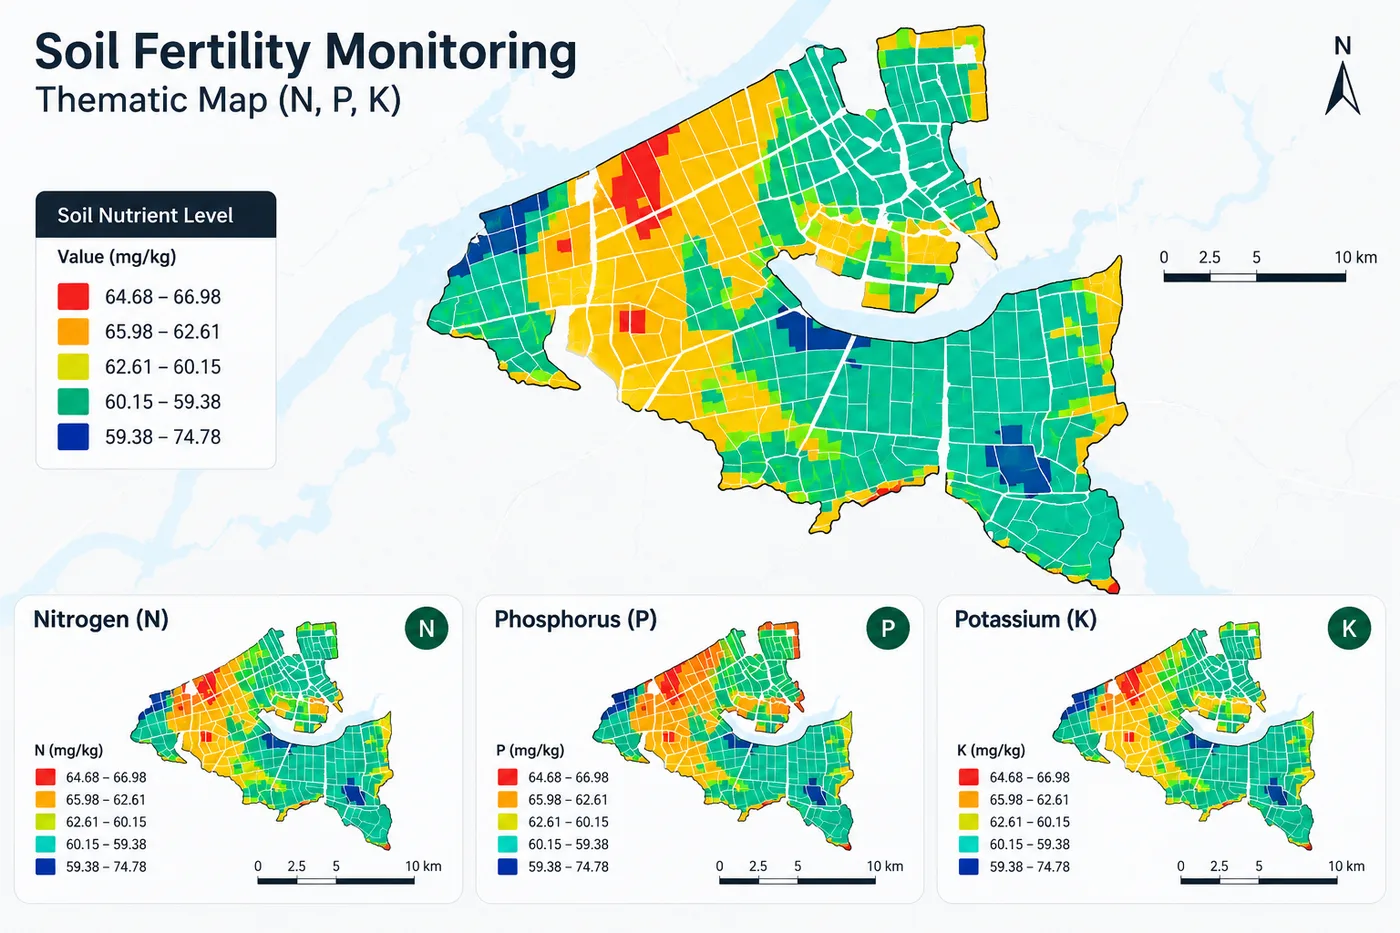
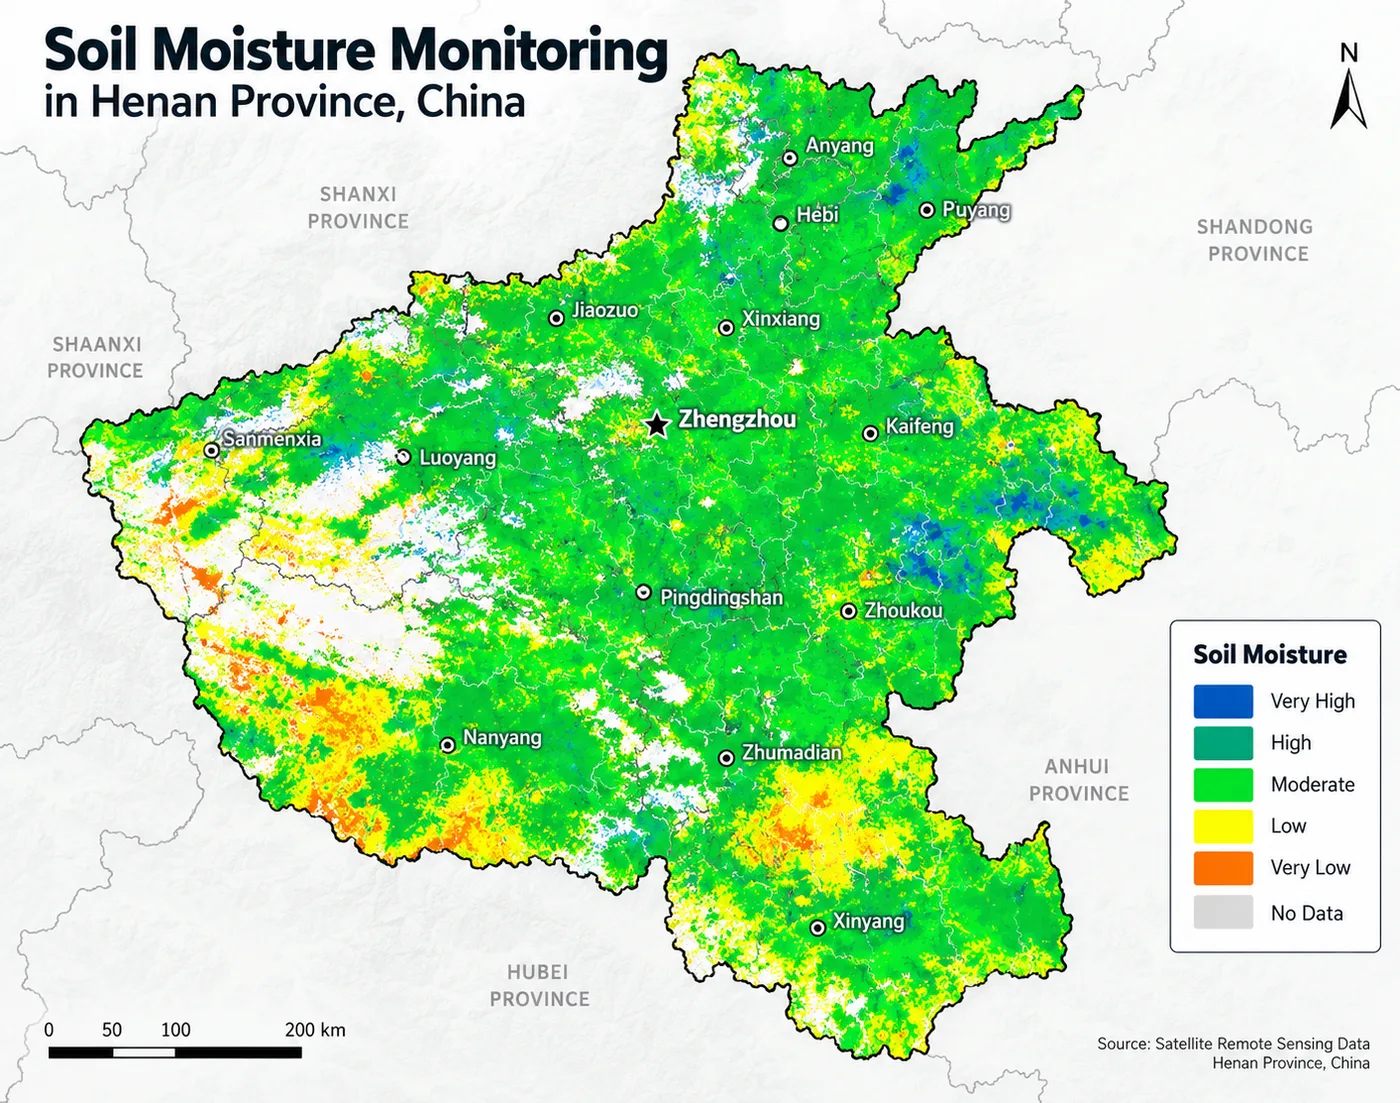
A production-grade yield model combines multi-temporal satellite imagery with meteorological data, weather disaster alerts, soil moisture tracking, and regional statistical baselines built up over prior seasons. Two more inputs round this out that are easy to overlook, the crop calendar, which tells the model what growth stage a field should be at on a given date so a low reading in week 3 is not judged by week-10 standards, and a soil composition map, which sets expectations for a field's ceiling yield independent of whatever the season's weather does to it. Soil moisture in particular tends to make or break a forecast in a dry year, since a field with strong NDVI can still fail at grain fill if the water was not there when it counted.
04. Specialized satellite platforms
Two platform types show up specifically in yield-modeling workflows, each solving a different half of the problem.
| Satellite / sensor | Type | Resolution | Swath | Role in yield modeling |
|---|---|---|---|---|
| CBERS-04 (WPM) | Multispectral camera | 5 m PAN, 10 m MS | 60 km | Field-to-regional vigor mapping on a 3-day revisit |
| CBERS-04 (IRS) | Infrared multispectral scanner | 40 m MS | 120 km | Broad-area biomass and moisture signal for regional yield baselines |
| CBERS-04A (WPM) | Multispectral camera | 2 m PAN, 8 m MS | 95 km | Finer-resolution vigor mapping on a 5-day revisit |
| Wyvern Dragonette | Hyperspectral (VNIR) | Narrow-band, hundreds of channels | Tasked | Nitrogen-stress detection and fertilizer-optimized yield forecasting |
CBERS-04 and CBERS-04A carry multispectral cameras alongside an infrared multispectral scanner, the IRS, and that combination plays a key role in regional crop yield estimation specifically because the IRS trades resolution for a much wider swath, useful for baselining an entire growing region rather than one farm. Hyperspectral platforms such as Wyvern's Dragonette satellites take the opposite approach, reading narrow spectral bands across the visible-to-near-infrared range to spot nitrogen stress and optimize fertilization with a specificity that broad 4 or 8-band multispectral sensors cannot match, which feeds directly back into a more precise yield forecast.
How yield prediction models are actually built
Underneath the accuracy numbers above, a yield model gets built one of two ways, and knowing which one is behind a given forecast tells you what it can and cannot do.
05. Statistical yield models
A statistical yield model learns from history. It takes several years of a field or region's actual harvest records, lines those up against the matching satellite, weather, and soil data for those same seasons, and trains a regression, random forest, or gradient-boosted model to recognize the pattern connecting the two. Once trained, it reads this season's data and outputs a yield number based on how closely the season resembles a past one that ended in a known result. This approach gets sharper every year a region keeps growing the same crop under similar conditions, but it struggles the moment something falls outside anything it has seen before, a new crop variety, an unfamiliar drought, or a region with no yield record to train on at all.
06. Biophysical yield models
A biophysical, or process-based, model takes the opposite route. Instead of learning from history, it simulates how the crop itself grows day by day, tracking leaf area, biomass accumulation, and the field's water balance the same way an agronomist would reason through a season by hand, just automated and fed by satellite and weather data instead of a paper log. Crop-growth models such as WOFOST, originally developed in agricultural research and now widely used in commercial yield modeling, work this way, and because they simulate plant physiology directly rather than pattern-matching against the past, they can produce a yield estimate for a brand-new field or crop with zero yield history, then refresh that estimate every couple of weeks as fresh weather data comes in. Production systems increasingly run both model types side by side and blend the outputs, since a statistical model corrects a biophysical model's blind spots, and a biophysical model covers a statistical model's.
What yield forecasts are actually used for
A forecast only matters once it changes a decision. These are the decisions it changes most often in production.
07. Harvest and logistics planning
Early yield forecasts let farmers, agronomists, and supply chain managers plan harvesting operations, manage storage capacity, and optimize distribution logistics well before the combine enters the field. Knowing whether a region is tracking toward a strong or weak harvest weeks in advance changes staffing, storage contracts, and transport bookings, all of which are far more expensive to arrange at the last minute than ahead of time.
08. Agricultural insurance and credit
Yield forecasts give insurance companies and credit institutions a way to run agriculture census evaluations, verify policy claims, and complete crop loss adjustments without waiting for a manual harvest count. Lenders use the same regional forecasts to assess credit risk ahead of a season, since a county tracking toward a weak harvest changes the calculus on agricultural financing well before any single farmer files a claim. For the claims side of this in more depth, see our guide to satellite imagery for insurance claims evidence.

09. Market intelligence and food security planning
Aggregated up to the national or global level, the same forecasts feed agricultural market intelligence, letting traders, exporters, and commodity buyers anticipate supply before an official harvest count confirms it. Governments and international agencies use the identical data to build crop statistics and inventories and to inform food security and land-use policy, since knowing a staple crop is tracking toward a shortfall months out gives far more room to act than finding out at harvest.
10. Land bank and resource management
Landowners, cooperatives, and resource managers overseeing many parcels at once use regional yield forecasts to decide which fields to rest, rotate, or invest additional input into for the following season. Rolled forward across several seasons, that same forecast record becomes a working land bank, a running productivity ledger for every parcel that supports lease negotiations and long-term land-use decisions without a fresh survey each time.
Case study, China's wheat belt regional yield forecasting
Tracking a wheat belt from germination to yield forecast
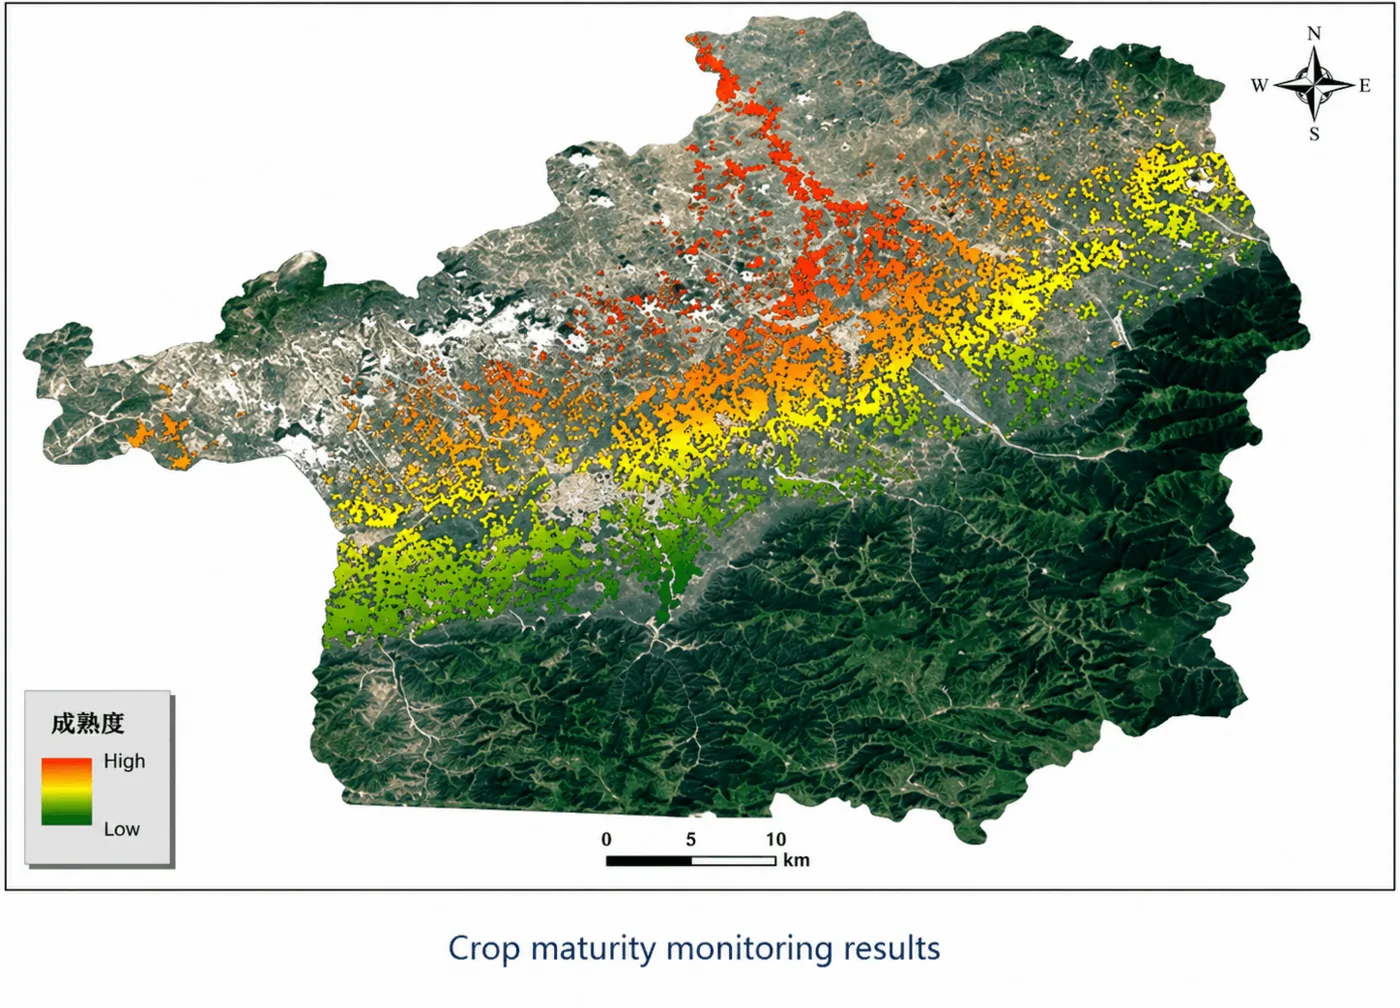
Deployed across major wheat-growing regions of China, multi-temporal satellite imagery tracked crop development from germination through maturity, identifying localized stress early enough to generate regional yield forecasts ahead of harvest.
- Tracked crop development at every growth stage across the region, not just at one snapshot in time
- Flagged localized drought and nutrient stress before it became visible on the ground
- Generated yield forecasts that fed directly into regional harvest planning
Yield model accuracy in numbers
Pulled from commercial deployments and 2026 peer-reviewed research, these are the numbers that describe where satellite-based yield modeling actually stands today.
Accuracy of AI-driven yield models at the county level, combining multi-temporal imagery with ground-truth harvest records.
Accuracy of a band-based deep learning yield model across wheat, soybean, and corn, ahead of an older vegetation-index-only approach at 87.22%.
Share of yield variation explained by 0.5 m satellite imagery in a recent in-season yield study, with error as low as 0.8 tons per hectare.
How soon after planting satellite signals start correlating strongly enough with final yield to be useful in a forecast.
Key takeaways
- Yield estimation from satellite imagery combines a season-long NDVI and biomass record with AI, weather data, soil moisture, and historical harvest baselines.
- Current yield models reach up to 85% accuracy at the county level, and band-based deep learning models now edge out older vegetation-index-only approaches, 89.44% against 87.22%.
- Satellite signals start correlating with final yield as early as 29 to 76 days after planting, well before flowering or grain fill.
- Statistical models learn from years of local harvest history, while biophysical models simulate crop growth directly and can forecast yield even with no yield history for a field at all, the exact approach covered in our guide to satellite data for crop risk underwriting in counties with incomplete records.
- CBERS-04 and CBERS-04A pair a multispectral camera with a wide-swath infrared scanner for regional-scale yield baselines, while hyperspectral platforms like Wyvern's Dragonette add nitrogen-stress precision.
- Forecasts get used well beyond the farm gate, shaping harvest logistics, storage and transport planning, insurance claims, agricultural credit, market intelligence, and land-use policy.
Frequently asked questions
What is yield estimation from satellite imagery?
Yield estimation from satellite imagery is the practice of forecasting how much a crop will produce before harvest, using multispectral and hyperspectral satellite data to track growth, biomass, and canopy health across the season, then feeding that record into an AI-based yield model alongside weather, soil moisture, and historical harvest data.
How accurate is satellite based yield prediction?
Current AI-driven yield models reach up to 85% accuracy at the county level. More specific studies show band-based deep learning models reaching 89.44% accuracy for wheat, soybean, and corn, and high-resolution imagery explaining 75 to 76% of yield variation with an error as low as 0.8 tons per hectare.
What satellite data goes into a crop yield model?
A production yield model typically combines multi-temporal optical or hyperspectral satellite imagery with meteorological data, weather disaster alerts, soil moisture tracking, and regional statistical baselines built up from prior seasons of ground-truth harvest records.
How does NDVI help predict crop yield?
NDVI compares how much red and near-infrared light a crop canopy reflects, since healthy, dense vegetation reflects near-infrared strongly and absorbs red light for photosynthesis. Tracking NDVI across a season shows how biomass built up, which is the strongest single predictor a yield model has of final harvest weight.
Can satellite imagery predict yield before harvest?
Yes, that is the entire purpose of a yield model. Satellite signals start correlating strongly with final yield as early as 29 to 76 days after planting, well before flowering or grain fill, letting agronomists, insurers, and supply chain managers plan weeks or months ahead of the actual harvest.
What satellites are used for crop yield modeling?
CBERS-04 and CBERS-04A pair multispectral cameras with a wide-swath infrared multispectral scanner (IRS) for regional yield baselines, while hyperspectral platforms such as Wyvern's Dragonette satellites add narrow-band nitrogen-stress detection for a more precise, fertilization-adjusted forecast. Open-access constellations like Sentinel-2 and Landsat also supply the NDVI time series most models start from.
How is soil moisture used in yield prediction models?
Soil moisture corrects what NDVI alone would suggest, since a field can show strong vegetation index readings and still fail at grain fill if water was not available when it mattered. Radar and thermal satellite data track soil moisture on a near-daily basis and feed that correction directly into the yield model.
Can satellite yield data be used for crop insurance?
Yes. Insurance companies and credit institutions use satellite-derived yield forecasts and historical imagery to run agriculture census evaluations, verify policy claims, and complete crop loss adjustments without waiting for a manual harvest count.
What is the difference between yield prediction and yield estimation?
In practice the two terms describe the same forecasting process and are used interchangeably. Some agronomists use yield prediction for a forecast made mid-season while the crop is still growing, and yield estimation for a figure calculated closer to or at harvest, but both rely on the same satellite and AI-based yield modeling pipeline.
Does a yield model need years of historical yield data to work?
Not always. A statistical yield model does need several years of local harvest records to train on. A biophysical, or process-based, model simulates the crop's actual growth instead of learning from history, so it can produce a yield estimate for a field or crop with no yield record at all, then update that estimate every couple of weeks through the season.
What format does a satellite yield forecast come in?
Results are typically delivered as a spreadsheet or a GIS-ready file, with the predicted yield attached to each field or administrative area, in whatever unit fits the crop, such as tons or bushels per hectare. Forecasts can be generated at the individual field level or aggregated up to a district, province, or country level depending on what the use case needs.
Sources and further reading
- Frontiers in Plant Science, 2026, review of remote sensing-based crop yield estimation, machine learning techniques and limitations
- ScienceDirect, deep learning based farm-level crop yield prediction using multi-temporal satellite data, 2025 to 2026
- PMC, in-season estimation of squash yield using high-spatial-resolution time-series satellite imagery, SkySat 0.5 m study
- China Siwei and CRESDA, CBERS-04 and CBERS-04A satellite specifications, multispectral camera and infrared multispectral scanner (IRS)
- Wyvern (Dragonette), hyperspectral VNIR data product documentation for agricultural nitrogen and yield applications
- Wageningen University and Research, WOFOST crop growth model documentation, process-based yield simulation
Want a yield forecast for your own fields?
Search our live archive or task new multispectral and hyperspectral imagery over your growing region, no account needed to get a first read.