Satellite Imagery for Irrigation, Soil Moisture Monitoring
On this page
- What satellite-based irrigation and soil moisture monitoring means
- The satellite fleet behind soil moisture and irrigation data
- Turning a satellite pass into an irrigation decision
- 01. Field-scale soil moisture mapping
- 02. Smarter irrigation scheduling with automated alerts
- 03. Drought and water-stress early warning
- 04. Cloud-free continuity with radar (SAR)
- Water-stress and soil-vegetation indices that drive the decision
- CWSI (Crop Water Stress Index)
- NDVI (Normalized Difference Vegetation Index)
- NDMI (Normalized Difference Moisture Index)
- Case study, Henan Province, China
- Daily field-scale soil moisture mapping and automated alerts
- Documented results from satellite-guided irrigation
- Satellite-guided irrigation versus a fixed schedule
- Frequently asked questions
- Sources and further reading
Every irrigation decision a grower makes runs on incomplete information unless it is backed by a field-scale soil moisture reading, since a single soil probe or a rain-gauge average cannot tell one corner of a pivot from another. Satellite remote sensing closes that gap. Multispectral optical sensors and all-weather Synthetic Aperture Radar (SAR) now map soil moisture and canopy water stress at field scale, refreshed daily in many programs, letting farmers, agronomists, and water resource managers water only the zones that actually need it instead of running a fixed calendar across an entire field. What follows covers how that pipeline works, which satellites and indices drive it, and what it has delivered in production. For the imagery and monitoring service itself, see our agriculture satellite imagery page.
Quick answer
Satellite imagery monitors irrigation and soil moisture by combining optical, thermal, and radar sensors into field-level moisture maps and water-stress indices such as CWSI, NDVI, and NDMI. AI-driven soil moisture mapping reaches an estimated 85 to 90% accuracy against ground measurements in tested agricultural deployments, and independent Sentinel-1 validation studies report correlation coefficients (R squared) as high as 0.82 against field sensors. Because radar penetrates cloud, rain, and darkness, this monitoring continues year-round, even through the wet seasons that blind optical-only systems, turning a fixed watering calendar into a data-driven, zone-by-zone irrigation schedule.
What satellite-based irrigation and soil moisture monitoring means
Satellite-based irrigation monitoring is the practice of reading how much water is in the soil and the crop canopy from orbit, then converting that reading into a specific watering action for a specific zone of a field, rather than relying on a fixed calendar or a handful of ground probes to represent an entire farm. It works because a plant under water stress and a plant with adequate moisture reflect and re-emit energy differently across three parts of the spectrum, visible and near-infrared light, thermal infrared heat, and microwave radar backscatter, and each of those signals maps to a different piece of the water picture.
Multispectral optical sensors measure canopy reflectance and convert it into vegetation and moisture indices. Thermal sensors read canopy temperature, since a water-stressed plant closes its stomata and heats up relative to a well-watered one nearby. Radar sensors transmit their own microwave pulse and measure how it scatters off soil roughness and near-surface water content, which is why radar keeps working through cloud cover that blinds the other two. Most production-grade irrigation programs combine at least two of the three, since no single sensor type covers every growing condition, crop stage, or weather pattern on its own.
The satellite fleet behind soil moisture and irrigation data
No single satellite covers every part of this picture. Commercial very-high-resolution optical satellites resolve individual fields and irrigation lines, open-access constellations anchor long-term baselines, and radar fills in the moisture and all-weather coverage that optical sensors cannot reach.
| Satellite / constellation | Sensor | Native resolution | Key bands / swath | Best for |
|---|---|---|---|---|
| SuperView-2 (GFDM) | Optical, expanded MS | 0.42 m PAN / 1.68 m MS | 1+8 bands incl. Purple, Yellow, Red Edge, NIR1, NIR2 | Sub-meter canopy stress and moisture detail at the field level |
| GF-6 | Optical, PMS + WFV | 2 m PAN / 8 m MS, 16 m WFV | Red Edge band (690 to 770 nm), 90 to 800 km swath | Regional soil moisture and crop-health surveys across a farming belt |
| CBERS-04 / 04A | Optical, WPM + WFI | 2 to 5 m PAN, 8 to 10 m MS | Wide Field Imager, 685 to 866 km swath | Long-run water-resource surveys and regional soil-moisture baselining |
| GF-3 (SAR) | C-band radar | 1 m (Spotlight) to 500 m (ScanSAR) | 12 imaging modes | Cloud-free daily-cadence soil moisture and flood-hit field mapping |
| LT-1 (A & B, SAR) | L-band radar | 3 m | Dual-satellite InSAR pair | Deeper soil-moisture penetration and drainage-pattern mapping |
| Sentinel-1 (ESA) | C-band radar | 5 to 20 m | Open access, near-global revisit | Free, validated soil-moisture baselining for research and small farms |
| Sentinel-2 / Landsat | Optical, Thermal | 10 to 30 m | Red Edge (Sentinel-2), TIRS-2 thermal (Landsat) | Open-access NDVI, NDMI, and CWSI time series |
The pattern is deliberate. SuperView-2's 1+8 band sensor and GF-6's Red Edge channel supply the fine spectral detail that separates a genuine moisture deficit from a nutrient or pest problem, while GF-6 and CBERS-04/04A's wide swaths make it practical to survey an entire irrigation district or agricultural belt in a single pass rather than stitching together dozens of narrow scenes. GF-3 and LT-1 add the piece optical sensors cannot supply on their own, an all-weather radar signal that keeps delivering soil-moisture readings straight through cloud cover, heavy haze, and full darkness, with Sentinel-1 providing the open-access equivalent for baseline comparison and research use.
Turning a satellite pass into an irrigation decision
A single reading only shows today's status. What actually changes a watering decision is a repeatable pipeline, from raw reflectance to a zone-specific action a crew can act on the same day.
01. Field-scale soil moisture mapping
Multispectral satellite data, cross-referenced against known soil types and canopy cover, tracks near-surface soil moisture and fertility at field scale. In tested agricultural deployments, this combination of satellite bands and AI-driven analytics reaches an estimated 85 to 90% accuracy against ground-truth moisture sensors, precise enough to base a variable-rate irrigation plan on rather than treating the whole field as one unit. Independent peer-reviewed validation of Sentinel-1's C-band radar against ground sensors in small-scale irrigation schemes reported correlation coefficients (R squared) of 0.75 and 0.82 across two test sites, supporting the same conclusion with open-access data alone.
02. Smarter irrigation scheduling with automated alerts
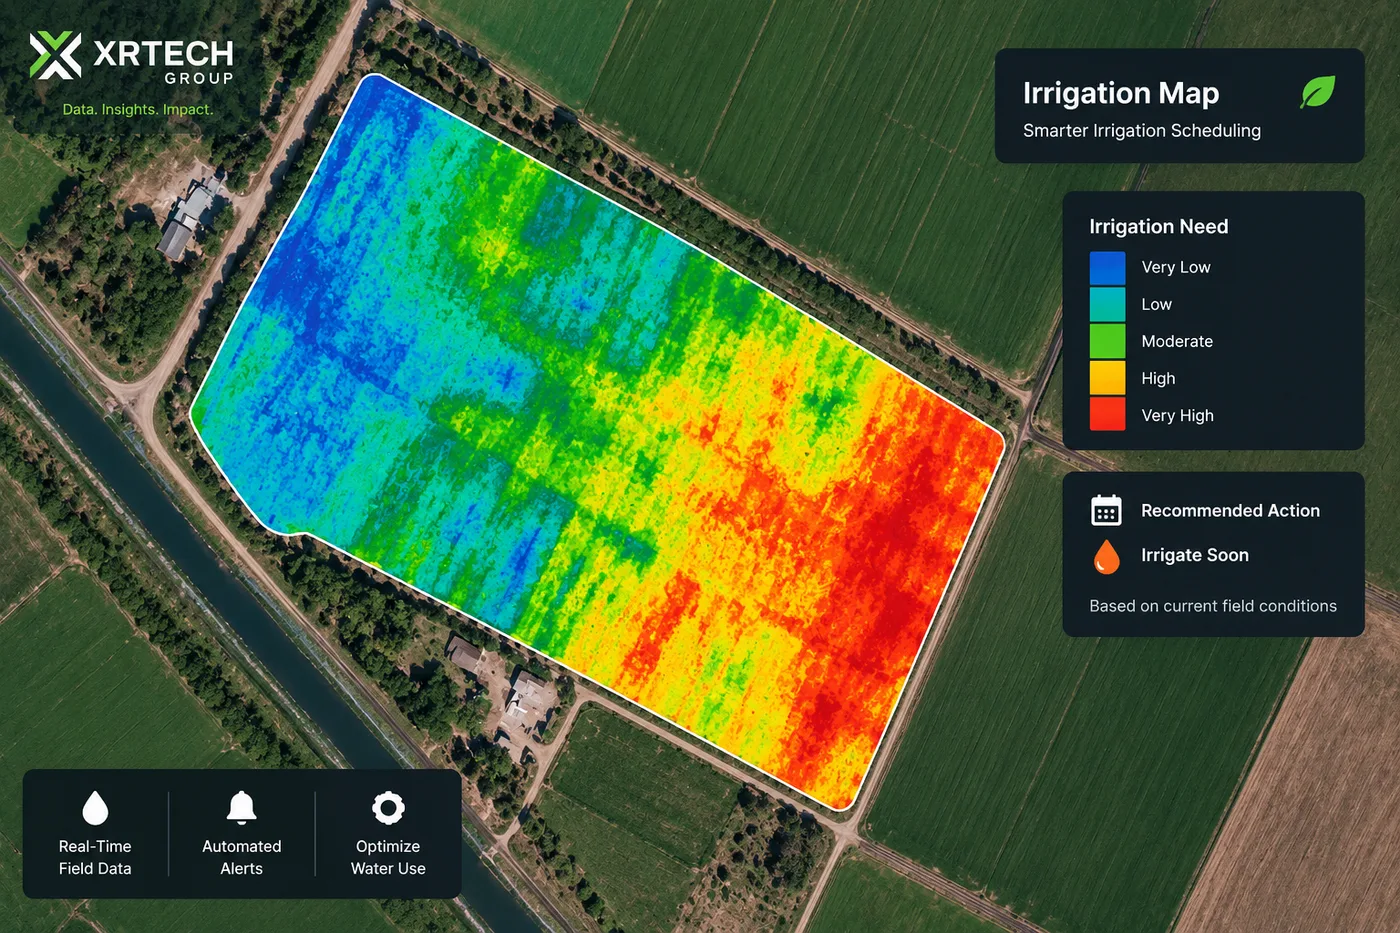
High-resolution imagery and automated processing turn a moisture map into a recommended action, not just a picture. Instead of running every zone on the same rotation, growers get an alert naming exactly which sections of a field need water this cycle and which can wait, replacing a rigid calendar with real-time field demand. That shift is what separates satellite-guided scheduling from a standard irrigation timer, the schedule follows the field's actual condition instead of the other way around.
03. Drought and water-stress early warning
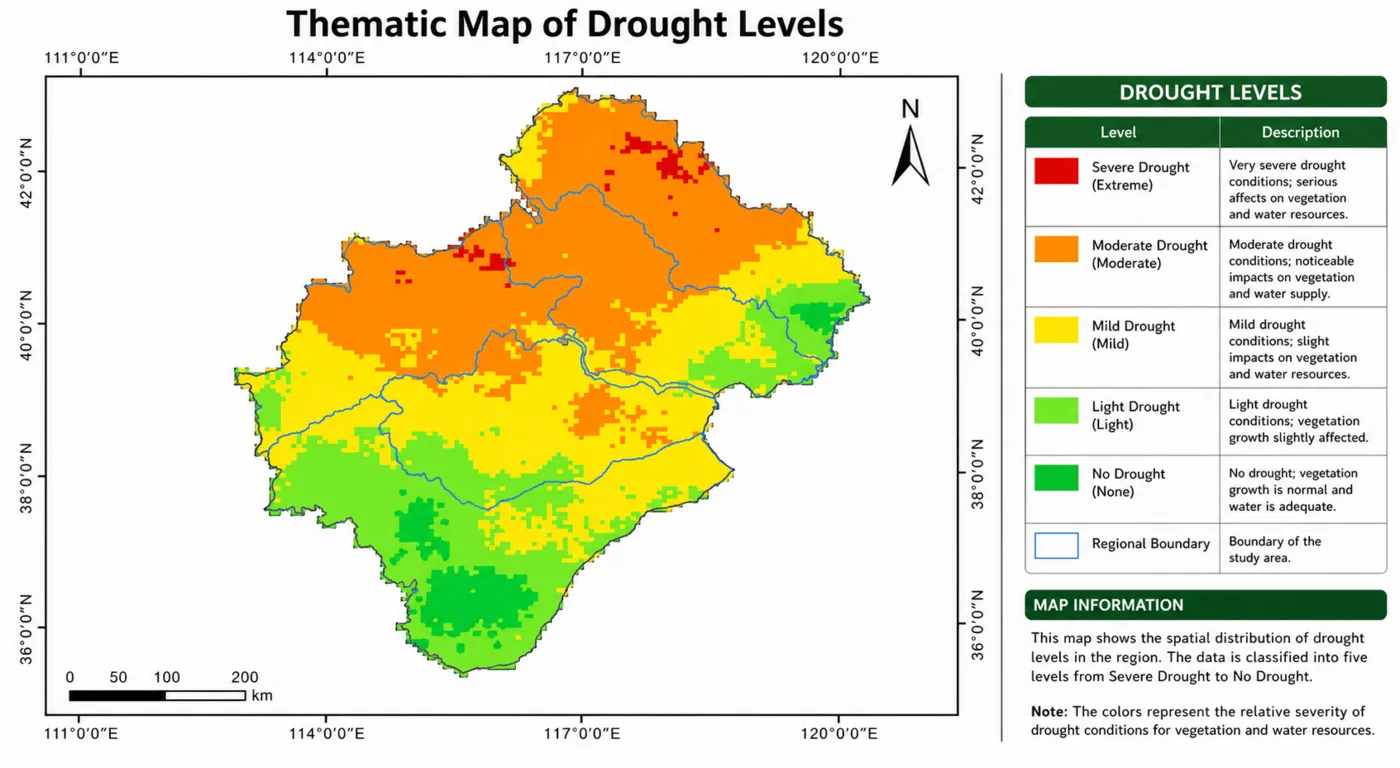
Combining satellite-derived vegetation indices with weather monitoring gives an early read on drought hotspots and canopy dehydration before visible wilting sets in. Because the underlying data covers a whole region rather than a single farm, this same pipeline supports both a single grower deciding whether to move up an irrigation cycle and a water-resource agency tracking which sub-basins are heading toward a shortage.
04. Cloud-free continuity with radar (SAR)
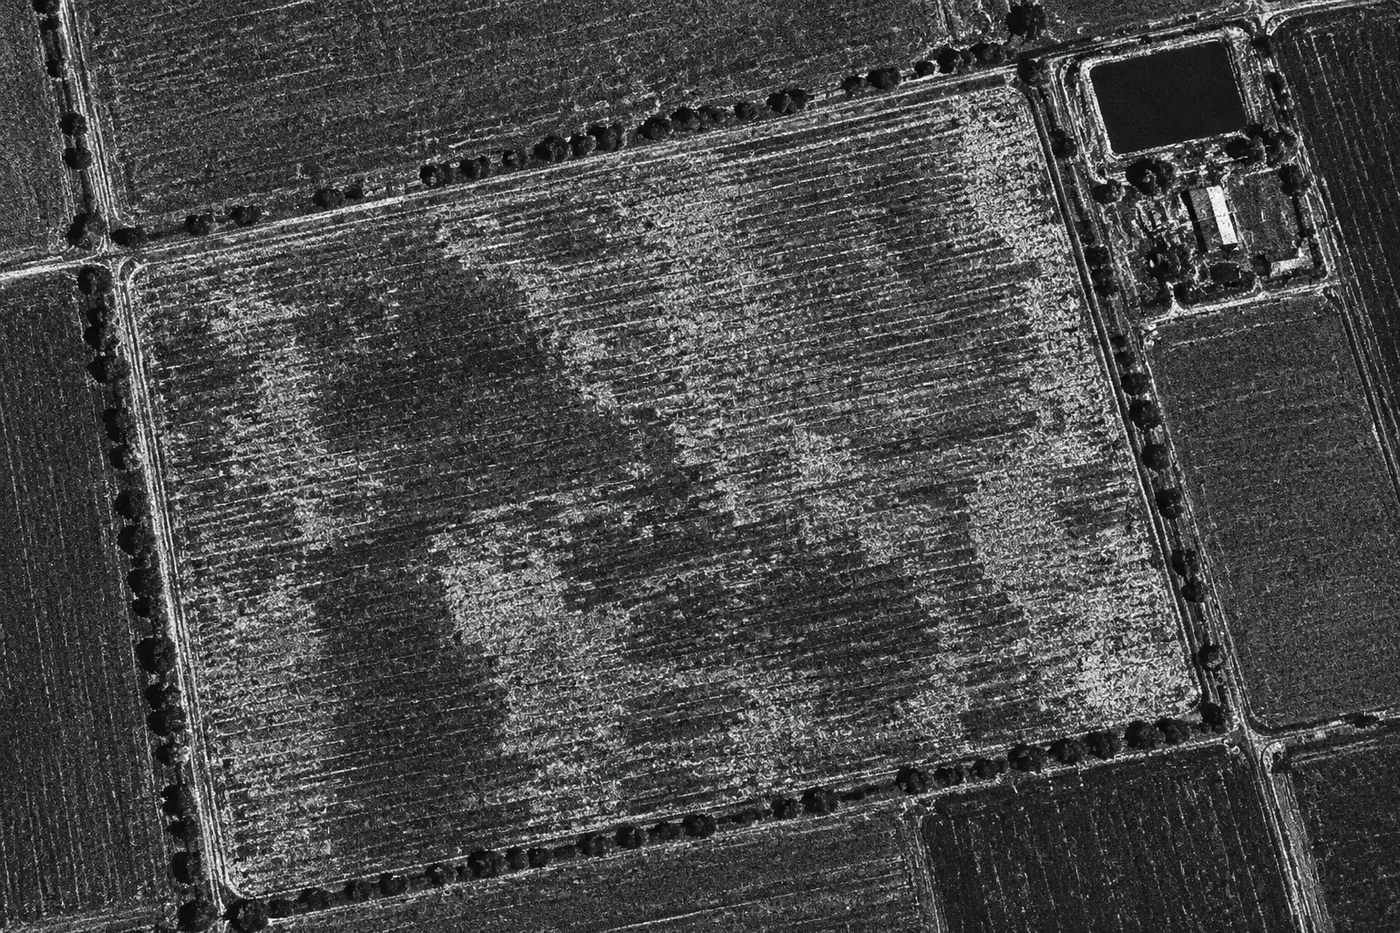
Persistent cloud cover during a wet season or monsoon routinely blinds optical satellites for weeks at a stretch, exactly the period when soil moisture is changing fastest. GF-3's C-band and LT-1's L-band SAR solve this by transmitting their own signal instead of depending on reflected sunlight, so they keep imaging the ground through cloud, rain, and darkness. For rice paddies, monsoon-belt row crops, and any region with an extended wet season, SAR is often the only usable data source for a meaningful share of the growing calendar, not an optional backup layer.
Water-stress and soil-vegetation indices that drive the decision
Raw satellite bands become useful once they are converted into an index built for a specific question. The indices below are the ones most directly tied to irrigation and soil-moisture decisions; for the wider vegetation-index library used across precision agriculture, including SAVI, GNDVI, and CCCI, see our guide to precision agriculture with satellite imagery.
CWSI (Crop Water Stress Index)
Derived from canopy temperature minus air temperature, normalized against non-stressed and fully stressed baselines
Reads canopy temperature differentials from thermal bands like Landsat's TIRS-2 to flag localized dehydration, closely related to the crop's real-time evapotranspiration rate, before a visible wilt sets in.
NDVI (Normalized Difference Vegetation Index)
(NIR minus Red) divided by (NIR plus Red)
Tracks green biomass and vigor. A sudden NDVI drop against a field's own historical trend is often the first visible sign that a moisture deficit has started to affect growth.
NDMI (Normalized Difference Moisture Index)
(NIR minus SWIR) divided by (NIR plus SWIR)
Reads water content inside the plant canopy itself, using the short-wave infrared band, which is why agronomists run it alongside NDVI to separate a genuine water-stress signal from a nutrient or pest problem that looks similar on a vigor map alone.
| Index | Full name | Primary use |
|---|---|---|
| SAVI | Soil-Adjusted Vegetation Index | Corrects for exposed soil brightness in sparse, early-season canopy |
| OSAVI | Optimized Soil-Adjusted Vegetation Index | Refines SAVI for low-cover fields where bare soil dominates the signal |
| LAI | Leaf Area Index | Canopy development, used to contextualize how much water a canopy is actually transpiring |
| NDRE | Normalized Difference Red Edge | Chlorophyll and nitrogen status in dense canopy where NDVI has saturated |
Evapotranspiration, the combined water loss from soil evaporation and plant transpiration, ties several of these indices together in practice. CWSI and NDMI both function as proxies for how close a field is running to its real evapotranspiration demand, which is why irrigation-scheduling platforms built on satellite data generally pair a thermal or moisture index with a weather-driven evapotranspiration model rather than reading vegetation greenness alone.
Case study, Henan Province, China
Daily field-scale soil moisture mapping and automated alerts
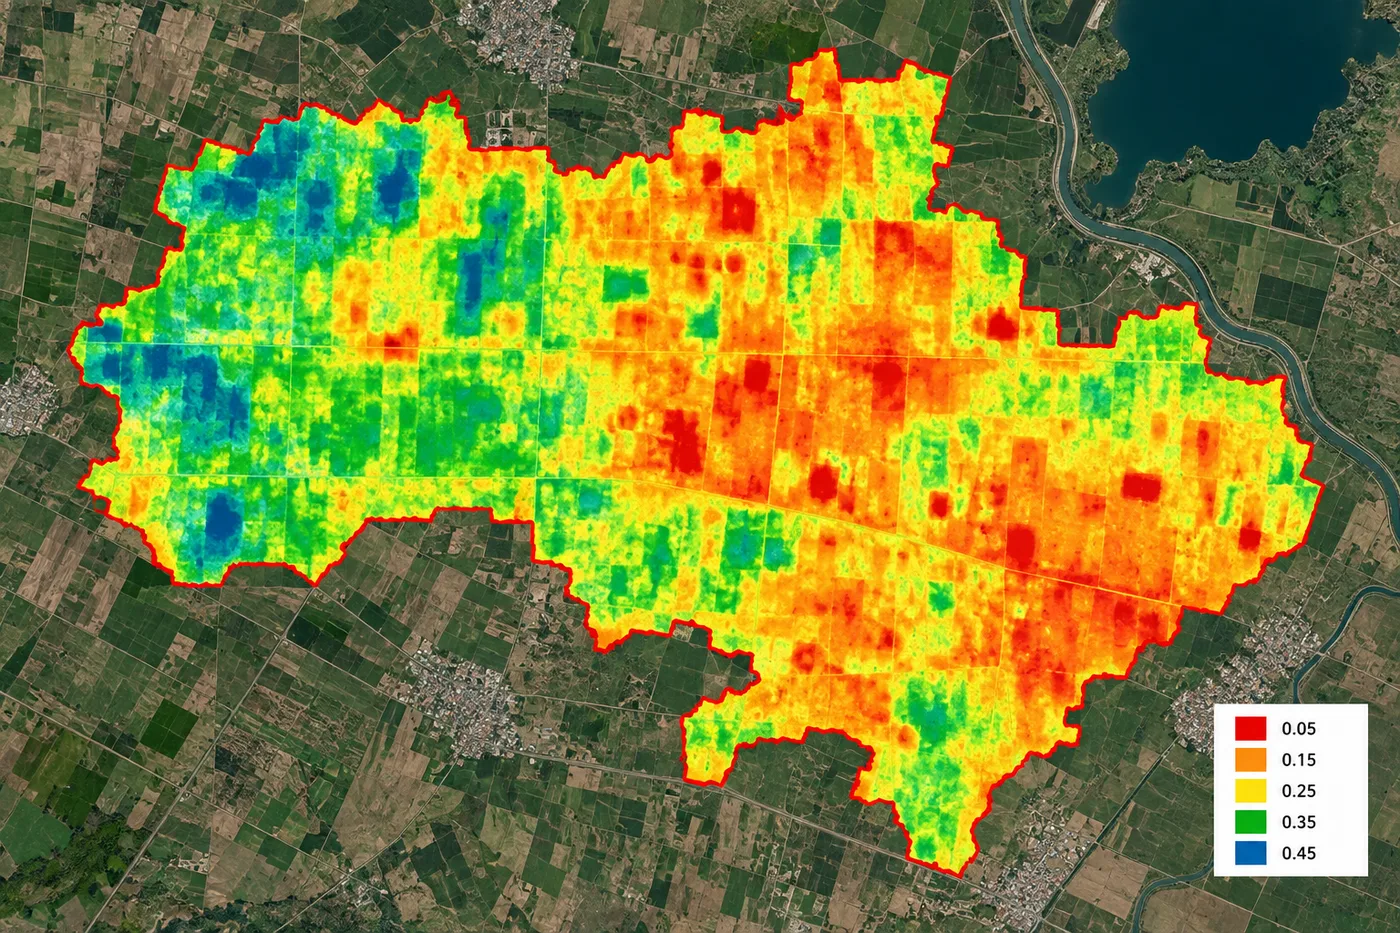
In the agricultural belt of Henan Province, multi-temporal satellite imagery and remote-sensing models were deployed for field-scale soil moisture tracking across major farming zones. The program mapped soil moisture at daily resolution and used that data to trigger automated, localized irrigation alerts, telling growers exactly which zones showed a moisture deficit rather than issuing a blanket watering instruction.
- Delivered daily, high-resolution soil moisture maps across key farming zones
- Sent targeted irrigation alerts naming the specific zones that needed water, avoiding overwatering elsewhere in the same field
- Replaced a calendar-based schedule with a data-driven one, optimizing water use while protecting crop productivity
Task cloud-free SAR over a field this week
Whether it is GF-3's 1 m Spotlight radar, LT-1's 3 m L-band pair, or daily-cadence SuperView-2 optical imagery, we can get soil moisture and canopy water-stress data flowing over your fields without waiting for a clear sky.
Documented results from satellite-guided irrigation
Beyond the Henan program, published research and industry-reported deployments elsewhere show a consistent range of water savings once satellite moisture data is tied directly to an irrigation-scheduling decision.
Industry and research benchmarks
Water savings reported from satellite and climate-service-guided irrigation scheduling on grape farms in Nashik, India, with no yield loss.
Reported accuracy of AI-driven field-scale soil moisture mapping against ground-truth measurements in tested deployments.
Peer-reviewed correlation between Sentinel-1 SAR soil-moisture estimates and ground sensors in small-scale irrigation schemes.
Share of total applied water lost to inefficiency in a studied sprinkler system, the kind of loss satellite-guided scheduling is built to catch.
Satellite-guided irrigation versus a fixed schedule
| Factor | Fixed calendar schedule | Satellite-guided scheduling |
|---|---|---|
| Watering basis | Same interval for the whole field | Actual measured moisture, zone by zone |
| Weather blind spots | None built in | SAR keeps reading through cloud and rain |
| Response to an emerging deficit | Waits for the next scheduled cycle | Automated alert can move the cycle up |
| Overwatering risk | High in naturally wetter zones | Low, dry zones get flagged separately |
| Data needed to start | None | A baseline satellite pass and field boundary |
Key takeaways
- Radar satellites such as GF-3 and LT-1 image through cloud, rain, and darkness, keeping soil moisture data flowing through wet seasons that blind optical sensors.
- AI-driven field-scale soil moisture mapping reaches roughly 85 to 90% accuracy against ground truth, and open-access Sentinel-1 validation reports R squared values up to 0.82.
- Automated, zone-specific irrigation alerts replace a fixed calendar with a schedule based on actual field demand, cutting both water waste and crop water stress.
- Daily field-scale monitoring in Henan Province, China, showed that targeted irrigation alerts can eliminate overwatering while keeping crop productivity steady.
- Published research on satellite-guided irrigation reports water savings generally in the 17 to 45% range depending on crop, season, and irrigation system.
- CWSI and NDMI function as proxies for evapotranspiration, which is why irrigation-scheduling platforms typically pair a moisture or thermal index with a weather-driven ET model.
Frequently asked questions
How does satellite imagery monitor soil moisture?
Satellites read soil and canopy water content through three signal types, optical and near-infrared reflectance, thermal infrared canopy temperature, and radar backscatter. Radar sensors such as Sentinel-1, GF-3, and LT-1 transmit their own microwave pulse and measure how it scatters off soil roughness and near-surface moisture, which works even through cloud cover, while optical and thermal sensors convert reflected light and heat into indices like NDMI and CWSI.
How accurate is satellite-based soil moisture mapping?
AI-driven field-scale soil moisture mapping reaches an estimated 85 to 90% accuracy against ground-truth sensors in tested agricultural deployments. Independent peer-reviewed validation of open-access Sentinel-1 radar against ground sensors reported correlation coefficients (R squared) of 0.75 and 0.82 across two test sites, supporting a similar level of reliability using free data alone.
Can satellite imagery see soil moisture through clouds?
Optical satellites cannot see through cloud cover, but Synthetic Aperture Radar (SAR) satellites such as GF-3, LT-1, and Sentinel-1 transmit their own microwave signal instead of relying on reflected sunlight, so they continue mapping soil moisture through cloud, rain, and full darkness.
What is the Crop Water Stress Index?
CWSI, the Crop Water Stress Index, compares canopy temperature against air temperature and normalizes that difference against non-stressed and fully water-stressed baselines. A water-stressed plant closes its stomata and heats up relative to a well-watered one, so CWSI flags dehydration using thermal satellite bands before a visible wilt appears.
How is satellite data used for irrigation scheduling?
Satellite-derived soil moisture and water-stress indices are converted into a zone-by-zone irrigation-need map, then paired with automated alerts naming which sections of a field need water in the current cycle. This replaces a fixed calendar schedule with one based on the field's actual measured condition, reducing both overwatering and water stress.
What is the difference between NDVI and NDMI?
NDVI uses red and near-infrared light to track general plant vigor and biomass. NDMI uses near-infrared and short-wave infrared light to read water content inside the plant canopy specifically, which is why the two are often run together, a vigor drop paired with a moisture drop points to water stress, while a vigor drop with normal moisture points elsewhere.
How much water can satellite-guided irrigation save?
Published research on satellite-guided irrigation scheduling reports water savings generally in the 17 to 45% range depending on crop type, season, and irrigation system, with some grape-farm case studies in India reporting up to 45% savings without any yield loss.
Which satellites are best for agricultural soil moisture monitoring?
GF-3 and LT-1 SAR provide cloud-free, all-weather moisture readings, GF-6 and CBERS-04/04A cover regional areas with wide swaths for baseline soil-moisture surveys, SuperView-2's 1+8 band sensor adds fine spectral and spatial detail at field scale, and the open-access Sentinel-1 and Sentinel-2 constellations provide free, validated data for research and smaller operations.
How often is new soil moisture data available for a field?
Cadence depends on the source. Programs built on daily-tasked commercial optical and SAR imagery, such as the Henan Province deployment, deliver daily field-scale moisture maps. Open-access Sentinel-1 revisits most areas every few days, and Landsat's thermal data provides a slower, multi-day baseline for CWSI tracking.
Sources and further reading
- China Siwei, 21AT, and CNSA, SuperView-2 (GFDM), GF-6, CBERS-04/04A, GF-3, and LT-1 satellite and sensor specifications
- ESA Copernicus, Sentinel-1 (SAR) and Sentinel-2 mission specifications
- Springer Nature, Discover Water, Sentinel-1 soil moisture validation for small-scale irrigation, North Shewa, Ethiopia, 2026
- PubMed, remote sensing and climate services for farm-scale irrigation management, Western-Central India
- NASA and USGS, Landsat thermal (TIRS-2) mission specifications for CWSI applications
Ready to see your fields from orbit?
Search our live archive or request new tasking over your area, whether optical, multispectral, or SAR imagery. No account needed to get a first estimate.