Is There Satellite Data That Warns of a Bad Wheat Season?
On this page
- Who actually needs this, and why
- The real pain points of sourcing wheat from multiple regions
- Yes, this already exists, GEOGLAM's Crop Monitor for AMIS
- The satellite signals that build the early-warning picture
- Real seasons this kind of monitoring would have flagged early
- A flash drought that overlapped exactly with flowering
- A heatwave in March, an export ban in May
- The worst drought in roughly a century
- How much lead time does this actually buy you
- What this looks like in practice for a multi-region buyer
- 01. Build a watchlist of every sourcing origin
- 02. Track the free macro layer on a standing cadence
- 03. Escalate to high-resolution tasking the moment a region flags Watch or Poor
- 04. Feed the result into procurement and hedging decisions, not just a report
- What we offer
- Frequently asked questions
- Sources and further reading
A practical guide to satellite-based early warning for wheat sourcing risk, who actually needs this, the pain points of tracking multiple growing regions at once, the real monitoring systems and data layers already doing this today, how much lead time it buys you, and what a working early-warning setup looks like in practice.
Quick answer
Yes. GEOGLAM's Crop Monitor for AMIS, run with NASA Harvest and the G20's Agricultural Market Information System, has published a monthly satellite-based condition report on every major wheat, maize, rice, and soybean growing region since 2013, rating each one Favourable, Watch, Poor, or Failure. Underneath that report sit several independent satellite signals, vegetation anomaly (NDVI/VCI), soil moisture, evaporative stress, and precipitation anomaly, that can flag a developing problem 2 to 6 weeks before it is visible on the ground and well before an official government report or export restriction is announced. For sourcing teams buying across several regions at once, the practical answer is combining this free macro layer with commercial high-resolution tasking over your specific supplier areas.
Who actually needs this, and why
This question comes up from a specific set of buyers, each with a slightly different reason to care.
- Grain traders and merchandisers. Need to reposition a book or lock in freight before a regional shortfall becomes public knowledge and the price already moved.
- Flour millers and bakeries. Need confidence in a specific origin's protein and quality profile, not just volume, before committing a milling schedule to it.
- Food and beverage manufacturers. Need to know, months ahead, whether a formulation's primary wheat origin is at risk, so an alternate supplier contract can be started in time.
- Commodity procurement and risk managers. Need an objective, non-political data source to brief leadership with, independent of a producing country's own export-policy announcements.
- Agricultural lenders and trade financiers. Need an early read on a borrower's underlying crop condition before a loan or letter of credit comes due.
What all five have in common, sourcing from more than one region at once turns a single farm-level question into a standing, multi-region monitoring problem.
The real pain points of sourcing wheat from multiple regions
- Official reports lag the damage. A government crop report or export announcement usually confirms what has already happened, not what is about to.
- Export bans arrive with no warning window. India's May 13, 2022 wheat export ban followed a heatwave that had already been visibly damaging the crop since mid-March, nearly two months earlier, a gap in which satellite data was already showing the stress.
- No ground visibility in remote or sensitive growing regions. Parts of the Black Sea region, Central Asia, and South Asia are hard to reach, politically sensitive, or simply too large to assess farm by farm.
- Price volatility compounds the surprise. A sudden export restriction in one major origin routes demand into the remaining origins overnight, spiking price there too.
- Supplier concentration risk is invisible until it isn't. A sourcing book that looks diversified on paper can still be concentrated in regions that all fail from the same weather pattern in the same season.
- Quality risk, not just volume risk. Heat and drought stress during flowering can cut protein content and milling quality even in a season that still produces an average-looking tonnage number.
- Monitoring several regions by hand doesn't scale. Checking weather reports and news for every origin country, every week, is a real workload with no single source of truth.
- Geopolitical and currency overlays complicate the picture further. A weather-driven shortfall and a politically motivated export restriction can look identical from the outside, but call for different hedging responses.
Yes, this already exists, GEOGLAM's Crop Monitor for AMIS
The Group on Earth Observations Global Agricultural Monitoring initiative (GEOGLAM) has run the Crop Monitor for AMIS since 2013, built specifically to track crop conditions in the countries that move global grain markets. It is published monthly and combines satellite remote sensing with ground reports and national and regional expert input, rather than relying on satellite data alone.
| Category | What it signals |
|---|---|
| Exceptional | Conditions well above normal for the stage of the season |
| Favourable | On track, no meaningful concern flagged |
| Watch | An emerging concern worth tracking, not yet a confirmed shortfall |
| Poor | A developing or confirmed below-normal season |
| Failure | Severe, widespread crop loss |
| Out of Season / No Data | Outside the growing window, or insufficient data to assess |
- Covers the major wheat-growing and exporting regions that move global prices, including the Black Sea region (Russia and Ukraine), the EU (led by France), the US Plains, Canada's Prairies, Australia, Argentina, and India.
- Published monthly throughout each region's growing season, every issue publicly archived.
- A separate, related product, the Crop Monitor for Early Warning, runs on the same methodology but focuses on food-insecure and vulnerable regions rather than major exporters.
- Reached its 100th published issue, a track record now running well over a decade.
The satellite signals that build the early-warning picture
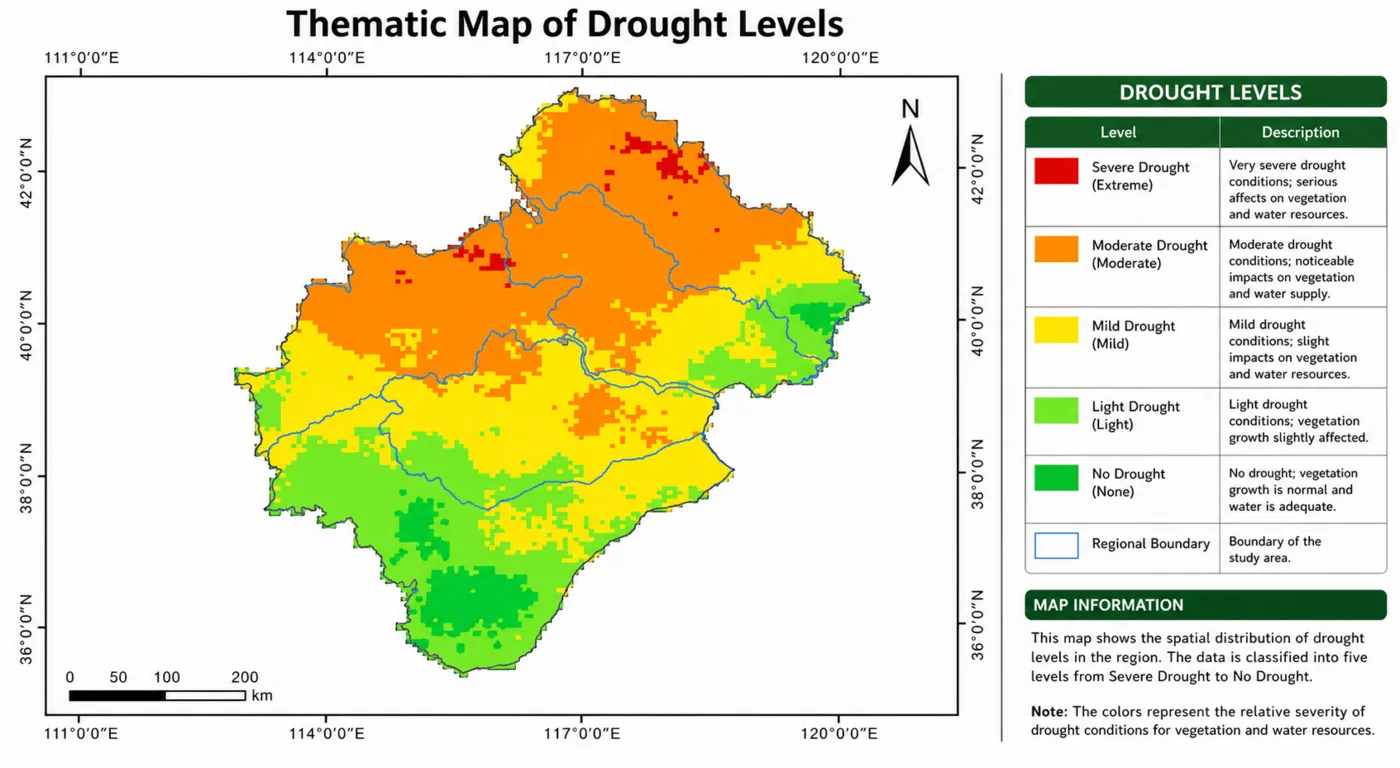
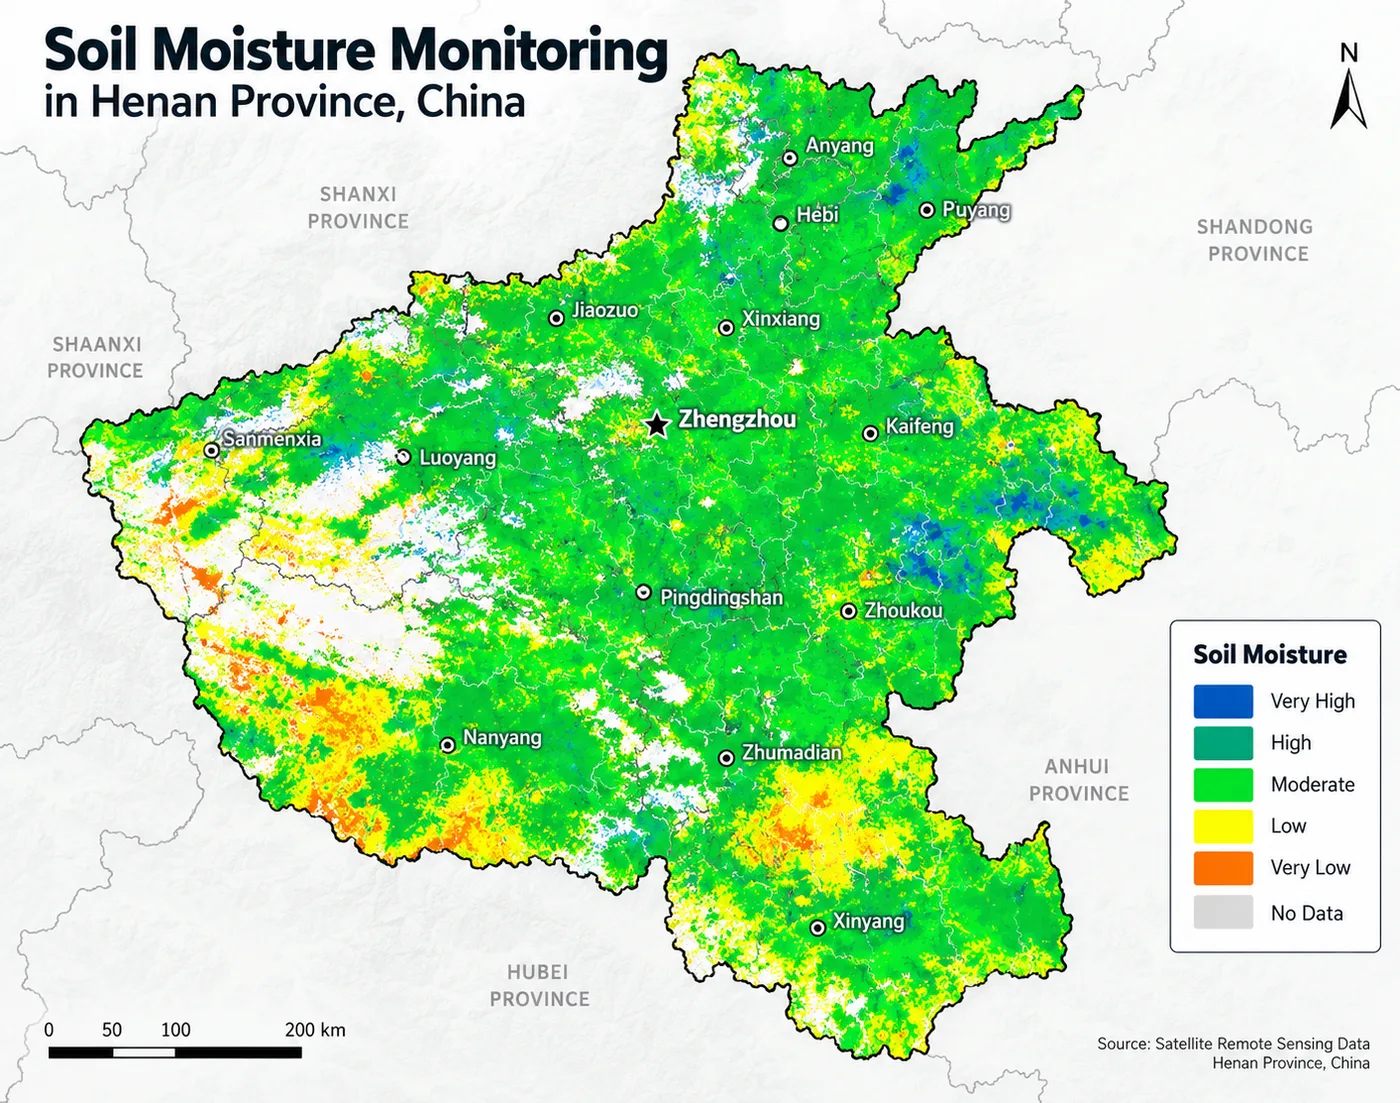
A condition rating is not one number. It's built from several independent satellite-derived signals, and they don't all give the same amount of lead time.
| Signal | What it measures | Typical lead time |
|---|---|---|
| Evaporative Stress Index (ESI) | Falling evapotranspiration, the earliest sign soil moisture is becoming limiting | 1–2 weeks ahead of soil-moisture-confirmed drought, in roughly 60–90% of tracked events |
| Soil moisture (satellite-derived) | Root-zone water availability, directly | Days to 1–2 weeks ahead of visible canopy stress |
| Vegetation Condition Index (VCI / NDVI anomaly) | Current vegetation greenness against the same period's historical min-max; a reading under 35 signals drought stress | Confirms stress as it becomes visible in the canopy, later than ESI but still well ahead of harvest |
| Vegetation Health Index (VHI) | Combines vegetation and temperature stress; a reading under 40 signals vegetation stress from moisture, heat, or both | Similar timing to VCI, with a heat-stress component VCI alone misses |
| Precipitation anomaly (e.g. CHIRPS) | Rainfall deficit against the historical norm for that location and period | Available in near real time, a direct input the other indices build on |
The reason ESI leads the others, evapotranspiration drops the moment soil moisture becomes limiting, while a crop's canopy only shows visible stress after the deficit has already been building for a while. Running these signals together, rather than picking one, is what gives a watch team the widest practical warning window.
Real seasons this kind of monitoring would have flagged early

A flash drought that overlapped exactly with flowering
A severe heatwave and drought hit Russia's wheat belt in mid-2010, with the most rapid intensification landing during the crop's flowering stage, the single most damage-sensitive point in its growth cycle. Wheat production fell more than 50% below average for that marketing year, and Russia enacted a full export ban from August 15, 2010 through July 1, 2011, sending global prices sharply higher. Vegetation anomaly data was already showing extreme water stress across the major producing regions well before the ban was announced.
A heatwave in March, an export ban in May
A sharp, sudden temperature spike hit northwestern and central India's wheat belt in mid-March 2022, during the rabi harvest window, cutting the crop well below the government's initial all-time-high estimate. Wheat procurement ran roughly 50% behind the prior year's pace by mid-May. India banned wheat exports on May 13, 2022, nearly two months after the heat damage began, a gap during which satellite-based condition monitoring was already visible to anyone watching it.
The worst drought in roughly a century
Argentina's 2022–23 season brought its most severe drought in close to 100 years, affecting an estimated 126 million hectares, about 75% of the country's agricultural area. Wheat production was cut roughly in half, from 23 million tons the prior year to 11.5 million tons, with combined losses across wheat, soy, and corn contributing to an estimated $20 billion hit to the national economy, more than 3% of GDP. The drought built over months, exactly the kind of slow-building regional anomaly a standing satellite watch is built to catch early.
How much lead time does this actually buy you
| Stage | Typical timing |
|---|---|
| First satellite anomaly (evaporative stress / soil moisture) | As early as 2–6 weeks before visible canopy stress, depending on crop stage and soil type |
| Vegetation index confirms stress (VCI / NDVI anomaly) | Visible in the canopy, generally some weeks ahead of harvest |
| GEOGLAM Crop Monitor rating shifts to Watch or Poor | Published monthly, through the growing season |
| Official government crop estimate revised down | Often one to several months after the stress began |
| Export restriction or policy response announced | Frequently the last public signal, sometimes months after the first satellite anomaly |
The practical takeaway, by the time an export ban or a sharply revised government estimate makes headlines, the underlying satellite signal has often been visible for weeks or months already, time a sourcing team watching it directly would have had and a team waiting for the news would not. For how this same staged timeline compares to a flood, which runs on a completely different clock, see our guide to how fast satellite data gives insurers a regional flood or drought picture.
Sourcing wheat from more than one region?
Set up a standing watch over your actual supplier regions, with high-resolution verification tasking available the moment a macro signal flags a concern.
What this looks like in practice for a multi-region buyer
01. Build a watchlist of every sourcing origin
List every region actually supplying wheat today, plus the backup regions a contract could shift to, not just the largest single origin. Concentration risk hides in the regions nobody is formally watching.
02. Track the free macro layer on a standing cadence
Follow GEOGLAM Crop Monitor for AMIS monthly, and layer in soil moisture and evaporative stress data for a faster, earlier read between official publication dates.
03. Escalate to high-resolution tasking the moment a region flags Watch or Poor
A free, wide-area signal tells you something is wrong somewhere in a region. Commercial high-resolution imagery over your specific supplier's actual fields confirms the extent and severity on the ground you're actually buying from.
04. Feed the result into procurement and hedging decisions, not just a report
An early flag only has value if it reaches the people deciding whether to extend a contract, diversify an origin, or adjust a hedge, before the market-wide repricing happens.
What we offer
- A multi-region watch, not a single scene. We help set up standing monitoring across every origin in your sourcing book, not a one-off check on a single field.
- Free macro signal, paired with commercial verification. GEOGLAM-style condition data and open soil-moisture and precipitation layers flag where to look; our archive search and new tasking confirm what's actually happening over your specific suppliers' land.
- Multiple resolution tiers on one platform. From 25cm commercial optical down to free wide-area data, matched to whether the question is "is this region at risk" or "how bad is it on this exact farm."
- All-weather radar where cloud cover is the problem. SAR coverage keeps a region's record unbroken through the exact storm or monsoon season when optical data goes dark.
- Instant, transparent pricing. Every archive search or new tasking request on our platform returns a price before you commit, so a verification order doesn't become its own slow procurement process.
- A human on every order. Our team confirms coverage and cloud conditions for your exact area before anything is charged, not an automated black box.
| Free macro monitoring | Commercial verification | |
|---|---|---|
| Best for | Spotting which region is at risk, across an entire country or growing belt | Confirming severity and extent on your specific supplier's actual fields |
| Resolution | 250 m to multiple km, regional and global indices | Down to 25 cm, individual fields and farm infrastructure |
| Cost | Free, publicly published | Priced per km², instant estimate before ordering |
| Cadence | Monthly condition reports, near-real-time index layers | On demand, archive search or new tasking within days |
| Role in the workflow | The trigger, tells you where to look | The confirmation, tells you how bad it actually is |
Key takeaways
- Yes, satellite-based early warning for major wheat growing regions already exists. GEOGLAM's Crop Monitor for AMIS has published a monthly, publicly available condition rating for every major wheat exporter since 2013.
- The underlying signals, evaporative stress, soil moisture, vegetation condition, and precipitation anomaly, can flag a developing problem 2 to 6 weeks before it's visible on the ground, well ahead of an official report or export restriction.
- Real seasons prove the lead-time gap, India's 2022 wheat export ban followed visible heat damage by nearly two months, and Russia's 2010 and Argentina's 2023 droughts both built for months before the resulting export ban or economic damage made headlines.
- Sourcing from multiple regions turns this from a one-time check into a standing workflow, a watchlist, a monthly macro review, and high-resolution verification tasking the moment a region flags Watch or Poor.
- Free macro data tells a buyer where to look; commercial high-resolution imagery over the actual supplier's fields tells them how bad it is, and a working setup uses both together.
Frequently asked questions
Is there satellite data that gives early warning when a major wheat growing region is heading into a bad season?
Yes. GEOGLAM's Crop Monitor for AMIS publishes a monthly, satellite-based condition rating, Favourable, Watch, Poor, or Failure, for every major wheat, maize, rice, and soybean growing region since 2013. Underlying signals such as evaporative stress, soil moisture, and vegetation condition anomaly can flag a developing problem 2 to 6 weeks before it is visible on the ground.
What is GEOGLAM Crop Monitor for AMIS?
It's a monthly crop condition report covering the countries that move global grain markets, run by the Group on Earth Observations Global Agricultural Monitoring initiative (GEOGLAM) with NASA Harvest for the G20's Agricultural Market Information System (AMIS). It combines satellite remote sensing with ground reports and expert input, and has been published since 2013.
How early can satellites detect a drought before it affects wheat yield?
The Evaporative Stress Index typically leads soil-moisture-confirmed drought by 1 to 2 weeks in roughly 60 to 90% of tracked events, because evapotranspiration falls as soon as soil moisture becomes limiting, before visible canopy stress develops. Vegetation indices like VCI and NDVI confirm the stress later, once it's visible in the crop canopy, but still generally well ahead of harvest.
What satellite indicators are used to monitor wheat crop health across regions?
The core indicators are the Vegetation Condition Index (VCI, with readings below 35 signaling drought stress), the Vegetation Health Index (VHI, below 40 signaling stress from moisture or heat), evaporative stress index data, satellite-derived soil moisture, and precipitation anomaly products such as CHIRPS. Each one is produced at regional to global scale and updated on a regular cadence.
Can satellite monitoring predict an export ban like India's 2022 wheat ban?
Satellite data can't predict a government's policy decision directly, but it can flag the underlying crop stress well before that decision is announced. India's heatwave-driven wheat damage became visible in mid-March 2022, and the export ban followed on May 13, 2022, nearly two months later, a gap during which satellite condition data was already showing the stress.
How do companies that source wheat from multiple countries manage crop risk?
By building a standing watchlist of every sourcing origin, tracking free monthly macro condition data like GEOGLAM's Crop Monitor alongside near-real-time soil moisture and evaporative stress layers, and escalating to commercial high-resolution satellite tasking over their specific suppliers' fields whenever a region's rating shifts to Watch or Poor.
Is satellite crop monitoring data free or does it require a paid subscription?
The regional and global early-warning layer is free and publicly published, including GEOGLAM's Crop Monitor reports and open soil-moisture and precipitation datasets. Confirming the extent and severity of a flagged problem on a specific supplier's actual fields generally requires commercial high-resolution imagery, priced per square kilometre.
What major wheat growing regions does satellite crop monitoring cover?
GEOGLAM's Crop Monitor for AMIS covers the regions that move global wheat markets, including the Black Sea region (Russia and Ukraine), the European Union led by France, the US Plains, Canada's Prairies, Australia, Argentina, and India.
Sources and further reading
- GEOGLAM Crop Monitor for AMIS, monthly crop condition reports since 2013, and the related Crop Monitor for Early Warning
- NASA Harvest, GEOGLAM Crop Monitor program reporting and 100th-issue coverage
- Kogan, F., 1995, and subsequent literature, Vegetation Condition Index and Vegetation Health Index methodology
- NOAA / NESDIS and USGS LP DAAC, Evaporative Stress Index (ESI) methodology and flash-drought lead-time studies
- USDA FAS reporting, India wheat production and the May 13, 2022 export ban
- Reporting on the 2010 Russian wheat drought, flowering-stage crop impact, and the 2010–2011 export ban
- Reporting on Argentina's 2022–23 drought, wheat production, and national economic impact
For how this same satellite data builds a yield estimate once a season is confirmed, see our guide to satellite imagery for agricultural yield estimation, and for how the same indices support insurance payouts, see the best satellite data for crop risk underwriting.
Need standing visibility across your wheat sourcing regions?
Set up a multi-region monitoring watch, with high-resolution verification tasking ready the moment a macro signal flags concern. No account needed for a first estimate.