How Quickly Can Satellite Data Give Insurers a Regional Crop-Loss Picture?
On this page
- Why flood and drought run on completely different clocks
- Flood, a regional picture in hours to days
- 01. SAR images through the storm, immediately
- 02. Processing turns a scene into a waterline in about an hour
- 03. A full regional package lands within 24 to 48 hours
- Drought, no single day to count from
- What actually speeds the pipeline up
- How this compares to a traditional manual adjustment
- What we offer
- Frequently asked questions
- Sources and further reading
A practical guide to how fast satellite data actually gives insurers a regional crop-loss picture after a flood or drought, why the two perils run on completely different clocks, the real processing and tasking timelines behind each one, and how that speed compares to a traditional manual loss adjustment.
Quick answer
It depends on which peril. Flood is a sudden, dated event, SAR satellites can map a regional inundation extent within 24 to 48 hours of tasking, with the processing step alone, once a scene is captured, running as fast as 1 to 1.5 hours on a platform like Siwei's Earth Cloud. Drought has no single trigger date, so "quickly" means something different, the earliest signals (evaporative stress, soil moisture) can flag a developing problem 1 to 2 weeks before it's visible, and a confirmed regional severity picture builds over 2 to 6 weeks as vegetation-anomaly data accumulates across the growing season. Both are dramatically faster than a traditional manual adjustment cycle, which can take up to two weeks just to detect a loss event in the first place.
Why flood and drought run on completely different clocks
The question "how quickly" assumes one clock. Flood and drought don't share one.
| Flood | Drought | |
|---|---|---|
| Event type | Sudden onset, one dated event | Slow onset, no single trigger date |
| What "fast" means | Time from the event to a delivered inundation map | Time for the anomaly to build to a confirmed severity level |
| Main sensor | SAR, images straight through the storm clouds causing the flood | Optical vegetation and moisture indices, built from a rolling baseline |
| Realistic regional picture | 24 to 48 hours | 2 to 6 weeks from first signal to a confirmed regional rating |
Flood, a regional picture in hours to days
A flood has an exact start time, which is what makes it possible to move fast, there's a clear "before" and "after" to compare.
01. SAR images through the storm, immediately
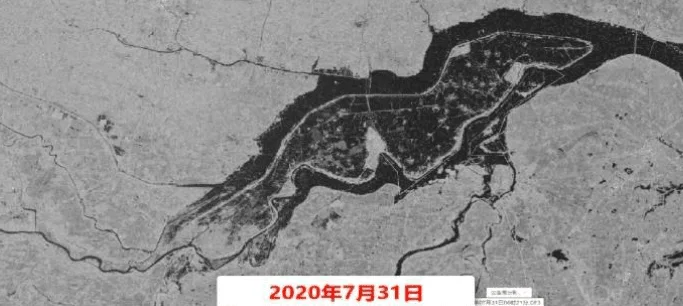
Synthetic Aperture Radar, such as C-band GF-3 or L-band LT-1, transmits its own microwave signal and reads the return regardless of cloud cover, rain, or darkness. It doesn't wait for the storm to clear the way an optical satellite does, it images the flood while it's still happening.
02. Processing turns a scene into a waterline in about an hour
Once a scene is captured, automated cloud-processing platforms built for this, such as China Siwei's Earth Cloud (built to handle roughly 50 TB of imagery a day), turn it into an analysis-ready delivered file in about 1 hour, with a typical 1.5-hour response time from request to action. Satellite tasking commands reach ground stations worldwide within about 3 hours of a request, so the gap between "we need this area imaged" and "the satellite is tasked" is short too.
03. A full regional package lands within 24 to 48 hours
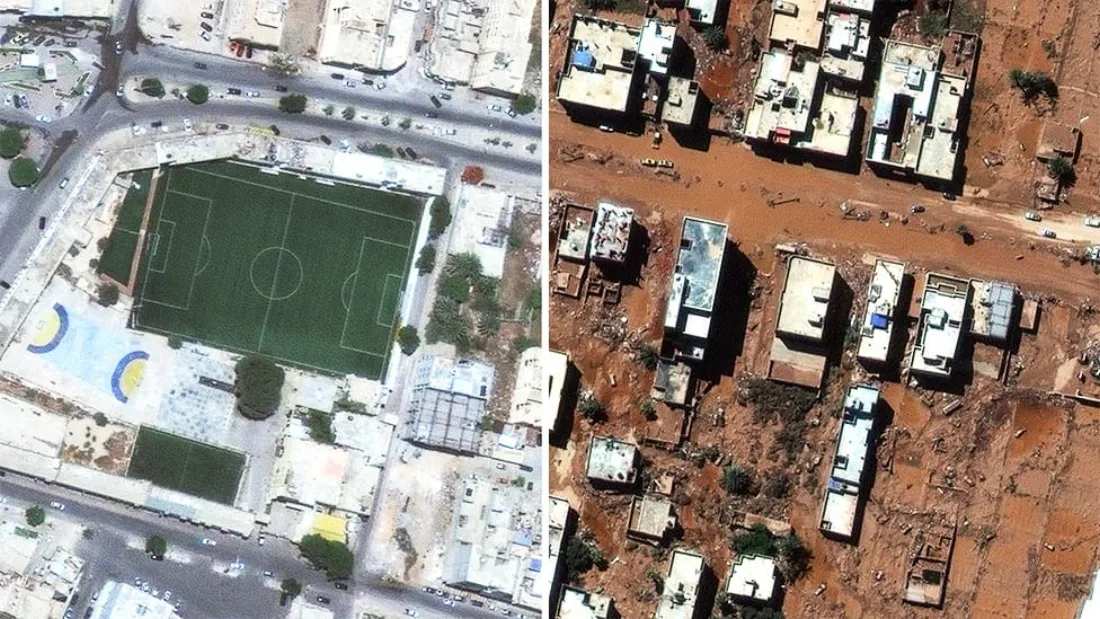
Stack the tasking, acquisition, and processing steps together and a delivered, analysis-ready flood map is realistic within 24 to 48 hours of the event, the same ceiling demonstrated in the 2023 Derna, Libya flood response, where analysis-ready high-resolution imagery reached responders within 24 hours.
For non-emergency claims, where a full multi-sensor regional package rather than a single rapid scene is the goal, 4 to 7 days is the realistic window, since it allows for cloud-clearing, multiple pass angles, and cross-referencing optical imagery once visibility returns alongside the SAR-derived extent.
Drought, no single day to count from
Drought builds. There's no equivalent to a flood's first inundated pixel, so the honest answer to "how quickly" is a staged one.
| Stage | Typical timing |
|---|---|
| Evaporative Stress Index (ESI) anomaly, the earliest signal | 1 to 2 weeks ahead of soil-moisture-confirmed drought, in roughly 60 to 90% of tracked events |
| Soil moisture anomaly confirms a developing deficit | Days to 1 to 2 weeks ahead of visible canopy stress |
| Vegetation Condition Index (VCI) confirms canopy-level stress | Visible in the canopy, weeks into the event |
| Regional condition rating (e.g. GEOGLAM Crop Monitor) updates | Published monthly through the growing season |
| Confirmed, severe regional picture | Typically 2 to 6 weeks from first signal, depending on crop and soil type |
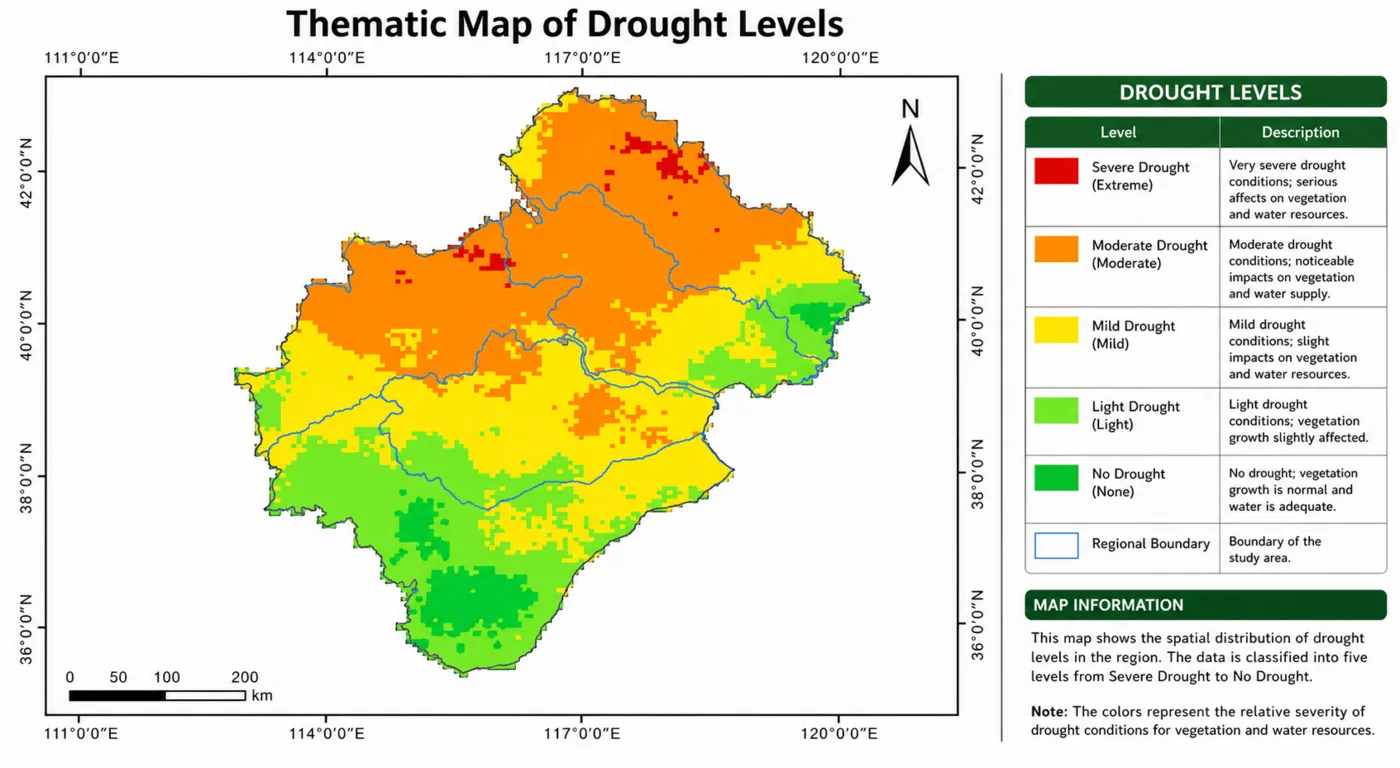
This staged build-up, and the specific signals behind each row, is covered in full in our guide to early-warning satellite data for wheat growing regions. The short version for insurers, an early Watch-level signal is available in days to a couple of weeks, but a confirmed, insurable regional severity picture realistically takes several weeks to build, not a single overnight turnaround.
Need a regional loss picture after a flood or drought event?
Task emergency SAR coverage for a flood, or pull a multi-year vegetation and moisture baseline for a developing drought, with an instant price estimate.
What actually speeds the pipeline up
- All-weather SAR for flood. GF-3 and LT-1 image regardless of the cloud cover a storm itself produces, removing the single biggest delay an optical-only approach would face.
- High daily revisit for both perils. Constellations like SuperView Neo revisit up to 25 times a day across a combined 30 million km² of daily coverage, so the wait for a usable pass is rarely the bottleneck once an area is tasked.
- Automated cloud processing. Platforms built specifically for fast turnaround, rather than a general-purpose imagery archive, are what get a captured scene into an analyst's hands in about an hour instead of days.
- A rolling historical baseline, for drought specifically. A Vegetation Condition Index only works because decades of prior-season data already exist to compare against, there's no separate step to build that baseline from scratch each time.
How this compares to a traditional manual adjustment
| Traditional manual adjustment | Satellite-based assessment | |
|---|---|---|
| Flood, regional picture | Field visits scheduled after access roads clear, often days to weeks | 24 to 48 hours from tasking, through the clouds, via SAR |
| Drought, regional picture | Confirmed once visible crop failure is widely reported | Early signal in 1 to 2 weeks, confirmed picture in 2 to 6 weeks |
| Loss-event detection generally | Up to two weeks for a traditional adjustment cycle to confirm a loss occurred at all | Reported at roughly 48 hours for a satellite-integrated crop-cutting process |
| Coverage | Limited by adjuster travel and access | An entire regional crop belt in the same pass |
The practical effect for insurers is twofold, a faster first read on how bad a regional event actually is, and an objective, location-verified record that the same satellite-based crop-cutting integration is reported to cut manual sampling costs by roughly 40% against the traditional cycle.
What we offer
- Emergency SAR tasking for active flood events, imaging through the same storm clouds causing the flood, with analysis-ready delivery targeted within 24 to 48 hours.
- Multi-year optical and moisture baselines for drought, so a developing season gets measured against the same dekad across decades, not guessed at.
- Both perils on one platform, archive search and new tasking, optical and SAR, with an instant per-km² price estimate before you commit.
- Regional coverage in one pass, an entire crop belt assessed together rather than farm by farm.
- A human confirms every order, checking coverage and conditions for your exact area before anything is charged.
Key takeaways
- Flood and drought run on different clocks. Flood is a dated event with a clear before-and-after; drought has no single trigger date and builds over weeks instead.
- For flood, SAR images straight through the storm clouds causing it, and a regional inundation map is realistic within 24 to 48 hours of tasking, the same ceiling demonstrated in the 2023 Derna, Libya response.
- Processing alone, once a scene is captured, can run in about 1 to 1.5 hours on a platform like Siwei's Earth Cloud, with tasking commands reaching ground stations worldwide within roughly 3 hours.
- For drought, the earliest signal (evaporative stress) can appear 1 to 2 weeks ahead of soil-moisture-confirmed drought, but a confirmed regional severity picture realistically takes 2 to 6 weeks to build.
- Both are dramatically faster than a traditional manual loss adjustment, which can take up to two weeks just to confirm a loss event occurred, before any regional picture is even assembled.
Frequently asked questions
How quickly after a flooding or drought event can satellite data give insurers a regional picture of likely crop losses?
It depends on the peril. For flood, SAR satellites can deliver a regional inundation map within 24 to 48 hours of tasking, since radar images straight through the storm clouds causing the flood. For drought, there's no single trigger date, early signals can appear 1 to 2 weeks ahead of soil-moisture-confirmed drought, but a confirmed regional severity picture realistically takes 2 to 6 weeks to build as vegetation-anomaly data accumulates.
How fast can satellites map a flood for insurance purposes?
A full regional flood-extent package is realistic within 24 to 48 hours of tasking. Processing alone, once a SAR scene is captured, can run in about 1 to 1.5 hours on a fast cloud-processing platform, and the 2023 Derna, Libya flood response delivered analysis-ready imagery within 24 hours.
Why can't drought be assessed as fast as a flood?
A flood has an exact start time to measure from. Drought builds gradually with no single trigger date, so a regional severity rating has to accumulate from a rolling vegetation and moisture anomaly baseline over several weeks, rather than being captured in one before-and-after comparison.
What satellite technology maps floods through cloud cover?
Synthetic Aperture Radar (SAR), such as C-band GF-3 or L-band LT-1, transmits its own microwave signal and reads the return regardless of cloud cover, rain, or darkness, which is what lets it image an active flood while the storm causing it is still ongoing.
How early can satellite data detect a developing drought?
The Evaporative Stress Index typically leads soil-moisture-confirmed drought by 1 to 2 weeks in roughly 60 to 90% of tracked events, because evapotranspiration falls as soon as soil moisture becomes limiting, before visible canopy stress develops.
How does satellite-based loss assessment compare in speed to a manual field adjustment?
A traditional manual adjustment cycle can take up to two weeks just to confirm a loss event occurred, before any regional picture is assembled, and is limited by adjuster travel and site access. Satellite-based crop-cutting integration is reported to detect a loss event in roughly 48 hours and cut manual sampling costs by about 40%.
Can satellite data give a regional crop-loss picture, not just one field?
Yes. A single satellite pass covers an entire regional crop belt at once, both SAR flood-extent mapping and optical or moisture-based drought severity classification are produced at regional to national scale, not field by field, which is what makes a fast regional picture possible in the first place.
Sources and further reading
- eoPortal, Gaofen-3 (GF-3) and LT-1 / Lutan-1 SAR constellation mission specifications
- China Siwei, Earth Cloud processing platform capacity and turnaround specifications
- Reporting on the 2023 Derna, Libya flood response and satellite imagery delivery timelines
- NOAA / NESDIS and USGS LP DAAC, Evaporative Stress Index (ESI) methodology and flash-drought lead-time studies
- GEOGLAM Crop Monitor for AMIS, monthly regional crop condition reporting methodology
- Kogan, F., 1995, and subsequent literature, Vegetation Condition Index methodology
- Crop insurance industry reporting on satellite-integrated crop-cutting cost and speed versus manual adjustment
For the full satellite-data toolkit insurers use when a county's own yield history is incomplete, see our guide to the best satellite data for crop risk underwriting, and for how this kind of imagery holds up as actual claims evidence, see satellite imagery as insurance claims evidence.
Assessing a regional flood or drought event right now?
Get emergency SAR tasking or a multi-year drought baseline over your area of interest, with an instant price estimate before you order.