How to Tell Nitrogen Loss From Water Stress Using Satellite Data
On this page
- Nitrogen Deficiency and Water Stress Hit Different Parts of the Plant
- Why Red Edge Catches Nitrogen Early, and SWIR Catches Water Early
- Spectral Indices for Nitrogen and Chlorophyll
- 01. NDRE, Normalized Difference Red Edge Index
- 02. CCCI, Canopy Chlorophyll Content Index
- 03. GNDVI, Green Normalized Difference Vegetation Index
- 04. NNI, Nitrogen Nutrition Index
- Spectral Indices for Water Stress
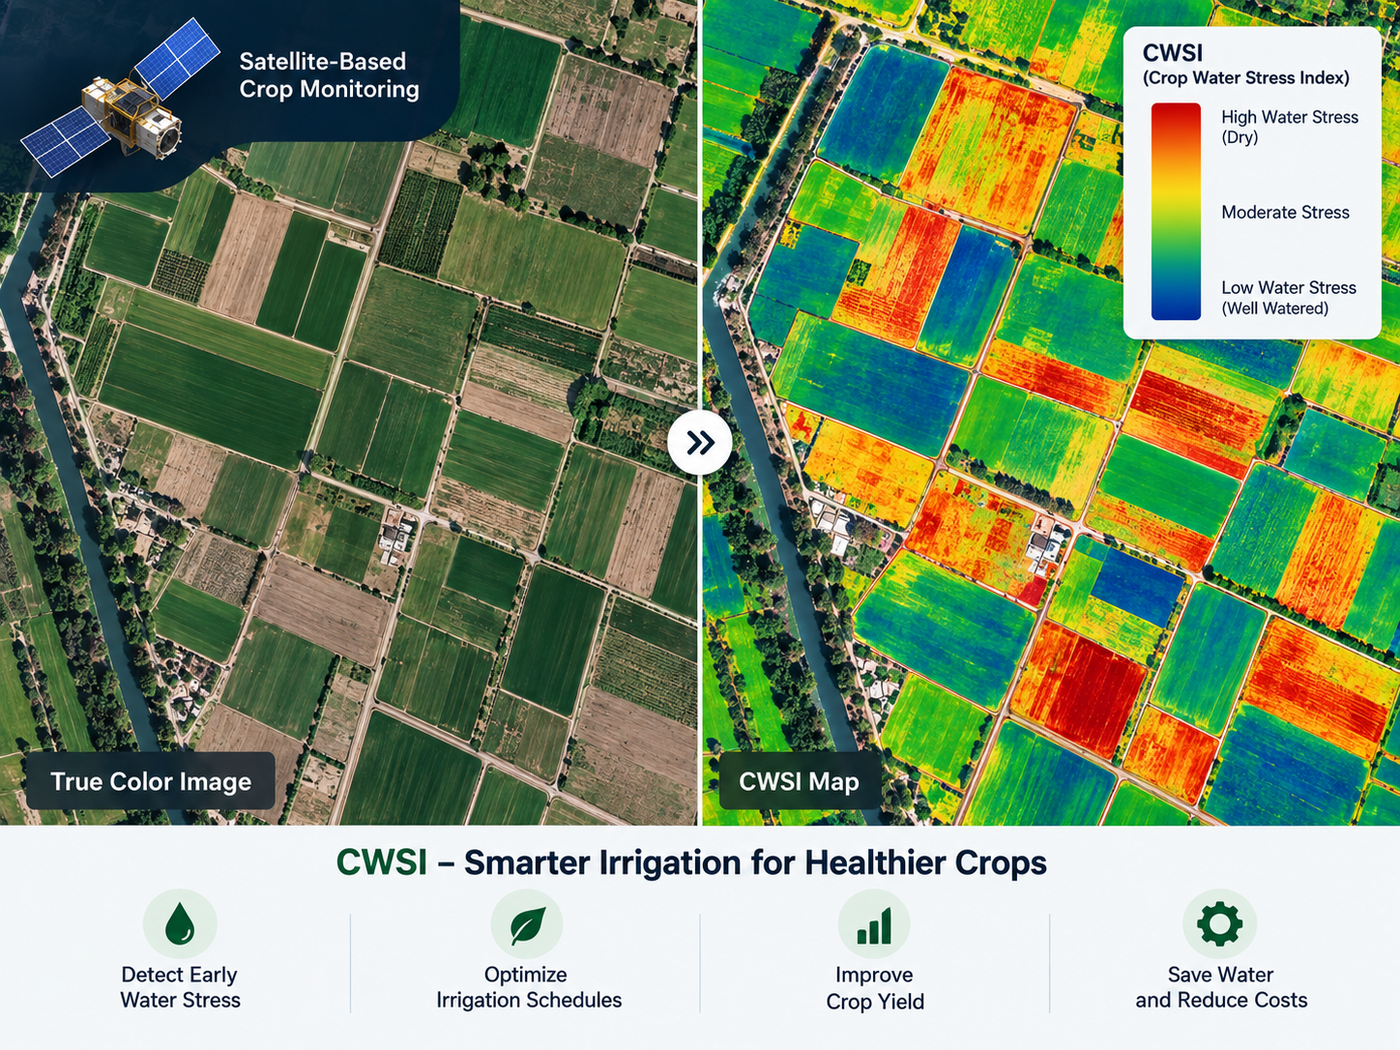
- 01. CWSI, Crop Water Stress Index
- 02. NDWI and SWIR Moisture Ratios
- Which Satellite to Use for Each Stress Type
- Step-by-Step, Telling the Two Stresses Apart
- 01. Run NDVI first
- 02. Run NDRE on the flagged zones
- 03. Run CWSI or a SWIR moisture ratio on the same zones
- 04. Compare the two results
- Accessing and Processing the Data
- Frequently asked questions
- Sources and further reading
Quick answer
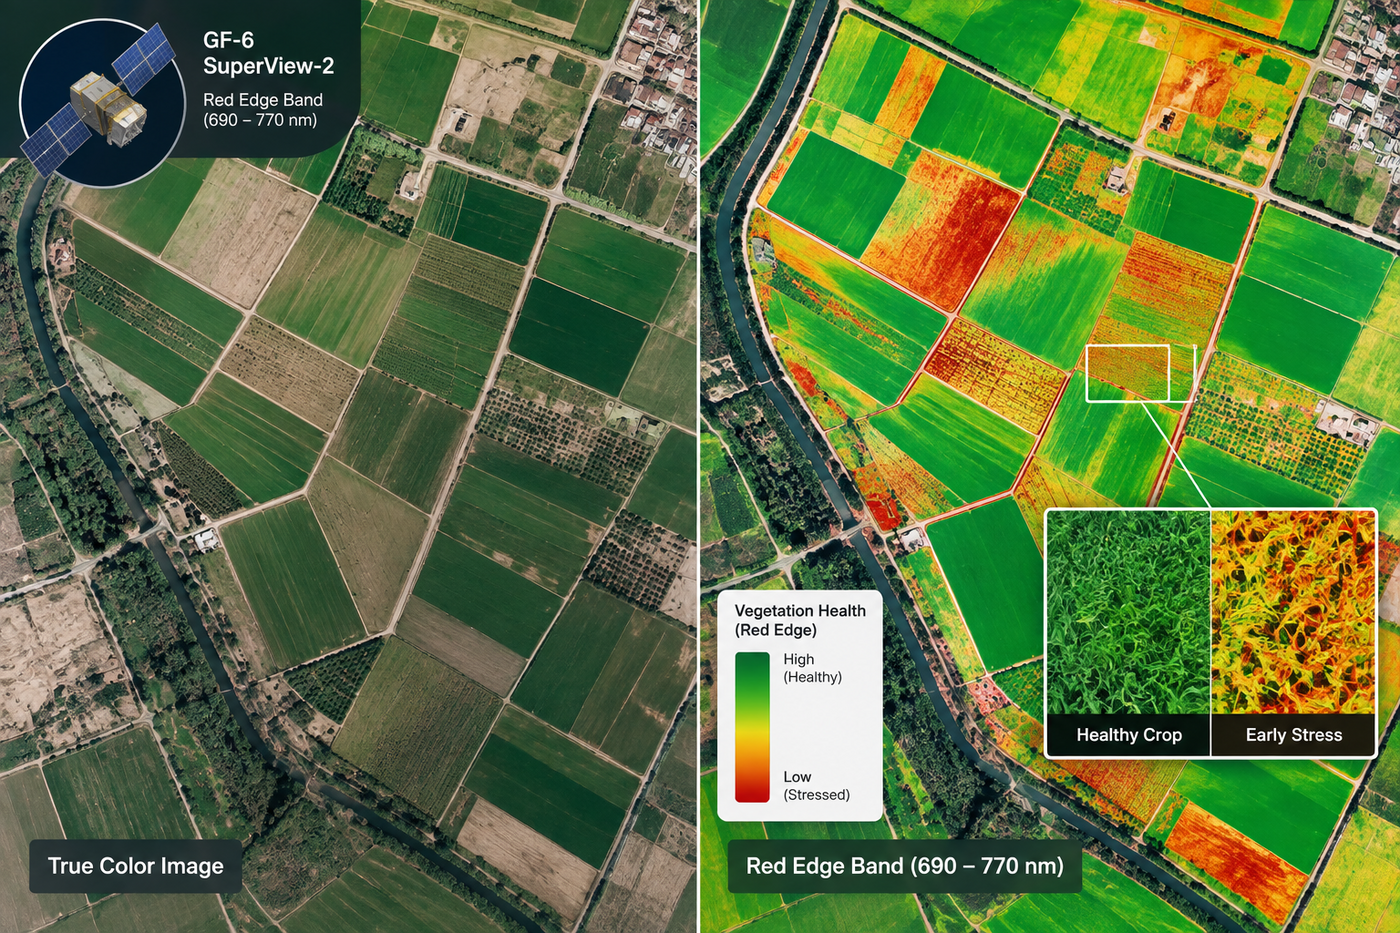
Nitrogen deficiency and water stress hit a crop in two different ways, so they show up in two different parts of the light spectrum. Nitrogen loss breaks down leaf chlorophyll, which shows up first in the Red Edge band (690 to 770 nm), tracked with the NDRE index. Water stress closes leaf pores and heats up the canopy, which shows up in Short-Wave Infrared (SWIR) reflectance and thermal bands, tracked with the CWSI index. Pull both index maps for the same field on the same day. Low NDRE with a normal, cool canopy points to nitrogen. A normal NDRE with a hot, SWIR-dry canopy points to water. Sensors like SuperView-2, GF-6, GF-4, and GF-5B each cover a piece of this picture, and the sections below walk through which one to use and how to read the result.
Nitrogen Deficiency and Water Stress Hit Different Parts of the Plant
Both stresses can turn a field pale or stunted. But they start in different places inside the leaf, which is exactly what makes them separable from orbit.
| Stress type | What happens inside the plant | Band that catches it first | Index to use |
|---|---|---|---|
| Nitrogen deficiency | Chlorophyll breaks down, photosynthesis slows | Red Edge (690 to 770 nm), Yellow (590 to 630 nm) | NDRE, CCCI, GNDVI |
| Water stress | Leaf pores close, cell water drops, canopy heats up | SWIR, NIR2 (860 to 1040 nm), thermal (3.5 to 4.1 µm) | CWSI, NDWI |
- Nitrogen deficiency. A plant short on nitrogen can't build enough chlorophyll. Chlorophyll is what absorbs red light for photosynthesis, so a nitrogen-short leaf reflects more Red Edge and Yellow light than a healthy one, weeks before it turns visibly pale.
- Water stress. A thirsty plant closes its stomata (leaf pores) to save water. That stops evaporative cooling, so the canopy heats up, a change thermal and MWIR bands pick up directly. Less water in the leaf also changes how it reflects SWIR light.
Why Red Edge Catches Nitrogen Early, and SWIR Catches Water Early
- Standard red light stops at the top leaf layer. In a thick, healthy canopy, so much red light gets absorbed right at the surface that plain NDVI maxes out and stops changing, even as the crop keeps improving or declining underneath. This is called NDVI saturation.
- Red Edge light goes deeper. It passes further into the leaf and canopy before bouncing back, so it keeps responding to chlorophyll changes long after NDVI has flatlined. That's why Red Edge, not red, is the band nitrogen monitoring is built around.
- Water absorbs SWIR light strongly. A well-hydrated leaf absorbs more SWIR energy; a dry one reflects more of it back. That reflectance shift is measurable before the plant shows any color change at all.
- A hot canopy means closed stomata. Thermal and MWIR sensors read canopy temperature directly. A canopy running hotter than the surrounding air is a plant that has shut its pores to conserve water, a mechanical response, not a color change.
Need Red Edge and SWIR data over your own fields?
Task SuperView-2 for sub-meter Red Edge and NIR2 bands, or GF-6 for wide-area Red Edge coverage across a whole growing region. See our agriculture satellite imagery service for ready-made vegetation-index delivery and pricing.
Spectral Indices for Nitrogen and Chlorophyll
01. NDRE, Normalized Difference Red Edge Index
NDRE = (NIR − Red Edge) ÷ (NIR + Red Edge)
NDRE tracks chlorophyll in the upper and mid canopy. A falling NDRE on a field with normal soil moisture is the clearest single sign of nitrogen deficiency, because it isolates chlorophyll content from the canopy-saturation problem that limits plain NDVI.
02. CCCI, Canopy Chlorophyll Content Index
CCCI combines NDVI (how much plant is there) with NDRE (how much chlorophyll is in it), so it separates a thin-but-healthy canopy from a thick-but-nitrogen-starved one. It's most useful from mid-season onward, once the canopy has enough leaf area for NDVI to mean something.
03. GNDVI, Green Normalized Difference Vegetation Index
GNDVI = (NIR − Green) ÷ (NIR + Green)
GNDVI swaps red for green, which makes it a bit more sensitive to chlorophyll shifts in mature, closed canopies than standard NDVI, though less targeted than NDRE. It works well as a second check alongside NDRE, not a replacement for it.
04. NNI, Nitrogen Nutrition Index
NNI compares the nitrogen a crop actually has to the minimum it needs at its current biomass, using a crop-specific reference curve built from field sampling. NNI of 1 means adequate nitrogen, below 1 means deficient, above 1 means surplus. It's not a simple two-band formula like NDRE, it needs a biomass estimate and a calibrated curve for the crop in question, so treat it as a validation step on top of NDRE rather than a first-pass satellite read.

Spectral Indices for Water Stress
01. CWSI, Crop Water Stress Index
CWSI compares actual canopy temperature to two reference lines, a "well-watered" baseline and a "fully stressed, pores shut" baseline, both adjusted for the air's vapor pressure deficit that day. CWSI near 0 means the canopy is as cool as a well-watered crop should be. CWSI near 1 means it's as hot as a crop with no water left to transpire. This approach traces back to agronomist Sherwood Idso's original 1981 baseline method and is still the standard today.
02. NDWI and SWIR Moisture Ratios
NDWI = (NIR − SWIR) ÷ (NIR + SWIR)
NDWI and similar SWIR-based ratios measure liquid water held inside the leaf itself, independent of canopy temperature. A dropping NDWI with no change in canopy heat often means early-stage drought stress, before the plant has started closing stomata hard enough to show up on a thermal read.
Which Satellite to Use for Each Stress Type
| Satellite | Resolution | Relevant bands | Best for |
|---|---|---|---|
| SuperView-2 | 0.42 m | 1 panchromatic + 8 multispectral, incl. Purple, Yellow (590 to 630 nm), Red Edge (710 to 750 nm), NIR1, NIR2 (860 to 1040 nm) | The one sensor that covers both sides, Red Edge and Yellow for nitrogen, NIR2 for early moisture, at sub-meter, per-plant detail |
| GF-6 | 2 m pan / 8 m MS | Dual Red Edge (690 to 730 nm and 730 to 770 nm), Purple, Yellow, standard RGB + NIR | Regional nitrogen monitoring across a whole growing area |
| Sentinel-2 | 10 to 20 m | Red Edge, NIR, SWIR, free access | Baseline, low-cost screening before a tasked high-res order |
| GF-4 | 50 m VNIR / 400 m MWIR | Geostationary MWIR (3.5 to 4.1 µm), updates every 20 seconds | Canopy temperature and water-stress tracking across a growing day |
| GF-5B (VIMS) | 20 m VIS/SWIR, 40 m thermal | 12-band VIMS, SWIR plus thermal | SWIR moisture and thermal water-stress reads at regional scale |
| ZY1-02D | 30 m | 166-band AHSI hyperspectral, 0.45 to 2.5 µm | Fine-grained biochemical analysis, research-grade nitrogen and moisture modeling |
Two of these satellites carry more than one instrument worth knowing apart. GF-5B flies its 12-band VIMS sensor for SWIR and thermal reads, a separate instrument from the 330-band AHSI hyperspectral payload the same satellite carries for fine mineral and biochemical work, covered in our guide to hyperspectral mineral exploration. ZY1-02D's own 166-band AHSI imager is the one to reach for when a field's stress signal is unclear from NDRE and CWSI alone and a lab-grade spectral breakdown is worth the coarser 30 m pixel size.
Match the sensor to the question you're actually asking
Thermal drift across a whole region needs GF-4. A single problem field needs SuperView-2. Our agriculture satellite imagery service delivers NDRE, CWSI, and the other index layers already processed, not just raw bands.
Step-by-Step, Telling the Two Stresses Apart
01. Run NDVI first
Start with plain NDVI to map overall plant health and biomass. This tells you where to look, not what's wrong. Treat it as a screening layer, not a diagnosis.
02. Run NDRE on the flagged zones
Calculate NDRE for the low-NDVI areas. A clearly falling NDRE is your first nitrogen signal.
03. Run CWSI or a SWIR moisture ratio on the same zones
Pull canopy temperature or SWIR reflectance for the same spot, same date. This is the water-stress check.
04. Compare the two results
| NDRE | CWSI / SWIR moisture | Likely cause |
|---|---|---|
| Low | Normal | Nitrogen deficiency |
| Normal | High stress | Water stress |
| Low | High stress | Both, water stress often comes first and nitrogen uptake follows once soil dries |
| Normal | Normal | Look at pest or disease causes instead |
That fourth row matters in the field. Dry soil cuts off a root's ability to take up nitrogen even when there's enough in the ground, so a water-stressed field often develops a secondary nitrogen signal within a week or two. If both indices are abnormal, irrigation or rainfall is usually the first fix to try, then recheck NDRE once soil moisture is back to normal. For the full range of other causes a clean NDRE and clean CWSI still leave on the table, see our guide to diagnosing crop stress from drought, pest, and disease.
Accessing and Processing the Data
- Pick resolution by field size. Sub-field, per-plant detail needs SuperView-2's 0.42 m. A whole growing region needs GF-6's wider 8 m swath, or free 10 m Sentinel-2 as a first screening pass.
- Archive or tasking. Archive imagery over XRTech's fleet goes back to 1999 for some sensors. A new capture over a specific field and date can be tasked directly through XRTech's own ordering platform.
- File formats. Analysis-ready, orthorectified surface reflectance comes as 8-bit, 11-bit, or 16-bit GeoTIFF, plus SHP or DWG vector layers for GIS import.
- Timing matters for CWSI. Canopy temperature needs a clear, consistent time of day, typically midday, to compare against the baseline. A cloudy or early-morning pass will throw the reading off.
Key takeaways
- Nitrogen deficiency shows up in Red Edge and Yellow bands, tracked with NDRE, CCCI, or GNDVI. Water stress shows up in SWIR and thermal bands, tracked with CWSI or NDWI.
- Low NDRE with a normal, cool canopy points to nitrogen. A normal NDRE with a hot, SWIR-dry canopy points to water. Both abnormal usually means water stress first, with nitrogen uptake dropping as a result.
- Red Edge works for nitrogen because it penetrates deeper into the canopy than red light, avoiding the saturation problem that limits plain NDVI in thick crops.
- SuperView-2 and GF-6 cover Red Edge for nitrogen mapping at sub-meter and regional scale. GF-4's thermal sensor and GF-5B's SWIR/thermal VIMS instrument cover water stress. ZY1-02D's 166-band hyperspectral imager handles fine-grained cases needing a full spectral breakdown.
- Run NDVI first to flag problem zones, then NDRE and CWSI together on those zones to split a nitrogen cause from a water cause.
Frequently asked questions
How can I tell nitrogen deficiency from water stress on satellite imagery?
Compare two index maps from the same date. NDRE tracks chlorophyll and falls with nitrogen deficiency. CWSI tracks canopy temperature and rises with water stress. Low NDRE with a normal, cool canopy points to nitrogen. A normal NDRE with a hot canopy points to water.
What is NDRE and why is it better than NDVI for nitrogen?
NDRE is the Normalized Difference Red Edge Index, calculated as (NIR minus Red Edge) divided by (NIR plus Red Edge). It's better than NDVI for nitrogen because Red Edge light penetrates deeper into the canopy than red light, so it keeps responding to chlorophyll changes in dense crops after NDVI has already maxed out and stopped changing.
What is CWSI and how is it calculated?
CWSI, the Crop Water Stress Index, compares a canopy's actual temperature to two reference baselines, a well-watered baseline and a fully stressed, no-transpiration baseline, both adjusted for the day's vapor pressure deficit. A CWSI near 0 means the crop is transpiring normally. A CWSI near 1 means it has shut its stomata and stopped cooling itself.
What satellite bands show water stress before it's visible?
Short-Wave Infrared (SWIR) reflectance and thermal or MWIR bands both catch water stress early. SWIR tracks liquid water inside the leaf directly. Thermal and MWIR bands catch the canopy heating up once the plant closes its stomata, before any visible wilting.
Can one satellite image show both nitrogen and water stress?
A single multispectral image can carry the bands for both, but reading them requires calculating two separate indices from it, NDRE for nitrogen and a SWIR ratio for water, and a thermal pass for CWSI if the sensor carries a thermal band. SuperView-2 covers Red Edge and NIR2 for both. GF-4 and GF-5B add dedicated thermal and SWIR coverage.
How often do I need new images to catch nitrogen stress early?
Weekly to biweekly during active growth stages catches nitrogen deficiency before it becomes visible, since NDRE starts falling well ahead of leaf yellowing. Water stress can develop faster, within days under heat or drought, so a thermal or CWSI check during a dry spell should run more frequently than the nitrogen check.
What's the first step after spotting a stressed zone on satellite imagery?
Run NDRE and CWSI (or a SWIR moisture ratio) on the flagged zone for the same date. The combination tells you whether to investigate fertilizer history and soil nitrogen first, or irrigation and rainfall first, before sending anyone out to the field to confirm.
For the broader set of causes behind a stressed field, see our guide to diagnosing crop stress from drought, pest, and disease. For how Red Edge and NIR bands work across the full multispectral picture, see what multispectral imaging actually captures.
Sources and further reading
- Idso, S.B. et al., non-water-stressed baseline method for Crop Water Stress Index, foundational CWSI methodology, 1981
- Barnes, E.M. et al., Canopy Chlorophyll Content Index (CCCI) for nitrogen status in wheat and cotton, peer-reviewed remote sensing literature
- Lemaire, G. and Gastal, F., critical nitrogen dilution curve methodology, Nitrogen Nutrition Index
- MDPI Remote Sensing, evaluation of ZY1-02D hyperspectral imager (AHSI) for topsoil nitrogen estimation
- XRTech Group, SuperView-2, GF-6, GF-4, and GF-5B product and band specifications
- ESA Copernicus, Sentinel-2 Red Edge and SWIR band specifications
Stop guessing which stress you're looking at
Our agriculture satellite imagery service tasks or searches Red Edge, SWIR, and thermal imagery over your fields, and delivers analysis-ready GeoTIFFs built for NDRE and CWSI straight away, no separate processing step needed.