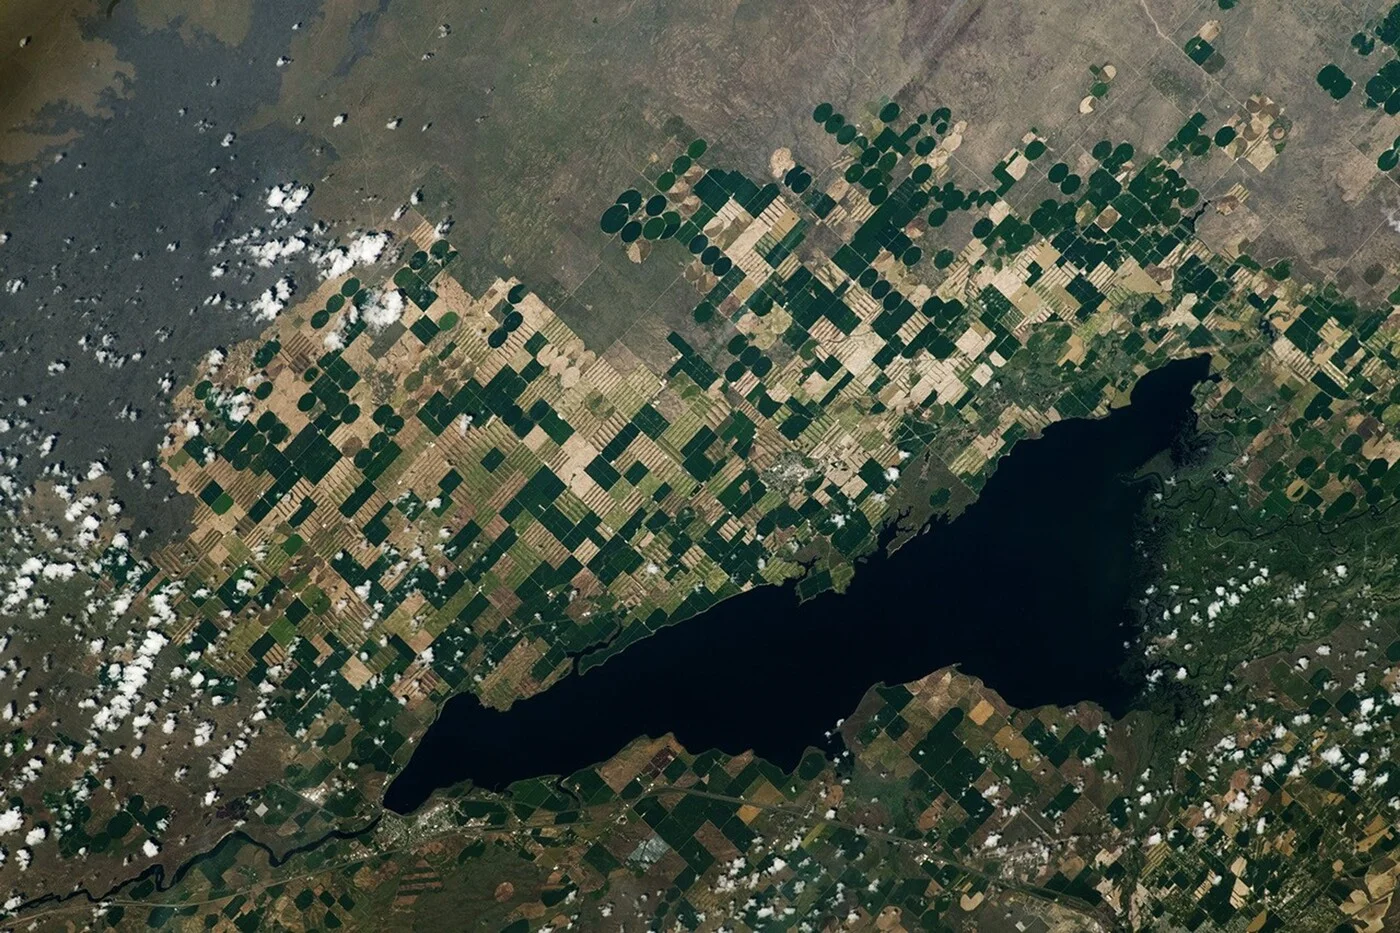
How Satellites Detect Minerals and Target Prospects
On this page
- How Satellites Detect Minerals From Space
- Why Ground-First Exploration Cannot Keep Up
- What Data Satellites Use to Find Mineral Deposits
- Spectral data shows what a rock is made of
- Structural data shows where mineral fluids traveled
- How the Detection Pipeline Works
- 01. Geological data integration
- 02. Pre-processing and calibration
- 03. Alteration and structural mapping
- 04. AI prospectivity modeling
- 05. Target generation and field validation
- How Accurate Is Satellite-Based Mineral Detection
- Who Uses Satellite Mineral Detection
- 01. Junior and mid-tier exploration companies
- 02. Major mining companies
- 03. Investors and financiers
- 04. Government geological surveys and land agencies
- Case Studies From Real Exploration Programs
- Mauritania, Reguibat Shield, ranking ten targets across Precambrian terrain
- Tanzania, Lake Victoria Gold Belt, validated targets in under 20 days
- Chile, Andean porphyry belt, cross-referencing anomalies against known deposits
- Kolwezi, Democratic Republic of the Congo, structural targeting for the Musonoi deposit
- Satellites and Sensors Used for Mineral Exploration
- What Satellite Mineral Exploration Costs
- Frequently asked questions
- Sources and further reading
A practical guide to how satellites detect minerals, why a deposit's surface chemistry and structural fabric are visible from orbit, what spectral and radar data layers make that possible, how AI prospectivity modeling turns those layers into ranked drill targets, and how accurate the resulting maps actually are.
Quick answer
Satellites detect minerals indirectly, by measuring the surface expression a deposit leaves behind. Multispectral and hyperspectral sensors read the specific clay, oxide, and carbonate minerals in a hydrothermal alteration halo, while radar and elevation data map the faults and fracture zones that controlled where mineral-rich fluids traveled underground. AI models fuse both data layers into a ranked, GPS-coded prospectivity map, published studies validate this approach with AUC scores above 0.9 against known deposits, that exploration teams use to prioritize where a limited drilling budget should go.
How Satellites Detect Minerals From Space
Satellite geology starts from a hard constraint, no sensor in orbit can see through soil or rock. What a satellite actually reads is the surface footprint a mineral system leaves on the ground above it, the alteration halo of clays, oxides, and carbonates that forms around a hydrothermal deposit, and the faults and fracture zones that channeled the mineral-rich fluids in the first place. Ore itself is rarely visible from orbit. The alteration halo and the structural plumbing around it are, and both are large enough, and spectrally and structurally distinct enough, to map from a satellite pass.
Two physically independent data layers make this possible, and neither one is sufficient alone.
Why Ground-First Exploration Cannot Keep Up
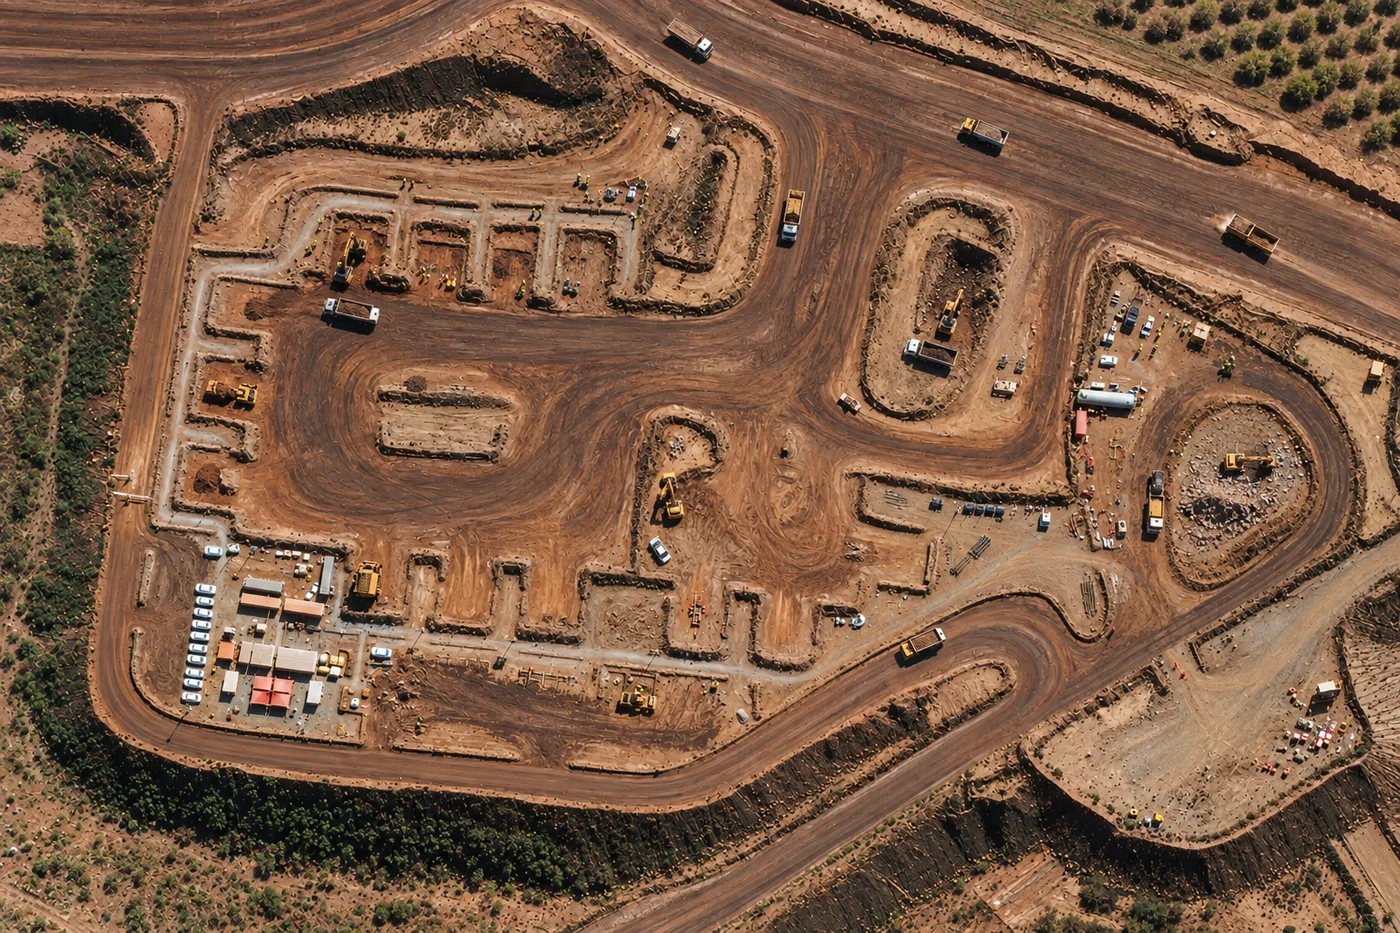
Before getting into the data layers themselves, it helps to see the actual problem satellite screening was built to solve. A drilling program that starts on hope instead of evidence spends its budget in the worst possible order, on ground a desk study could have ruled out for free.
- Blind holes cost real money. Greenfield drilling in Australia ran about $310 per meter (USD) in the most recent reporting year. A single 200-meter hole that hits nothing but barren rock still costs roughly $62,000, and a ground-first program often needs a dozen or more of those before it triangulates a real target.
- Capital has turned risk-averse. Near-mine, low-risk drilling took a record 45% share of global exploration budgets in the latest reporting year, while genuinely new, grassroots exploration fell to an all-time-low 21% share. Juniors are not choosing safe ground because it is more prospective, they are choosing it because they cannot absorb the cost of being wrong on unproven ground.
- Remote terrain adds months before the first hole is even collared. Desert terrain across Mauritania's Reguibat Shield, dense bush around the DRC Copperbelt, and mountainous belts through the Chilean Andes all demand permitting, access roads, camp logistics, and a mobilized field crew before a single sample gets bagged.
- Regional field campaigns run for months to years. Walking, sampling, and mapping a concession on foot, square kilometer by square kilometer, is a multi-season commitment. A satellite-based prospectivity workup over a concession under 100 km² is typically delivered in 2 to 3 days.
Satellite screening does not remove the need to drill. It removes the need to guess where to drill, by reading the surface chemistry and structural fabric a deposit leaves behind before a single permit is filed.
What Data Satellites Use to Find Mineral Deposits
Spectral data shows what a rock is made of
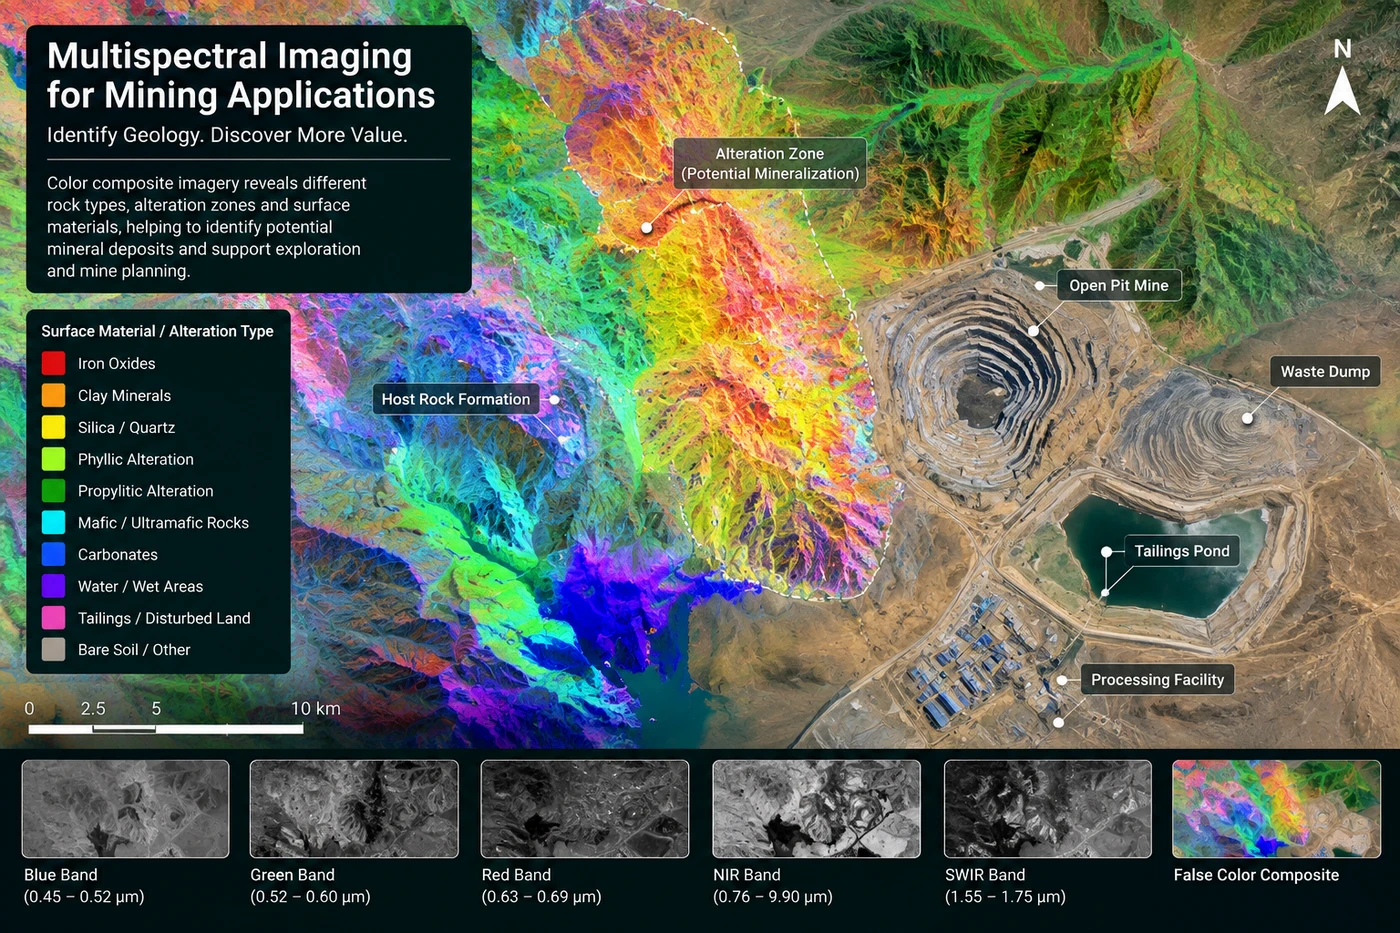
Remote sensing for mineral exploration starts with spectral data, since every mineral absorbs and reflects light in its own pattern, a spectral signature that can often be identified from space by measuring tiny wavelength variations across the visible, near-infrared, and shortwave infrared spectrum, from 400 to 2500 nanometers. Multispectral sensors capture 4 to 16 broad bands, enough to flag a broad alteration zone. Hyperspectral sensors, such as GF-5 and GF-5B's 330-band Advanced Hyperspectral Imager or ZY-1 02D's 166-channel camera, capture hundreds of narrow, continuous bands, enough to separate individual minerals such as kaolinite, sericite, hematite, and chlorite from each other with near lab-grade accuracy. This layer is covered in full depth in our guide to hyperspectral imaging for mineral exploration.
Structural data shows where mineral fluids traveled
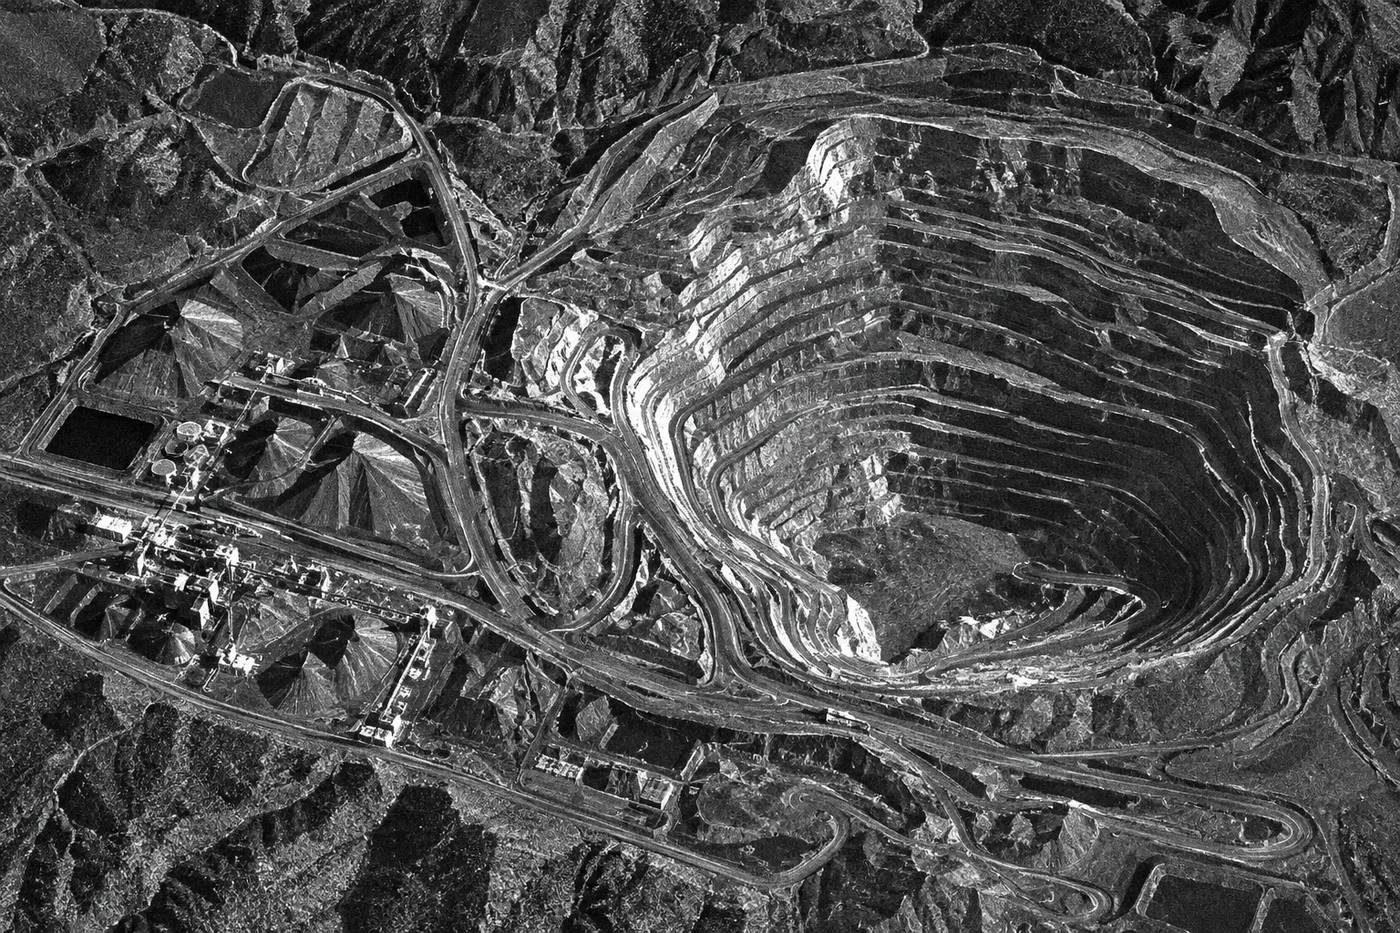
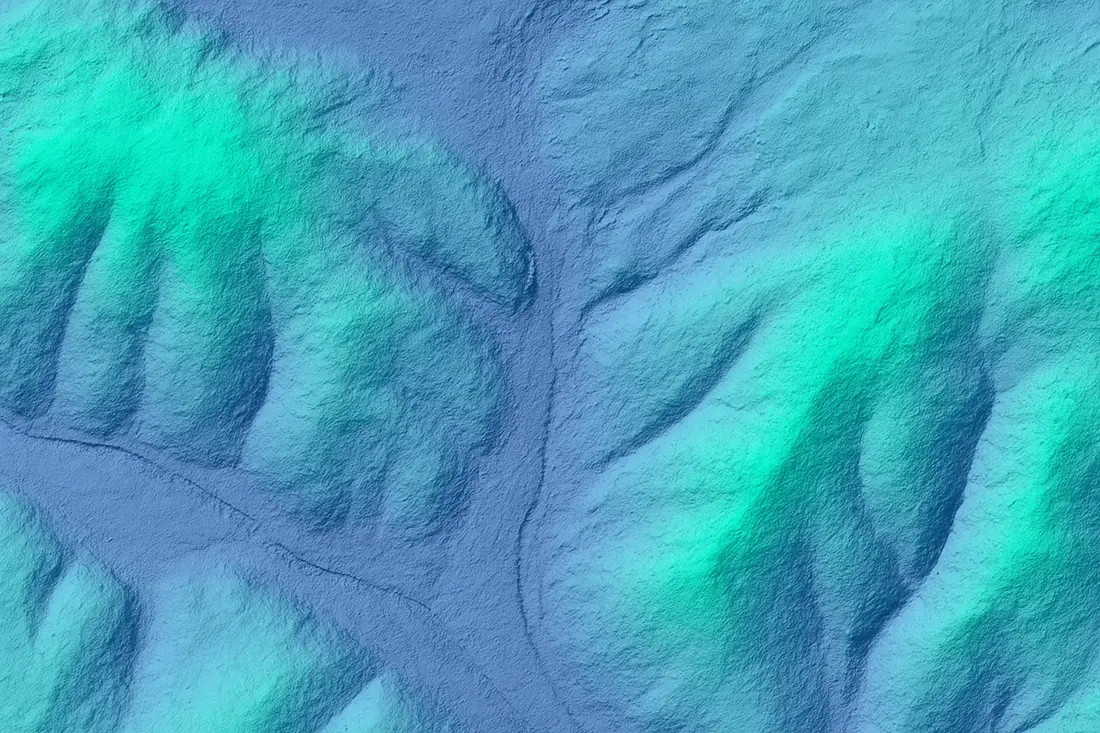
A hydrothermal deposit did not form in a random spot. It formed where a fault or fracture network gave rising mineral-rich fluid a pathway to the surface, which is why epithermal, mesothermal, Carlin-type gold, and porphyry copper systems are all structurally controlled. Synthetic Aperture Radar, most commonly the free Sentinel-1 constellation (5 by 20 m resolution, a 250 km swath, and a 6-day combined revisit), extracts these lineaments directly from radar backscatter, and works through cloud cover that would block an optical pass entirely. Digital elevation data, from the free Copernicus DEM (roughly 30 m globally, down to 10 m over Europe) or TanDEM-X (roughly 12 m), turns into hillshade, slope, and drainage-intersection maps that reveal the same fault trends from terrain alone. A recent structural study over the Singhbhum region combined Landsat 9 optical data with Sentinel-1 SAR specifically to sharpen lineament detection for exactly this purpose.
| Data type | Typical sensors | What it reveals |
|---|---|---|
| Multispectral | Landsat 8/9, Sentinel-2, SuperView-2 | Broad alteration zoning, iron oxide and clay screening |
| Hyperspectral | GF-5/GF-5B AHSI, ZY-1 02D, Wyvern | Specific mineral species, kaolinite, sericite, hematite, chlorite |
| SAR (radar) | Sentinel-1, free and cloud-independent | Fault and lineament structural mapping |
| Digital elevation | Copernicus DEM, TanDEM-X | Slope, hillshade, and drainage-intersection structural trends |
| Very-high-resolution optical | SuperView Neo-1, GF-7 | Site scouting and drill-access route planning on a confirmed target |
How the Detection Pipeline Works
01. Geological data integration
A target Area of Interest gets built by combining optical satellite imagery, Sentinel-2, Landsat, and commercial constellations, with regional geological maps, known deposit records, and digital elevation models covering the same ground.
02. Pre-processing and calibration
Atmospheric correction, terrain illumination normalization, and cloud and haze masking bring every scene to a consistent radiometric baseline, so a shadow on one hillside is never mistaken for a real anomaly on another.
03. Alteration and structural mapping
Band ratios and Principal Component Analysis pull three families of indicator minerals out of the spectral data, while lineament extraction from SAR and DEM data separately maps the faults, shear zones, and lineament density clusters that channeled fluid to the surface, two independent lines of evidence pointing at the same ground.
- Hydroxyl-bearing clays and micas: sericite, kaolinite, and illite
- Iron oxides and hydroxides: hematite, goethite, and jarosite, the gossan caps that often sit directly above a buried sulfide body
- Mafic and metamorphic alteration: chlorite and epidote
The specific diagnostic wavelengths and band ratios behind each of these signatures are covered in full in our guide to key mineral alteration signatures.
04. AI prospectivity modeling
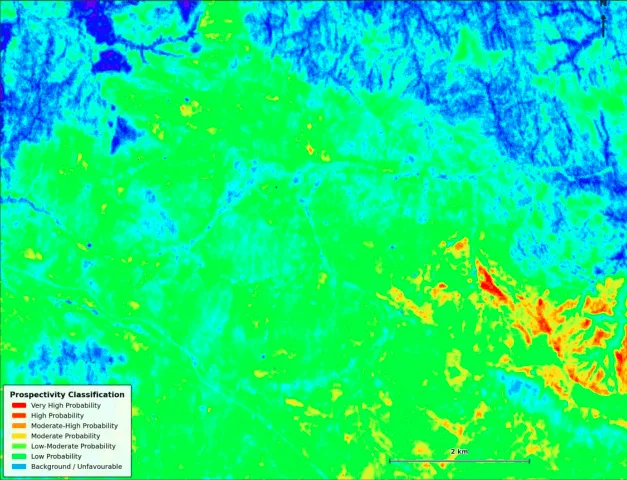
Machine learning models, trained and calibrated against real ground-truth mineral samples, weigh every layer together and compute a location-specific probability score for the target commodity, gold, copper, lithium, or otherwise, at every point on the map.
05. Target generation and field validation
The output is a ranked, color-coded prospectivity map with GPS target coordinates, confidence layers, and GIS shapefiles, a shortlist that replaces months of blind ground survey with a short list of coordinates a field crew can go confirm directly.
How Accurate Is Satellite-Based Mineral Detection
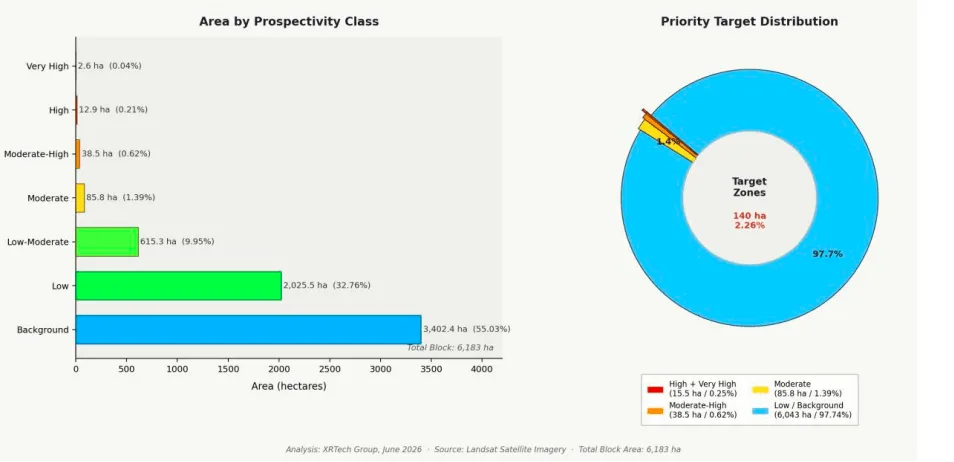
Published, peer-reviewed prospectivity studies consistently score in the range that statisticians consider excellent discrimination. A Random Forest model over the Tongling ore district in China reached a sensitivity of 93.65% and an AUC of 0.9892. A study over the Qulong-Jiama district in Tibet reached an AUC of 0.970. Over the Dharwar Craton gold belt in India, XGBoost and Random Forest models reached AUC-ROC scores of 0.9992 and 0.9965. In a real 6,183-hectare exploration block, one analysis flagged just 2.26% of the area as moderate probability or higher, with only 0.25% ranked high or very high, concentrating an entire drilling budget onto a sliver of the concession instead of spreading it across the whole block.
These figures come from backtesting a model's ability to recover deposits that are already known, the standard way prospectivity models are validated, not a guarantee about undiscovered ground. A model score is a ranking tool that prioritizes where to spend a limited drilling budget, it is not a substitute for the drill confirmation that ultimately proves a deposit.
Who Uses Satellite Mineral Detection
01. Junior and mid-tier exploration companies
Capital is the binding constraint for a junior explorer, exactly the budget-allocation problem described above. Satellite screening lowers the cost and risk of that first, riskiest step enough to make grassroots exploration affordable again, before a single hole is drilled or a single permit filed.
02. Major mining companies
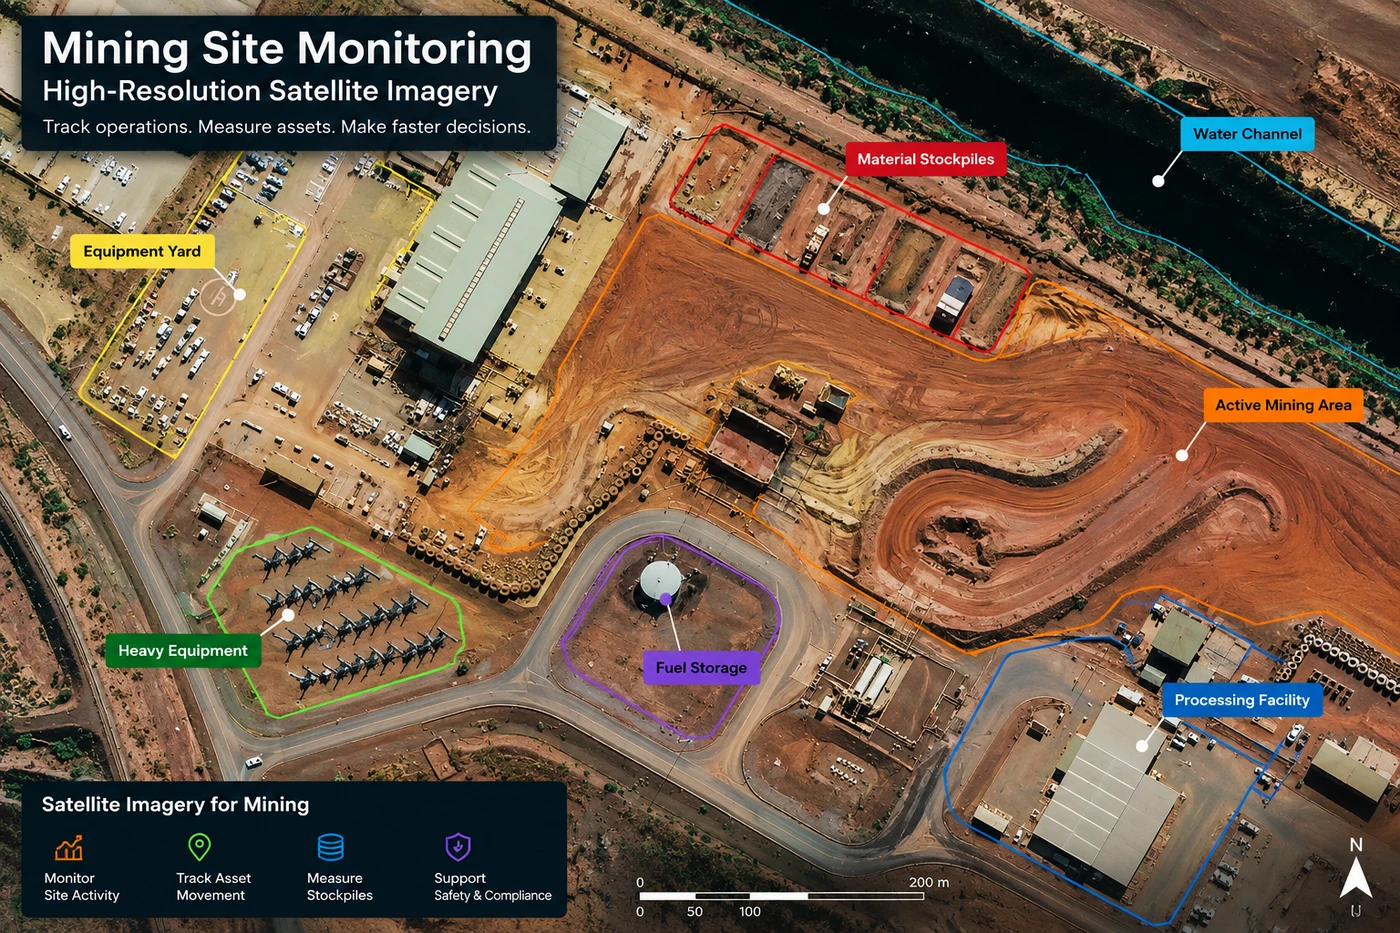
A major with a regional land package spanning multiple countries needs a consistent way to rank hundreds of prospects against each other using the same criteria. A satellite archive screens an entire portfolio from one dataset and one methodology, instead of comparing incompatible field reports written years apart by different consulting geologists.
03. Investors and financiers
Before committing capital, an investor or a project financier wants independent confirmation that a company's own claims about a prospect hold up. A satellite-derived prospectivity map, built from published, third-party-verifiable data, gives due diligence a data point that does not depend on trusting a single geologist's field notes.
04. Government geological surveys and land agencies
A national survey agency needs to characterize mineral potential across an entire country, including terrain that is remote, mountainous, or otherwise impractical to cover on foot within any reasonable field season. Satellite-based baseline mapping covers that ground once, from an office, and gets reused as new licensing rounds and land-use decisions come up.
Case Studies From Real Exploration Programs
The pipeline above is not theoretical. Here is what it produced on four active commodity and continent combinations, gold across two very different African cratons, copper across the Chilean Andes, and copper-cobalt across the DRC's Lualaba belt.
Mauritania, Reguibat Shield, ranking ten targets across Precambrian terrain
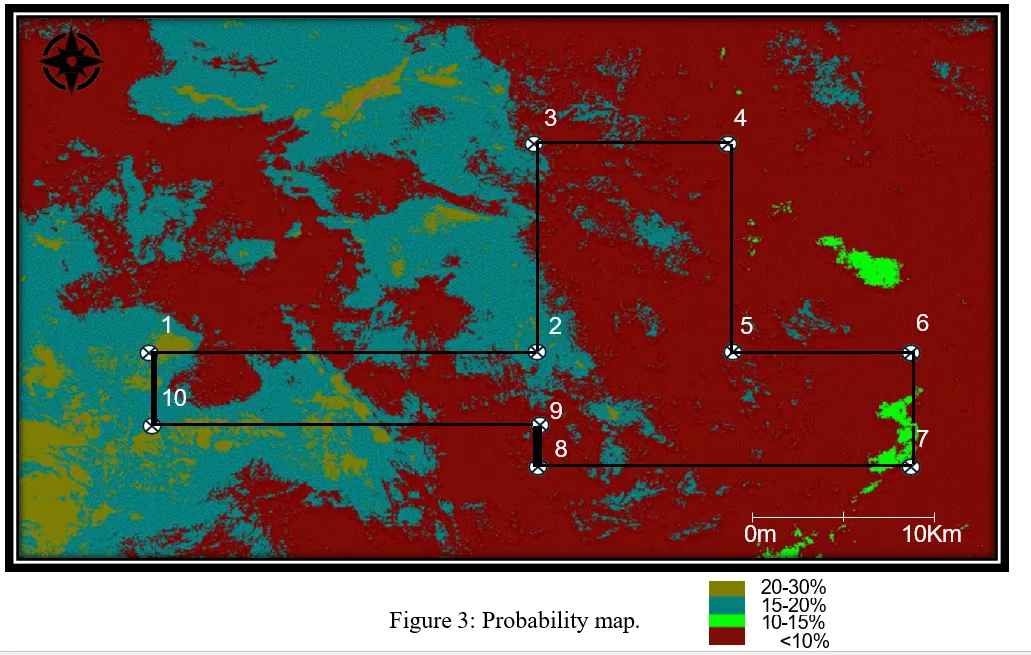
A deep-learning model fused optical spectral data with elevation-derived structural layers across a concession spanning the Reguibat Shield, a Precambrian craton with a long record of hydrothermal gold mineralization. The output ranked ten distinct target zones instead of leaving the whole concession as one undifferentiated search area.
- Ten high-confidence target zones ranked and numbered directly on the probability map
- Top-ranked zones scored 20% to 30% calculated gold-presence probability, against a background of under 10% across most of the concession
- Gave the field crew a walk-in-order shortlist instead of a blind grid survey
Tanzania, Lake Victoria Gold Belt, validated targets in under 20 days
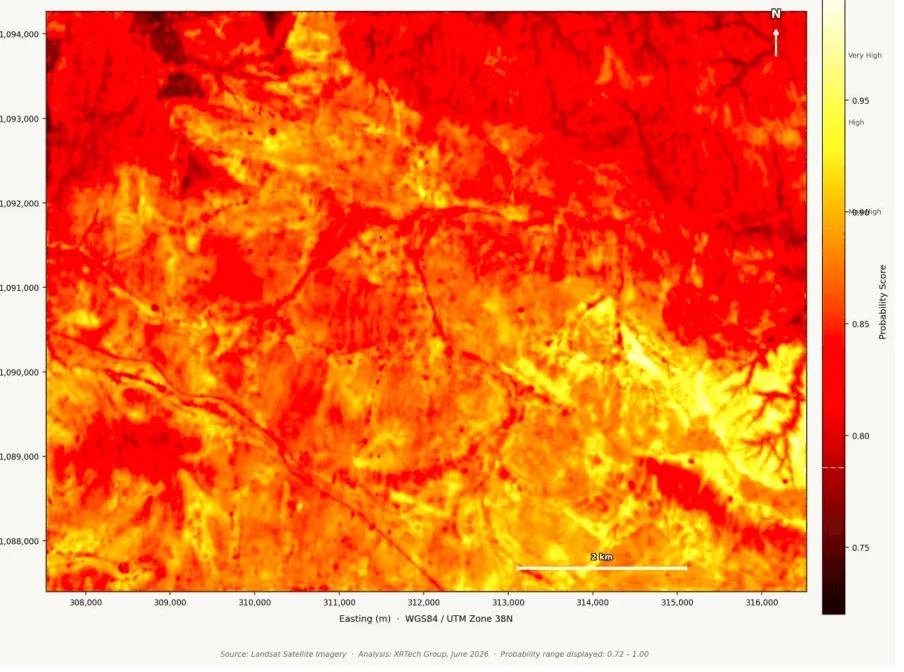
Satellite-derived spectral classification over ground beside existing artisanal gold workings produced a continuous probability surface rather than a handful of isolated points, dark pixels marking low-probability ground and yellow-to-white pixels marking a 0.74 to 1.00 probability of gold presence.
- Full concession-wide probability surface, not a sparse sample grid
- Highest-confidence zones sit directly beside known artisanal workings, an independent confirmation signal
- Delivered validated targets in under 20 days, against a multi-month regional field mapping season
Chile, Andean porphyry belt, cross-referencing anomalies against known deposits
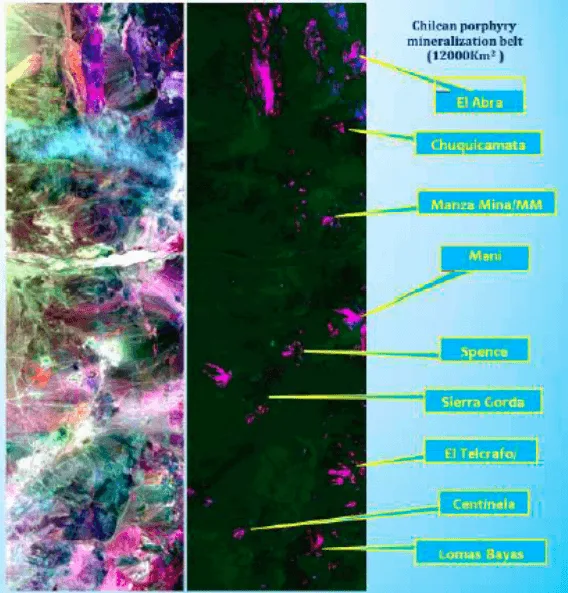
Hyperspectral classification across a 12,000 km² stretch of the Chilean porphyry copper belt mapped hydrothermal alteration and iron-oxide anomalies, then plotted them beside the belt's already-producing deposits, Chuquicamata, Centinela, and Spence among them, to check whether the same spectral signature marking a known orebody also shows up on unclaimed ground nearby.
- Alteration anomalies mapped across the full 12,000 km² belt in one processing run
- Anomaly clusters lined up spatially with the belt's producing deposits, validating the method against known ground truth
- Let the exploration partner reprioritize its drilling schedule toward the highest-probability zones first
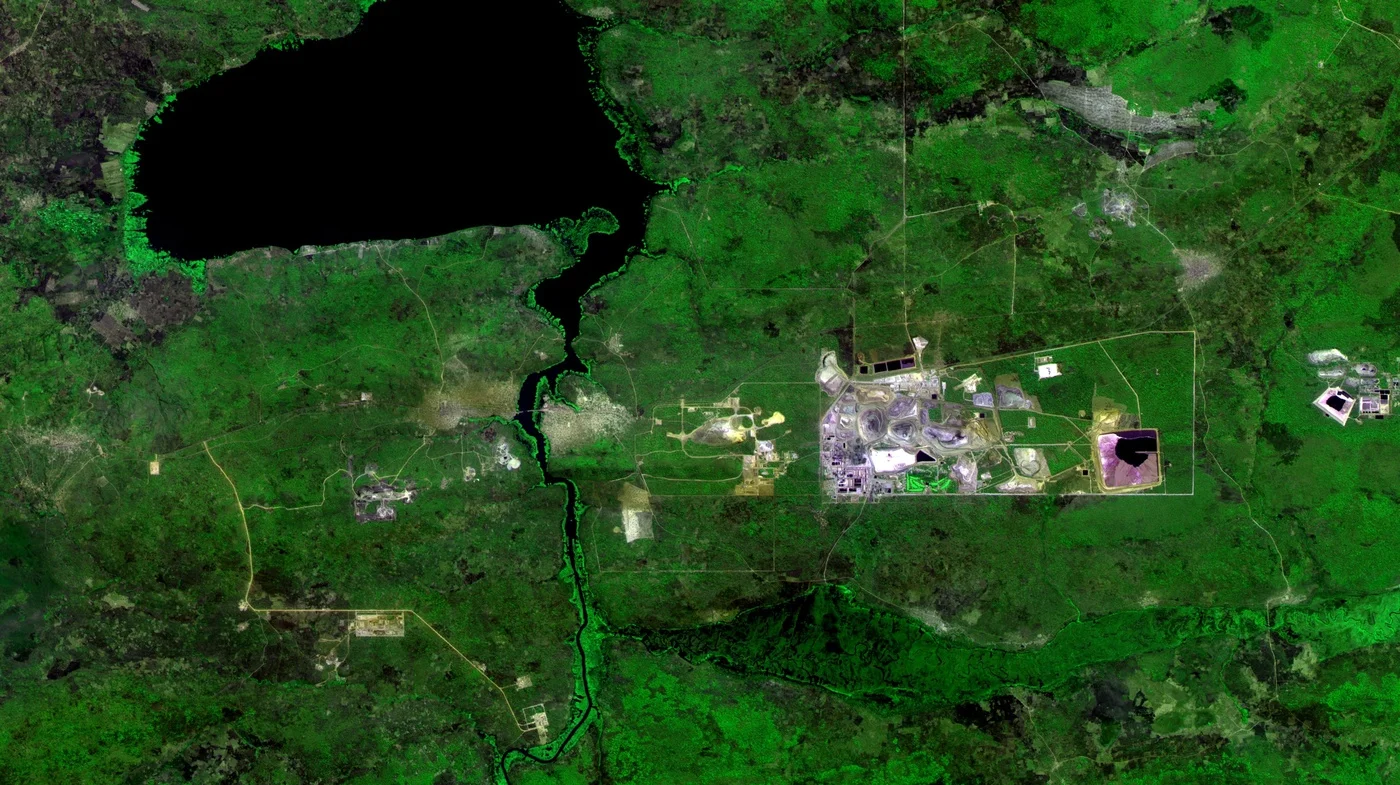
Kolwezi, Democratic Republic of the Congo, structural targeting for the Musonoi deposit
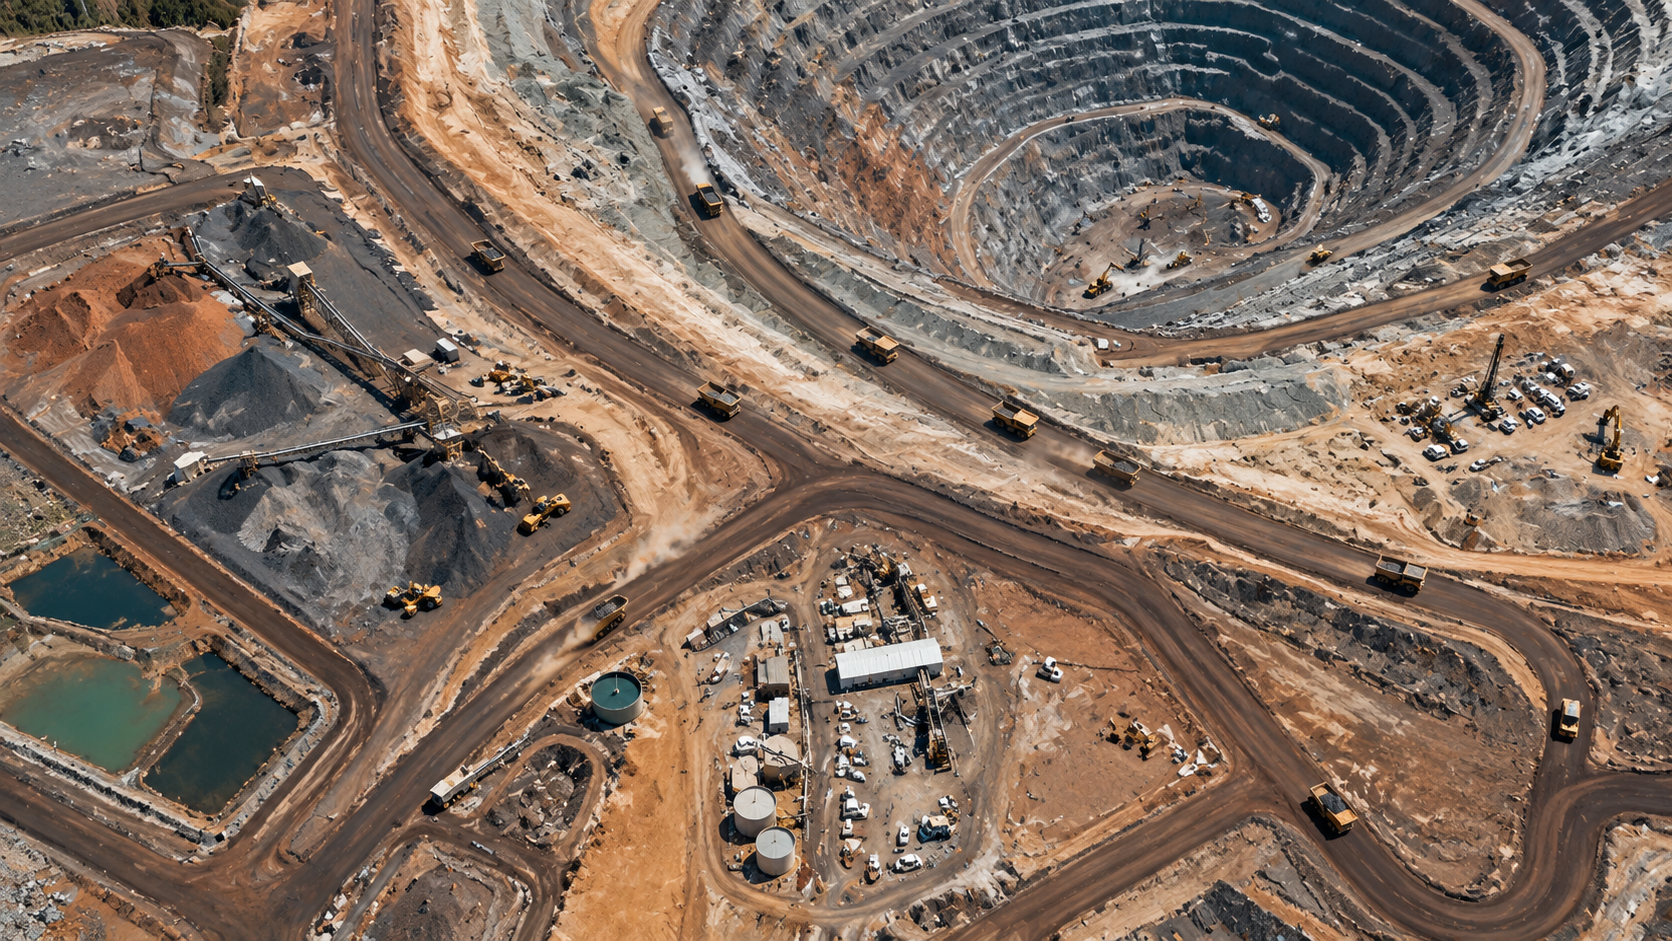
A 2026 study published in Geocarto International applied the same two-layer approach, spectral geological mapping fused with structural and land-use change analysis, to the Musonoi copper-cobalt deposit in the DRC's Lualaba Copperbelt, a district that hosts roughly 10% of the world's copper reserves and more than a third of its known cobalt. Three separate models, Random Forest, Support Vector Machine, and Gradient Boosting, were trained on the fused dataset and cross-validated against known mineralization. The Mutanda mine pictured above, a few kilometers from Musonoi, shows the same open-pit and tailings signature the model was trained to recognize.
- AUC scores of 0.89 to 0.91 across the three models, sensitivity of 0.79 to 0.85, and specificity of 0.87 to 0.91
- Confirmed a strong statistical association between known mineralization and structural lineaments, slope breaks, and drainage intersections along fault-controlled corridors
- Demonstrated the fusion approach on one of the world's most economically important copper-cobalt belts
These four programs ran the same underlying method against very different geology, gold in Precambrian shield and greenstone terrain, and copper-cobalt in a stratabound sedimentary belt, which is the strongest practical evidence that a spectral-plus-structural approach generalizes rather than being tuned to one deposit type. For the specific hyperspectral sensors and band math behind the spectral layer, see our guide to hyperspectral imaging in mineral exploration.
Have a concession worth screening?
Search our multispectral, hyperspectral, SAR, and DEM archive over your area of interest, or request a full prospectivity workup. No account needed for a first estimate.
Satellites and Sensors Used for Mineral Exploration
| Satellite / sensor | Resolution | Role |
|---|---|---|
| GF-5 / GF-5B AHSI | 30 m, 330 bands | Regional hyperspectral alteration screening |
| ZY-1 02D | 30 m, 166 channels | Hyperspectral mineral mapping with a 2.5 m panchromatic partner band |
| Wyvern Constellation | 5.3 m, 31-band VNIR | Commercial-grade hyperspectral target detail |
| Sentinel-1 | 5 by 20 m | Free SAR lineament and structural mapping, any weather |
| Copernicus DEM / TanDEM-X | 10 to 30 m (12 m TanDEM-X) | Free elevation-derived structural trend mapping |
| SuperView Neo-1 | 0.25 to 0.3 m | Ultra-high-resolution site scouting on a confirmed target |
| GF-7 | Up to 0.65 m stereo | DEM/DSM generation for overburden and drill-access planning |
What Satellite Mineral Exploration Costs
Cost scales down sharply with area, which rewards screening a full concession rather than a small piece of it.
| Concession size | Price per km² |
|---|---|
| Under 100 km² | $20 |
| 100 to 500 km² | $17 |
| 500 to 2,000 km² | $15 |
| Over 2,000 km² | $12 |
Every tier includes color-coded anomaly maps, GPS target coordinates, downloadable GIS shapefiles, and an optional geological interpretation report. Weighed against the blind-drilling cost problem covered earlier, a single satellite-ranked target list is routinely the difference between drilling three confirmed anomalies and drilling ten blind holes across the same budget.
Key takeaways
- Satellites detect minerals indirectly, by reading the surface alteration halo and structural fault network a deposit leaves behind, not by seeing through rock.
- Two independent data layers make this work, spectral data (multispectral and hyperspectral) shows what a rock is made of, and structural data (SAR and DEM) shows where mineral fluids traveled.
- Published AI prospectivity studies score AUC 0.89 to 0.99 against known deposits, strong discrimination, though these are backtests, not guarantees about undiscovered ground.
- Real programs in Mauritania, Tanzania, Chile, and the DRC's Copperbelt all validate this same spectral-plus-structural approach across gold and copper-cobalt geology alike, with AUC scores of 0.89 to 0.91 in the most recent published study.
- Pricing scales from $20/km² on small concessions down to $12/km² above 2,000 km², a fraction of the cost of the blind drilling it replaces.
Frequently asked questions
How do satellites detect minerals underground?
Satellites cannot see through soil or rock. Instead, they read the surface expression a deposit leaves behind, the alteration halo of clays, oxides, and carbonates that hydrothermal fluids deposit near the surface, and the fault and fracture network that channeled those fluids up from depth. Spectral sensors map the alteration chemistry, and radar and elevation data map the structural pathways, together indicating what is likely present below.
What satellite data is used to find mineral deposits?
Two data families are used together, spectral data from multispectral and hyperspectral sensors that identifies specific alteration minerals, and structural data from SAR (radar) and digital elevation models that maps the faults and fracture zones controlling where a deposit formed. Free sources include Landsat, Sentinel-2, Sentinel-1, and the Copernicus DEM.
How accurate is AI-based mineral prospectivity mapping?
Published studies report AUC scores from about 0.89 to over 0.99 when validated against known deposits, strong statistical discrimination. These figures measure a model's ability to recover deposits that are already known, not a guarantee about undiscovered ground, so a high-confidence zone still needs drill confirmation before it counts as a discovery.
Can satellite mineral detection replace exploration drilling?
No. Satellite-based prospectivity mapping shows where alteration minerals and structural evidence consistent with a mineral system are present, it does not measure ore grade or depth. It is used to prioritize where a limited drilling budget should go, cutting the area that needs field verification down to a small, ranked shortlist.
What is the difference between multispectral and structural data in mineral exploration?
Multispectral and hyperspectral data measure surface chemistry, which minerals are physically present. SAR and digital elevation data measure surface structure, the faults and fractures that controlled where mineral-rich fluids traveled. Both are needed because a chemical anomaly without structural control is a weaker target than one confirmed by both data layers independently.
Who uses satellite-based mineral exploration?
Junior and mid-tier exploration companies use it to make grassroots exploration affordable again under tight capital constraints. Major mining companies use it to screen large regional land packages consistently. Investors and financiers use it as independent due-diligence data. Government geological surveys use it to map national mineral potential without a full field campaign.
How much does satellite mineral exploration cost?
Pricing scales with area, from $20 per square kilometer on concessions under 100 km2 down to $12 per square kilometer above 2,000 km2. Every tier includes color-coded anomaly maps, GPS target coordinates, and downloadable GIS shapefiles.
How long does satellite-based mineral targeting take compared to ground exploration?
A full prospectivity analysis over a concession under 100 square kilometers is typically delivered in 2 to 3 days. Field validation programs built on this same approach have produced confirmed exploration targets in under 20 days, compared to months or years for a ground-first regional survey.
What satellites are used for hyperspectral mineral mapping?
Dedicated hyperspectral platforms include GF-5 and GF-5B, carrying a 330-band Advanced Hyperspectral Imager at 30 m resolution, ZY-1 02D with a 166-channel camera paired with 2.5 m panchromatic imagery, and the Wyvern Constellation, delivering 31-band VNIR data at 5.3 m resolution.
Is free satellite data enough for mineral exploration, or is commercial data required?
Free data, Landsat, Sentinel-2, Sentinel-1, and the Copernicus DEM, covers structural mapping and broad multispectral screening at no cost. Commercial hyperspectral and very-high-resolution sensors add the finer mineral species identification and site-scale detail needed once a target has already been narrowed down.
Sources and further reading
- ESA Copernicus, Sentinel-1 SAR mission specifications, resolution, and revisit cycle
- ESA / DLR, Copernicus DEM and TanDEM-X elevation data specifications
- Geocarto International, 2026, machine learning prospectivity mapping over the Musonoi copper-cobalt deposit, Kolwezi, DRC
- INPE / Coordenação-Geral de Observação da Terra, CBERS-4 PAN10M satellite image of the Mutanda copper-cobalt mine, Katanga Province, DRC (CC BY-SA 2.0, via Wikimedia Commons)
- Published remote sensing prospectivity studies over the Tongling, Qulong-Jiama, and Dharwar Craton mineral districts
- S&P Global-sourced 2025-2026 global and junior mineral exploration budget reporting
- XRTech Group Khaza'in platform, field case studies and pricing, 2026
Ready to rank your next drill target?
Get a color-coded prospectivity map, GPS target coordinates, and GIS shapefiles over your concession, starting at $12 per km² for large blocks. No account needed to get a first estimate.