Types of Aerial Imagery for Crop Assessment
On this page
- Satellite-based imagery for crop assessment
- 01. Very high resolution commercial satellites
- 02. Commercial constellations from China Siwei and 21AT
- 03. Moderate resolution open-access satellites
- 04. Low resolution wide-area and geostationary satellites
- Airplane-based imagery for crop assessment
- Drone (UAV) imagery for crop assessment
- 05. Fixed-wing drones
- 06. Rotary-wing (multi-rotor) drones
- 07. Spraying, seeding, and spreading drones
- 08. Livestock monitoring drones
- Sensor types used across every aerial platform
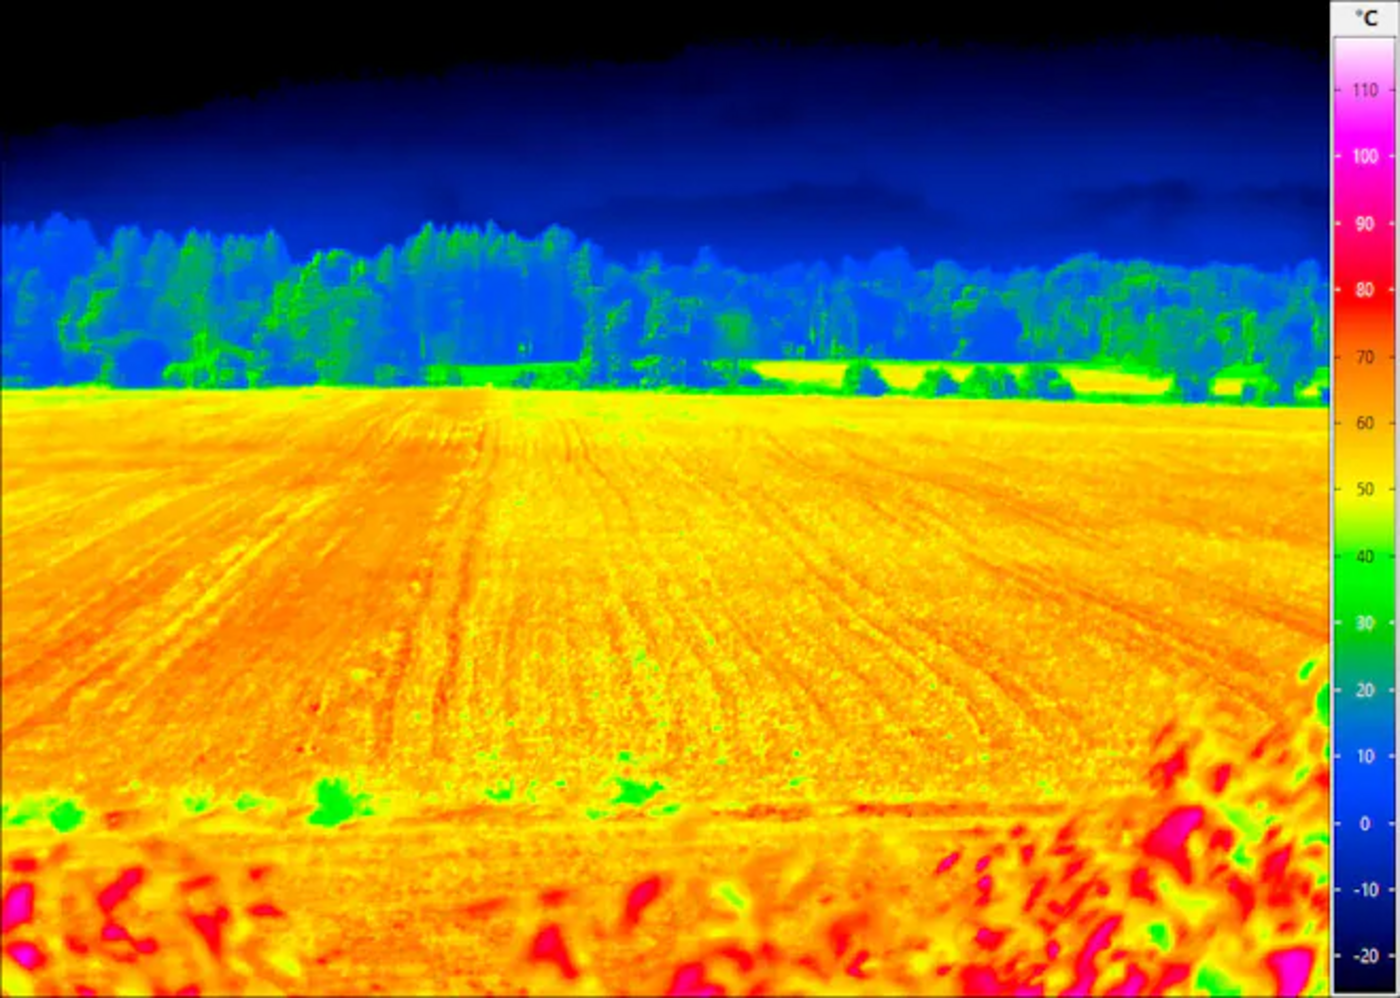
- Thermal (TIR)
- LiDAR
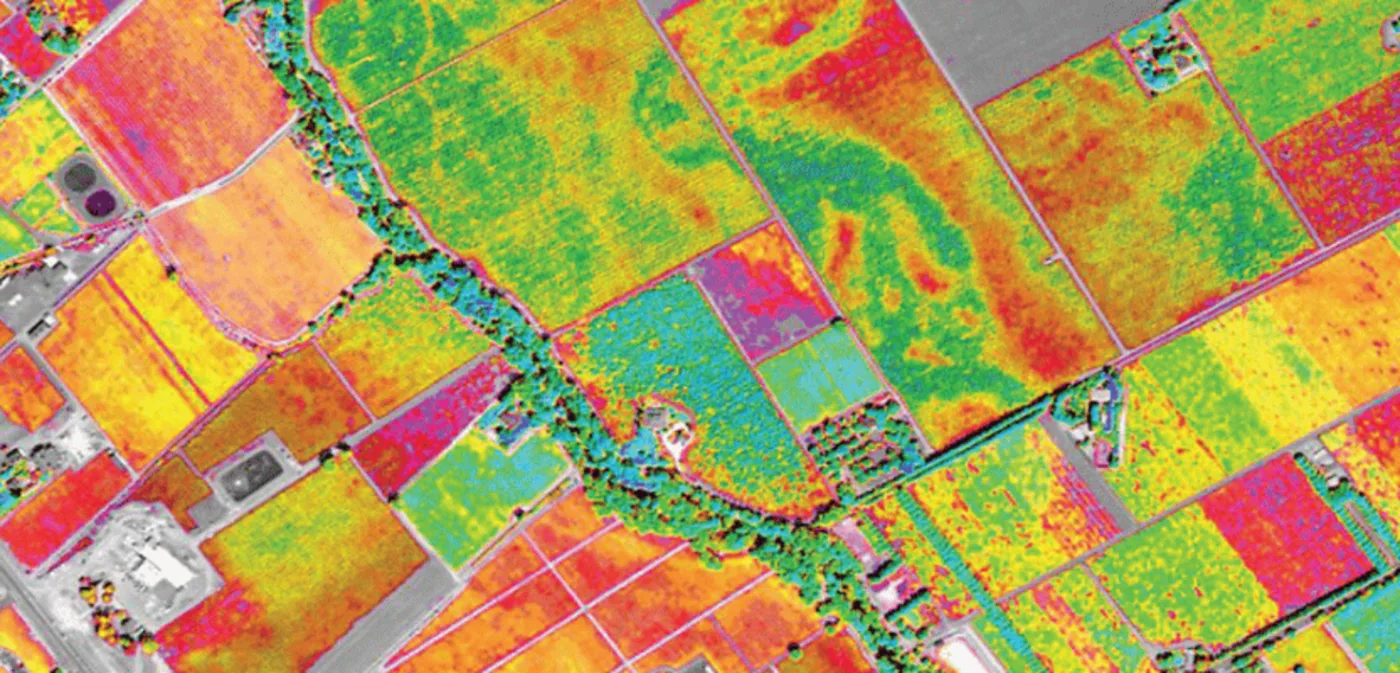
- Hyperspectral
- Satellite vs airplane vs drone compared
- Choosing the right aerial imagery for your farm
- Frequently asked questions
- Sources and further reading
The types of aerial imagery for crop assessment break down into three platforms, satellites, manned airplanes, and drones, and each one solves a different half of the same problem. A satellite covers an entire county in one pass but cannot see a single wilting plant. A drone can count individual leaves but only over a few hundred acres a day. Knowing which platform, sensor, and resolution actually match a given crop question, not just which one sounds the most advanced, is what turns aerial imagery into a decision farmers, agronomists, and policymakers can act on rather than a picture to admire. This guide breaks down every major platform and sensor type used for crop assessment today, what each one actually costs and covers, and how they combine in a real operation.
Quick answer
Aerial imagery for crop assessment splits into three platforms. Satellites, ranging from sub-meter commercial constellations to free wide-area sensors, cover the most ground and repeat automatically, best for regional monitoring, yield forecasting, and long-term trend tracking. Manned airplanes fill the gap when a specific area needs same-day, cloud-free imagery with sensors a satellite cannot carry, at a higher cost than either alternative. Drones deliver centimeter-level detail on demand over a single field or orchard, the only option fine enough for individual-plant diagnostics, but limited to a few hundred acres per flight. Most serious operations use satellites for the standing baseline and bring in a drone only where the satellite flags a problem worth a closer look.
Satellite-based imagery for crop assessment
Satellite imagery is the only platform that monitors a whole farm, county, or country on a repeating schedule without anyone flying anywhere.
01. Very high resolution commercial satellites
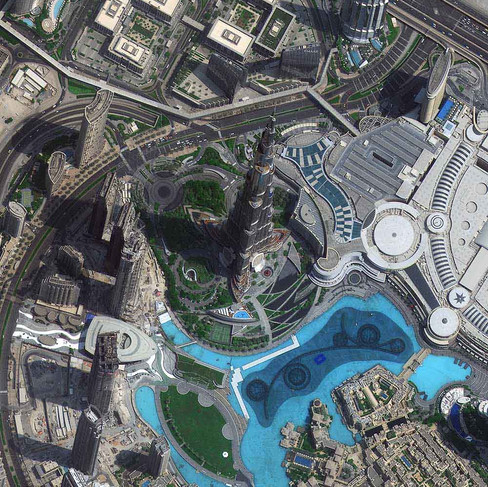
GeoEye-1, WorldView-3 and 4, Pléiades, and PlanetScope form the commercial tier most agronomists mean when they say satellite imagery. GeoEye-1 resolves to about 0.41 m panchromatic and 1.65 m multispectral, WorldView-3 sharpens that to 30 cm with 16 spectral bands including shortwave infrared, and WorldView-4 adds sub-daily revisit at a similar 31 cm resolution. Pléiades matches the 30 cm tier as well. All four are built for crop health monitoring, soil analysis, fine-scale pattern detection, and pest hotspot mapping, the same jobs a coarser sensor simply cannot resolve. PlanetScope trades some of that sharpness, at roughly 3.7 m, for genuinely daily global revisit, useful when catching a change the day it happens matters more than the finest pixel available. This tier is commercial and priced per image or per subscription, though some Planet datasets are accessible free through programs such as USGS Earth Explorer. For a deeper breakdown of very high resolution options built specifically for farm-scale work, including pricing per square kilometer, see our guide to the best satellite resolution for agricultural imagery.
02. Commercial constellations from China Siwei and 21AT
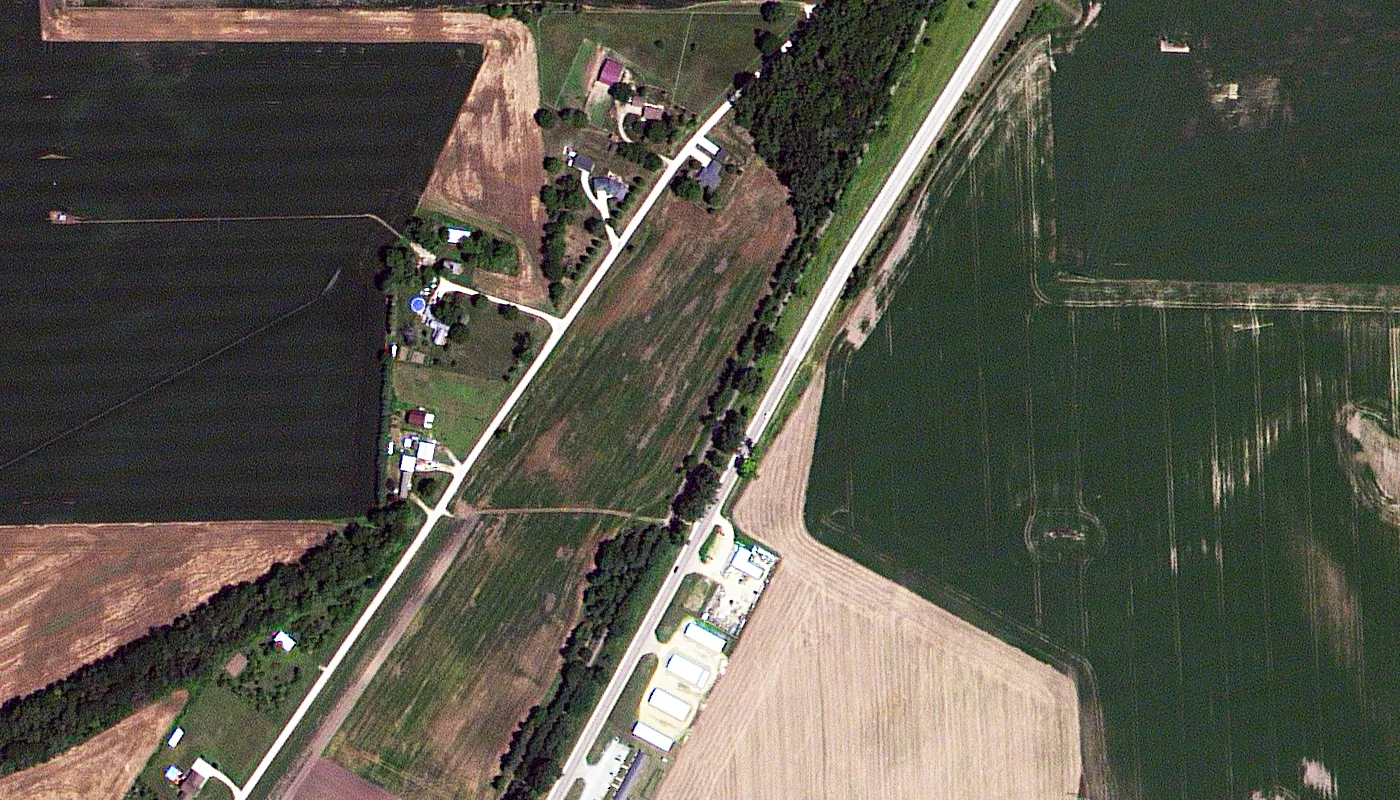
Alongside GeoEye, WorldView, and Pléiades, China Siwei and 21AT operate a parallel commercial fleet widely used for crop assessment outside that ecosystem. SuperView Neo-1 resolves to 25 to 30 cm, sharp enough for the same plant-level scouting job as WorldView-3, while SuperView-2 adds a specialized 1+8 band configuration, including Red Edge and Yellow, for chlorophyll and nutrient diagnostics a standard RGB sensor cannot make. TripleSat Constellation and ZY-3, both operated by 21AT, resolve to 0.8 m and 2.1 m for field-boundary and management-zone mapping, similar ground to PlanetScope but with a sharper pixel. On the wide-swath side, GF-6 pairs a 2 m panchromatic band with an 8 m multispectral band and a swath up to 800 km, GF-1's wide field imager adds an 830 km swath at 8 to 16 m, GF-5 and GF-5B contribute a 330-band hyperspectral sensor at 30 m, and CBERS-04 and 04A add a dedicated infrared multispectral scanner built specifically for regional yield baselines. For the full resolution-by-resolution breakdown of this fleet, including pricing per square kilometer, see our guide to the best satellite resolution for agricultural imagery.
03. Moderate resolution open-access satellites
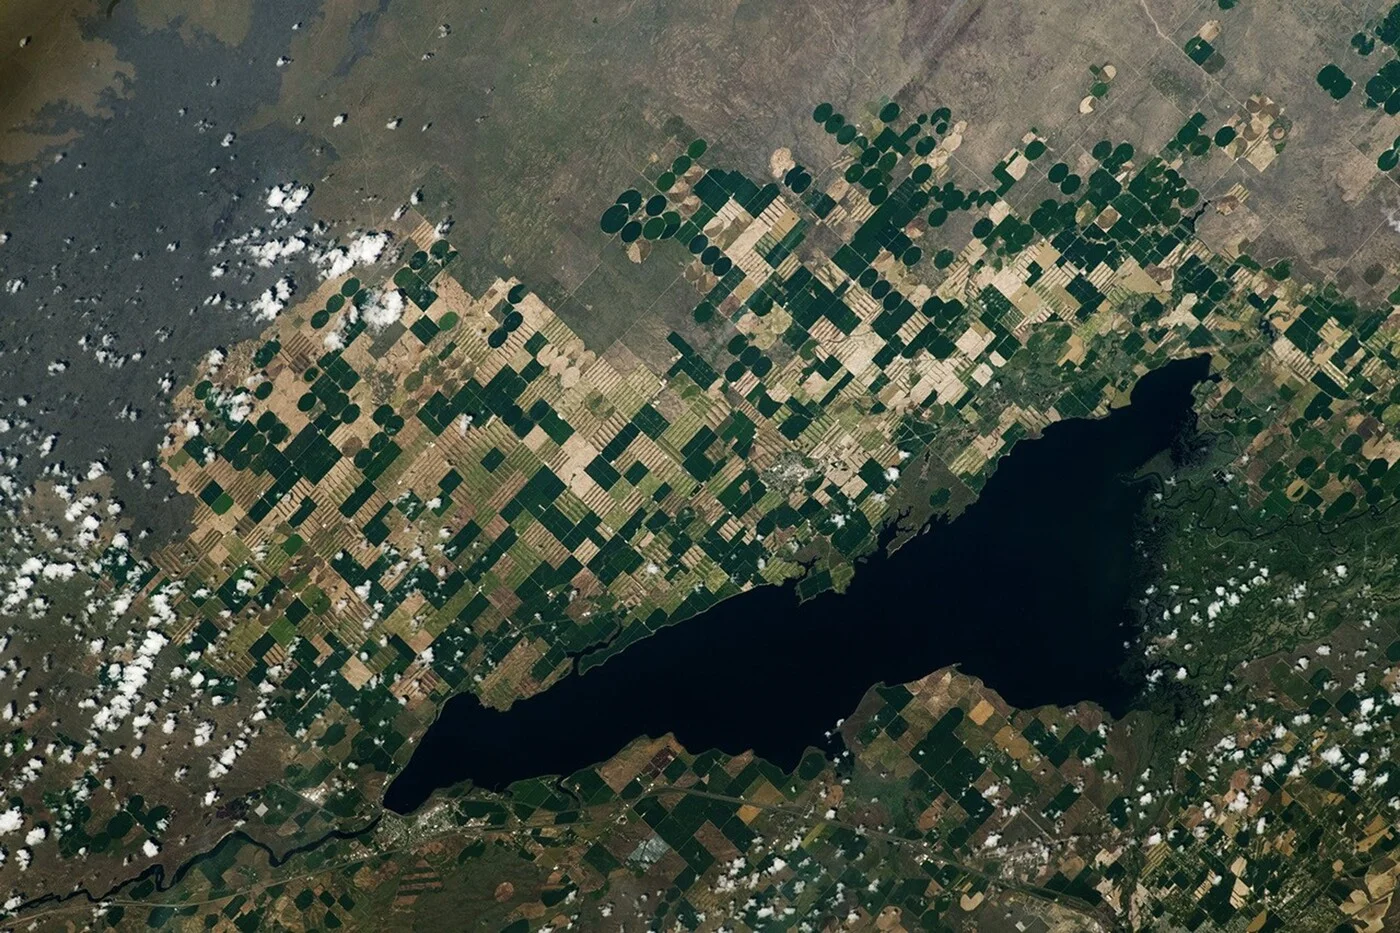
Sentinel-1 and 2 and Landsat 8 and 9 sit in the 10 to 30 m range and cost nothing to use. Sentinel-2 revisits most farmland every 5 days with 13 spectral bands, Sentinel-1 adds cloud-piercing radar, and the Landsat series contributes a revisit of 8 to 16 days with an archive reaching back to 1982. Together they cover crop health monitoring, pest detection, variable rate input planning, and crop management at a scale no commercial tasking order would be affordable for, which is why they anchor almost every regional yield or environmental study rather than sub-meter imagery.
04. Low resolution wide-area and geostationary satellites
MODIS, PROBA-V, and GOES trade spatial detail for scale most other sensors cannot reach. MODIS and PROBA-V operate at 250 m to 1 km, refreshed daily, feeding land cover, vegetation growth, and famine-early-warning models across entire continents. GOES takes a different approach entirely, sitting in geostationary orbit at roughly 35,800 km and staring at the same hemisphere continuously, delivering a new image every 5 to 15 minutes at 0.5 to 2 km resolution. No polar-orbiting satellite can match that update rate, which is why GOES data feeds drought and heat-stress tracking that needs to catch a change within the hour, not the week.
| Satellite | Resolution | Revisit | Best for | Access |
|---|---|---|---|---|
| GeoEye-1 | 0.41 m PAN, 1.65 m MS | Tasked | Fine-scale pattern and pest hotspot mapping | Commercial |
| WorldView-3 | 30 cm, 16 bands | Tasked | Detailed crop-stress and soil analysis | Commercial |
| WorldView-4 | 31 cm | Under 1 day | Time-sensitive high-resolution tasking | Commercial |
| Pléiades | 30 cm | Tasked | Infrastructure and irrigation mapping | Commercial |
| PlanetScope | 3.7 m | Daily | Frequent field-level change detection | Commercial, some free access |
| SuperView Neo-1 | 0.25 to 0.3 m | Daily-cadence | Plant-level scouting and pest detection | Commercial |
| SuperView-2 (GFDM) | 0.42 m PAN, 1.68 m MS | Tasked | Chlorophyll and nutrient diagnostics (1+8 bands) | Commercial |
| TripleSat Constellation | 0.8 m | Daily | Field-boundary and management-zone mapping | Commercial |
| ZY-3 | 2.1 m | 3 to 5 days | Stereo mapping and zone boundaries | Commercial |
| GF-6 | 2 m PAN, 8 m MS | About 4 days, networked | Wide-swath regional surveys with Red Edge | Commercial |
| GF-1 (WFI) | 8 to 16 m | Up to 4 days | Regional drought and crop monitoring | Commercial |
| GF-5 / GF-5B | 30 m, 330 bands | About 2 days | Soil and crop-stress spectral analysis | Commercial |
| CBERS-04 / 04A | 5 to 60 m | 3 to 5 days | Regional yield baselines | Commercial |
| Sentinel-1 / 2 | 5 to 20 m (SAR), 10 m (optical) | 5 days | Regional crop health and moisture tracking | Free |
| Landsat 8 / 9 | 15 to 30 m | 8 to 16 days | Multi-decade land-cover trends | Free |
| MODIS / PROBA-V | 250 m to 1 km | Daily | Continental vegetation and famine early warning | Free |
| GOES | 0.5 to 2 km | 5 to 15 minutes | Near real-time drought and heat-stress tracking | Free |
Airplane-based imagery for crop assessment
A manned aircraft splits the difference between satellite scale and drone detail, at a cost that reflects sitting in between.
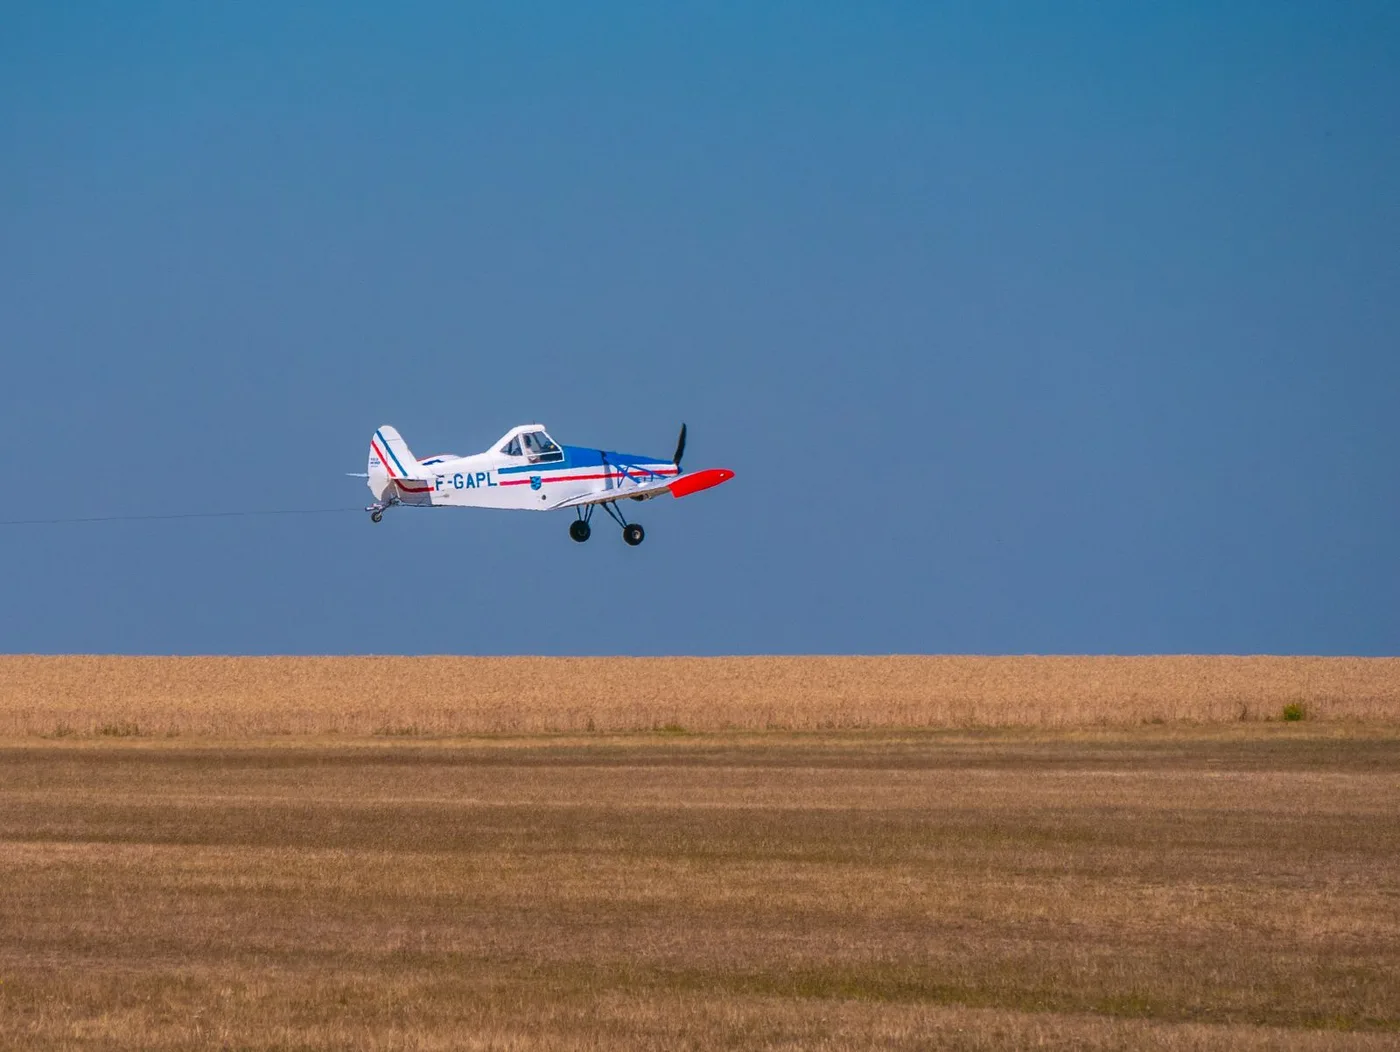
Airplane-based imagery comes from cameras and sensors mounted on manned aircraft flying a custom route over a farm or region, and it resolves finer detail than almost any satellite in service. Three things make it worth the added cost. It flies on a customizable path timed for clear weather, so a persistently cloudy region still gets a usable pass on demand rather than waiting for a satellite's next cloud-free window. It carries a wider mix of sensors at once, optical, thermal, LiDAR, multispectral, and hyperspectral, than most satellites fly in a single payload. And it delivers that data same-day rather than on a fixed orbital schedule. The tradeoff is straightforward, coordinating flight permissions and crew, plus a per-acre cost well above satellite tasking, makes airplane imagery the right call for a specific, time-critical survey rather than routine, farm-wide monitoring.
Drone (UAV) imagery for crop assessment
Nothing beats a drone for centimeter-level detail on demand, which is exactly why its coverage area stays small.
05. Fixed-wing drones
Built like a small airplane, a fixed-wing drone covers large fields efficiently on long flight durations, the drone equivalent of the manned aircraft above at a fraction of the cost. Large-scale field mapping, crop health surveys, and topographic work are its strongest use cases, though it needs a clear runway-style area to launch and land and cannot hover over a single suspect plant the way a multi-rotor drone can.
06. Rotary-wing (multi-rotor) drones
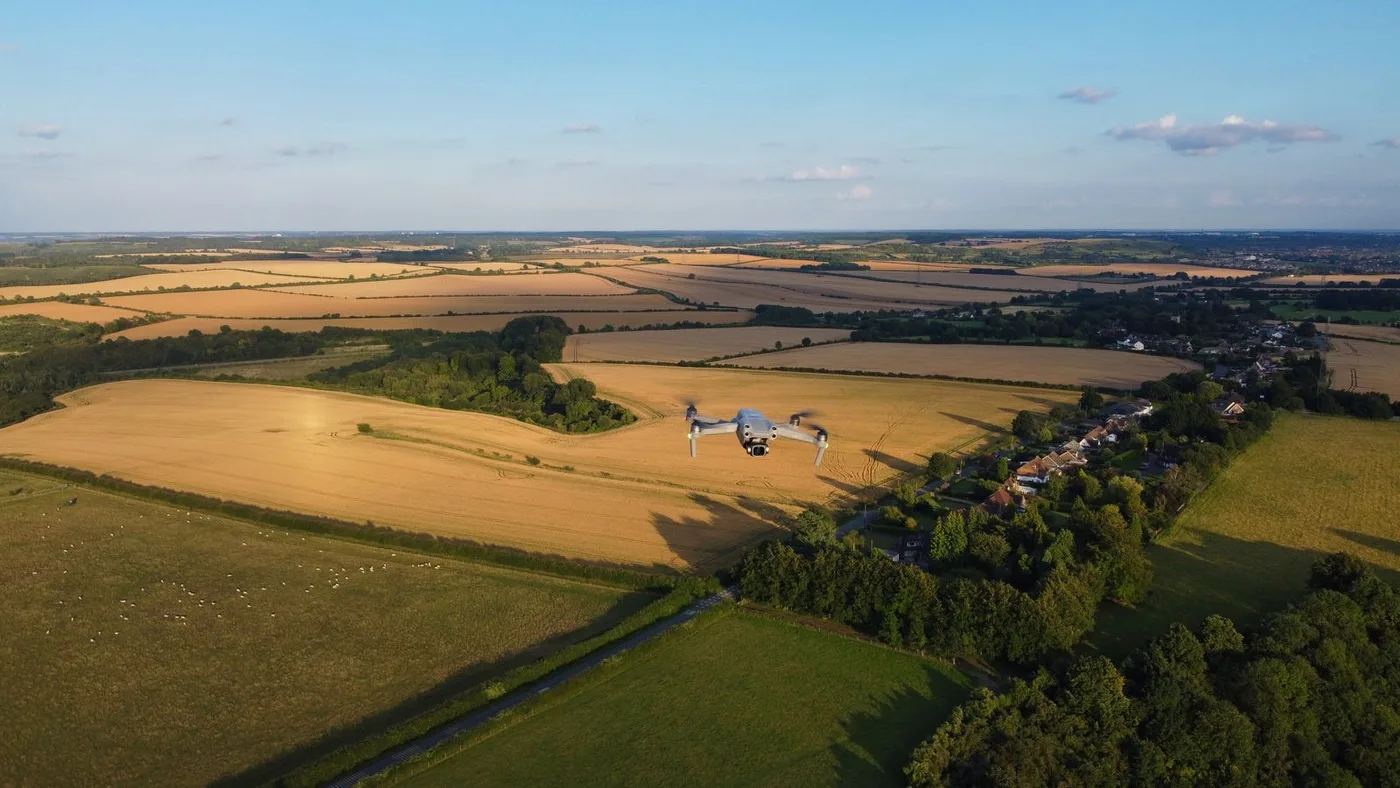
Quadcopters and hexacopters trade flight endurance, typically 20 to 40 minutes per battery, for the ability to take off vertically, hover, and fly low and slow over one exact spot. That maneuverability is what makes precise, low-altitude data collection possible, checking one suspect row rather than mapping a whole property, and it is the configuration most small to mid-size farms actually own.
07. Spraying, seeding, and spreading drones
Built with higher payload capacity than mapping drones, these carry pesticide, herbicide, seed, or fertilizer and apply it at a variable rate guided by whatever imagery flagged the target zone. AI-powered spray control and terrain-following systems keep the application accurate over uneven ground at scale, cutting both labor cost and chemical waste compared to blanket application.
08. Livestock monitoring drones
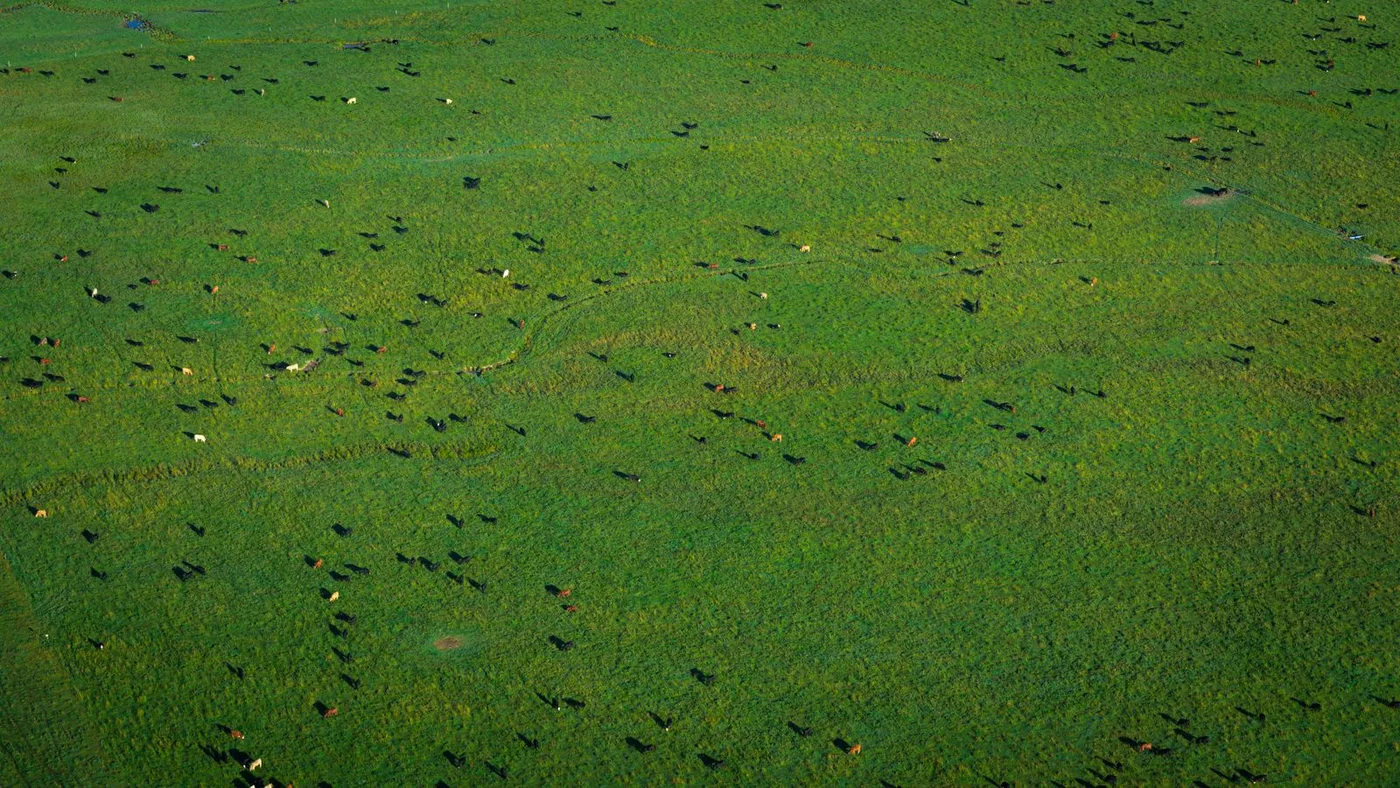
The same rotary-wing airframes, flown with thermal or RGB cameras instead of spray tanks, track herd location, count animals, and flag a sick or injured animal across pasture too large to walk daily. It is a smaller niche than crop-focused drone work, but it runs on the identical hardware and flight-planning skills.
One 2026 change worth knowing about if drone operations are on the table, the FAA's incoming Part 108 rule is expected to replace the current waiver-based approach to beyond visual line of sight flight with standardized categories, including one specifically for agriculture, and would raise the maximum aircraft weight for that category from 55 lb under the existing Part 107 rule to as much as 1,320 lb. That single change would let a much larger class of fixed-wing and heavy-lift spraying drones fly routine beyond visual line of sight routes without a case-by-case waiver, a meaningful shift for any operation planning drone coverage past this year.
Sensor types used across every aerial platform
The platform decides how much ground gets covered, but the sensor decides what the imagery can actually tell you about the crop.
Thermal (TIR)
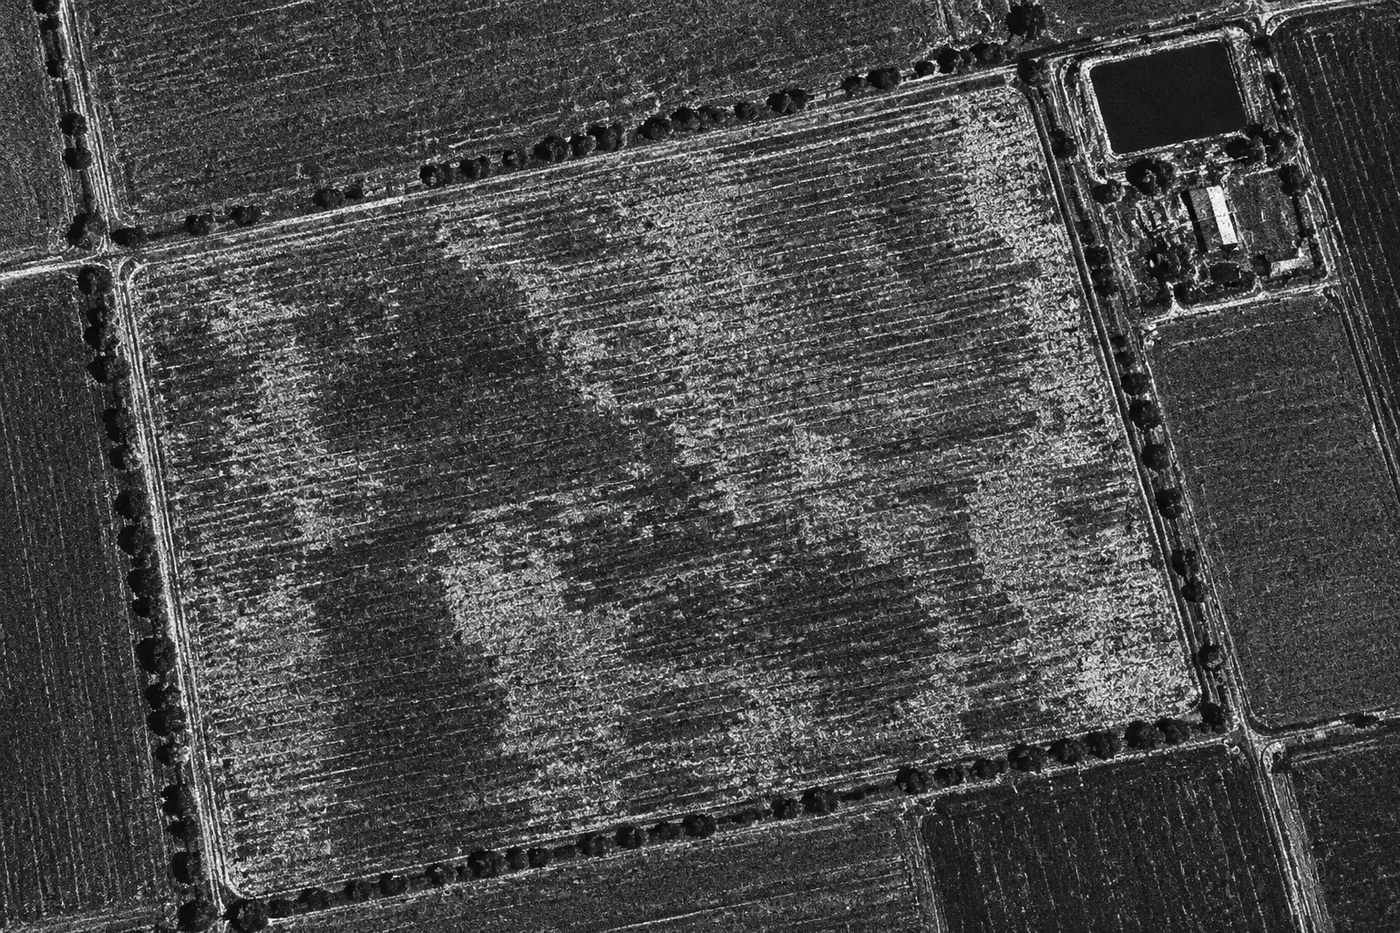
Reads surface temperature to flag water stress before a plant visibly wilts, most useful flown on a drone or airplane at field scale.
LiDAR
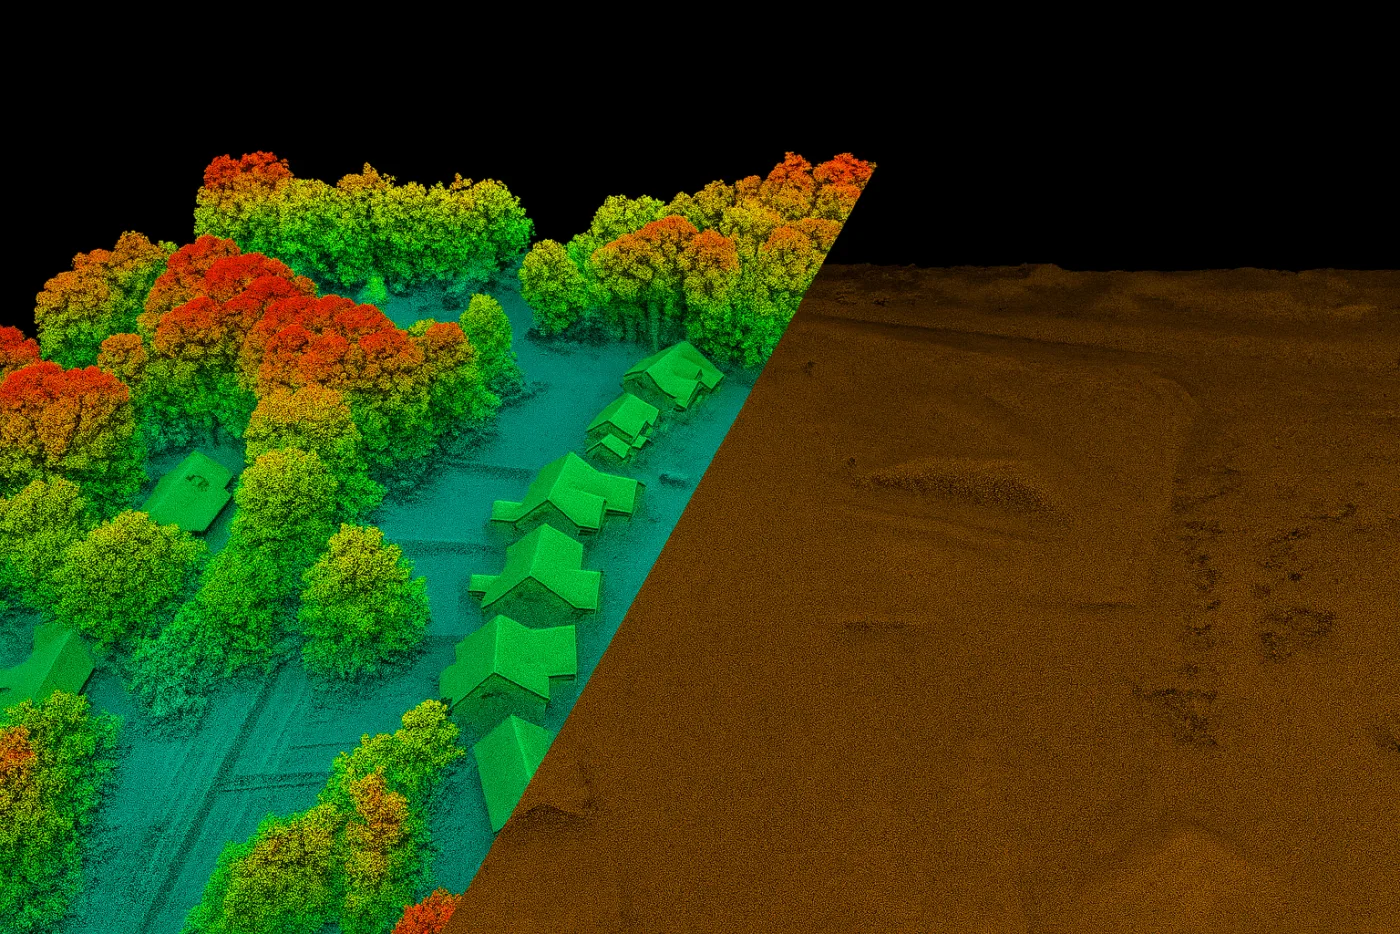
Builds a 3D point cloud of terrain and canopy structure from laser pulses, the sensor behind elevation models and canopy-volume measurements.
Hyperspectral
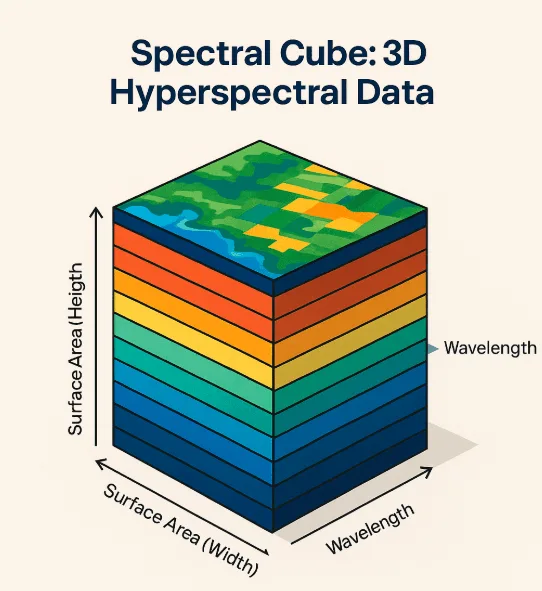
Captures hundreds of narrow, contiguous bands instead of a handful, fine enough to identify specific material and pigment composition.
| Sensor | Wavelength range | What it measures | Common platforms |
|---|---|---|---|
| RGB | 400 to 700 nm | Standard color imagery for mapping and visual inspection | Satellite, airplane, drone |
| Multispectral | Visible + NIR, several discrete bands | NDVI and other vegetation-health indices, stress, soil moisture | Satellite, airplane, drone |
| Hyperspectral | 400 to 2,500 nm, hundreds of bands | Detailed material and pigment composition analysis | Satellite, airplane, drone |
| Thermal (TIR) | 8,000 to 14,000 nm | Surface temperature variation, water stress | Airplane, drone, some satellites |
| Near-infrared (NIR) | 750 to 900 nm | Vegetation health, water stress, biomass | Satellite, airplane, drone |
| LiDAR | 905 or 1,550 nm laser pulse | 3D terrain and canopy structure point clouds | Airplane, drone |
| SAR (radar) | Microwave, centimeter to decimeter | All-weather, day-or-night ground and moisture mapping | Satellite, some airplanes |
| SWIR | 1,000 to 2,500 nm | Moisture content and material identification | Satellite, airplane, drone |
| Ultraviolet (UV) | Under 400 nm | Surface changes and organic compounds invisible in visible light | Specialized airplane, drone |
Satellite vs airplane vs drone compared
Laid side by side, the three platforms sort themselves by one simple rule, coverage and cost trade directly against resolution and control.
| Factor | Satellite | Airplane | Drone |
|---|---|---|---|
| Coverage per pass | Whole farm, county, or continent | Custom route, a region or several farms | A single field or orchard |
| Typical resolution | 25 cm to 1 km | Sub-25 cm, sensor dependent | Centimeter-level |
| Revisit or turnaround | Minutes to weeks, scheduled | Same day, on demand, weather permitting | Same day, fully on demand |
| Weather dependency | None with SAR, optical needs clear sky | Needs flyable, often clear conditions | Needs flyable local conditions |
| Relative cost | Lowest per hectare at scale, free tiers exist | Highest, crew and flight permissions | Low equipment cost, limited by coverage |
| Best for | Regional monitoring, yield forecasting, trend tracking | Time-critical regional survey, mixed sensor payloads | Individual-plant diagnostics, spraying, on-demand checks |
Choosing the right aerial imagery for your farm
Three questions settle most platform decisions faster than comparing specification sheets.
- For farm-wide or regional monitoring on a repeating schedule, start with satellite imagery, commercial for sharper detail, open-access for free continuous coverage, and reserve a tasking order only for a specific window that needs same-day, cloud-guaranteed delivery.
- For a one-time, time-critical survey over a wide but specific area, especially where cloud cover has blocked satellite passes for weeks, an airplane charter closes that gap faster than waiting for a clear satellite window.
- For anything that needs to see a single plant, a single row, or apply an input precisely, seeding, spraying, or a suspect zone a satellite flagged, a drone is the only platform fine enough, and the cheapest way to get that detail on a property-sized area.
For the resolution math behind the satellite half of this decision, see our guide to the best satellite resolution for agricultural imagery, and for how that imagery turns into a pre-harvest forecast, see satellite imagery for agricultural yield estimation.
Aerial imagery in numbers, 2026
A few figures put the scale of drone and satellite adoption in agriculture into perspective heading into this season.
Estimated global agriculture drone market size in 2026, growing at close to 30% a year.
Share of global agriculture drone revenue coming from Asia-Pacific in 2026, the largest regional market.
Share of the agriculture drone market held by large-scale farms in 2026.
Maximum aircraft weight proposed under the FAA's incoming Part 108 rule for agricultural BVLOS drones, up from 55 lb today.
Key takeaways
- Aerial imagery for crop assessment comes from three platforms, satellite, airplane, and drone, and the right choice depends on the question, not on which one sounds most advanced.
- Satellites cover farm to continental scale on a repeating schedule, from 25 cm commercial tiers, including GeoEye-1, WorldView, Pléiades, and China Siwei's SuperView Neo, to free 250 m to 1 km wide-area sensors, and geostationary GOES data refreshes every 5 to 15 minutes.
- Airplanes fill a narrow but real gap, same-day, cloud-guaranteed, multi-sensor coverage over a custom route, at the highest per-acre cost of the three.
- Drones are the only platform fine enough for single-plant diagnostics and precise spraying or seeding, capped by battery life and a coverage area measured in fields, not counties.
- Nine distinct sensor types, from RGB through hyperspectral, LiDAR, SAR, and UV, each answer a different agronomic question, and most serious programs combine more than one.
- The FAA's incoming Part 108 rule is set to widen what agricultural drones can legally do beyond visual line of sight, a meaningful change for any operation planning drone coverage this year.
Frequently asked questions
What is aerial imagery used for in crop assessment?
Aerial imagery is used to monitor crop health, detect water and pest stress, identify nutrient deficiencies, map field boundaries, and forecast yield, all without a ground site visit. It comes from three platforms, satellites, manned airplanes, and drones, each suited to a different combination of coverage area, resolution, and turnaround time.
What is the difference between satellite, airplane, and drone imagery for agriculture?
Satellites cover the most ground on a repeating schedule but see less fine detail. Airplanes deliver same-day, cloud-guaranteed imagery with a wide mix of sensors over a custom route, at the highest per-acre cost. Drones capture centimeter-level detail on demand but only over a single field or orchard per flight.
Which satellites are used for crop assessment?
Very high resolution commercial satellites such as GeoEye-1, WorldView-3 and 4, Pléiades, and PlanetScope resolve individual field patterns and pest hotspots. China Siwei and 21AT operate a parallel commercial fleet for the same job, including SuperView Neo-1 and SuperView-2 at 25 to 42 cm, and TripleSat and ZY-3 at 0.8 to 2.1 m, alongside wide-swath sensors such as GF-1, GF-6, GF-5B, and CBERS-04A. Open-access Sentinel-1, Sentinel-2, and Landsat 8 and 9 cover regional crop health at 10 to 30 m for free. Wide-area sensors such as MODIS, PROBA-V, and GOES trade resolution for continental or hemispheric coverage.
What types of drones are used in agriculture?
Fixed-wing drones cover large fields efficiently for mapping and health surveys. Rotary-wing, or multi-rotor, drones hover and fly low for precise, close-up data collection. Spraying, seeding, and spreading drones apply pesticide, herbicide, or fertilizer at a variable rate. Livestock monitoring drones track herd location and animal health across pasture.
What sensors do agricultural drones and satellites use?
The main sensor types are RGB, multispectral, hyperspectral, thermal infrared, near-infrared, LiDAR, SAR, shortwave infrared, and ultraviolet. Each captures a different part of the light spectrum and answers a different agronomic question, from vegetation health and water stress to 3D canopy structure and all-weather ground mapping.
Can aerial imagery see through clouds?
Optical sensors on satellites, airplanes, and drones cannot see through cloud cover. SAR, or synthetic aperture radar, is the exception, transmitting its own microwave signal to image the ground through cloud, rain, or full darkness, most commonly carried on satellites such as Sentinel-1.
How much does aerial imagery for crop assessment cost?
Open-access satellite data such as Sentinel-2 and Landsat is free. Commercial very high resolution satellite imagery is priced per image or subscription. Airplane charters carry the highest per-acre cost due to crew and flight permissions. Drones have a comparatively low equipment cost but are limited by the acreage one flight can cover.
Are new drone regulations coming for agriculture in 2026?
Yes. The FAA's Part 108 rule, expected in 2026, would replace the current waiver-based approach to beyond visual line of sight flight with standardized categories, including one for agriculture, and would raise the maximum aircraft weight for that category from 55 lb to as much as 1,320 lb.
Can drones replace satellite imagery for farming?
No, they serve different scales. A drone captures far finer detail but only over a single field or orchard per flight, while a satellite monitors an entire farm or region automatically on a repeating schedule. Most operations use satellite imagery as the standing baseline and send a drone only to the specific zone the satellite flags as worth a closer look.
What is the best aerial imagery platform for precision agriculture?
There is no single best platform, only the right combination for the task. Satellite imagery handles farm-wide and regional monitoring most cost-effectively, while a drone adds the centimeter-level detail needed for individual-plant diagnostics, precise spraying, or seeding once a specific zone needs a closer look.
Sources and further reading
- eoPortal and satellite operator documentation, GeoEye-1, WorldView-3, WorldView-4, and Pléiades specifications
- China Siwei and 21AT, SuperView Neo, SuperView-2, TripleSat, ZY-3, and CBERS-04/04A specifications
- CAST and CRESDA, GF-1, GF-5, GF-5B, and GF-6 satellite mission specifications
- ESA Copernicus, Sentinel-1 and Sentinel-2 mission specifications and open-access data policy
- NASA and USGS, Landsat 8 and 9, MODIS, and Earth Explorer access programs
- NOAA, GOES-R series Advanced Baseline Imager specifications
- Planet Labs, PlanetScope constellation resolution and revisit documentation
- FAA, Part 107 and proposed Part 108 beyond visual line of sight rulemaking, 2026
- Industry market research on agriculture drone adoption and market size, 2026
Need the satellite half of your aerial imagery stack?
Search our live archive across commercial and open-access satellites, or task new coverage over your growing region, no account needed to get a first estimate.