Best Satellite Resolution for Agricultural Imagery
On this page
- Very high to super high resolution, 25 to 50 cm
- 01. Micro-field scouting and early stress detection
- 02. The spectral advantage behind this tier
- High resolution, 0.8 to 2 m
- 03. Precision agriculture planning and field boundaries
- 04. Variable-rate prescription mapping
- 05. Seasonal growth tracking and harvest timing
- Moderate and wide-swath resolution, 8 to 30 m
- 06. Regional crop yield estimation
- 07. Soil moisture, drought risk, and smart irrigation
- 08. Agricultural census and subsidy verification
- Resolution, coverage, and price side by side
- Which resolution tier should you actually pick
- Frequently asked questions
- Sources and further reading
Agricultural imagery only earns its cost when the pixel size matches the question being asked. Scouting a single field for an early pest outbreak and forecasting a county's wheat yield are both agriculture imaging jobs, but they call for pixels roughly a hundred times apart in size, and paying for the wrong one either wastes budget or misses the answer entirely. The satellites available today span 25 cm super high resolution down to 30 m wide-swath hyperspectral, each tier suited to a different distance between the camera and the decision it needs to support. What follows breaks down which resolution tier fits which agricultural task, what each tier actually costs, and how to pick between them without guessing.
Quick answer
The best satellite resolution for agriculture ranges from 25 cm to 30 m, and which end of that range to use depends on the task, not on buying the sharpest tier available. Very high to super high resolution, 25 to 50 cm, fits individual-plant scouting, early pest and disease detection, and spotting unauthorized land conversion on farmland. High resolution, 0.8 to 2 m, fits precision agriculture planning, variable-rate prescription maps, and season-long growth tracking. Moderate and wide-swath resolution, 8 to 30 m, fits regional yield modeling, soil moisture and drought tracking, and large-scale agricultural census work, often at no cost through open-access programs. Most working farms end up using two of the three tiers, not just one.
Very high to super high resolution, 25 to 50 cm
This is the tier for questions about a single plant, a single row, or a single unauthorized structure, not a whole field.
01. Micro-field scouting and early stress detection
SuperView Neo-1 (03/04) resolves ground detail at 25 to 30 cm, fine enough to separate individual plants and irrigation lines rather than just field boundaries. That level of detail is what makes early detection of localized pest infestations, fungal disease, and physiological stress possible before a problem spreads past a corner of one field. It is also the tier that catches non-grain land conversion on farmland, an unauthorized greenhouse, an illegally dug fish pond, or construction encroaching on protected cropland, detail a coarser pixel would simply average away. Orchard operators use the same tier to check tree-canopy condition row by row rather than treating a whole block as one unit, since a single struggling tree stays invisible at anything coarser.
Below about 25 cm, satellites generally stop being the right tool. Individual tree-crown volume, canopy gaps under 50 square meters, and other centimeter-level orchard measurements are a drone or UAV job, typically flown at 2 to 7 cm, since no commercial satellite tasks that fine on a recurring basis. The practical split is satellite for anything field-sized or larger, drone for anything that needs a single tree or a single row measured precisely. For the full picture of how satellites, airplanes, and drones fit together, including sensor types and current drone regulation, see our guide to aerial imagery for crop assessment.
02. The spectral advantage behind this tier
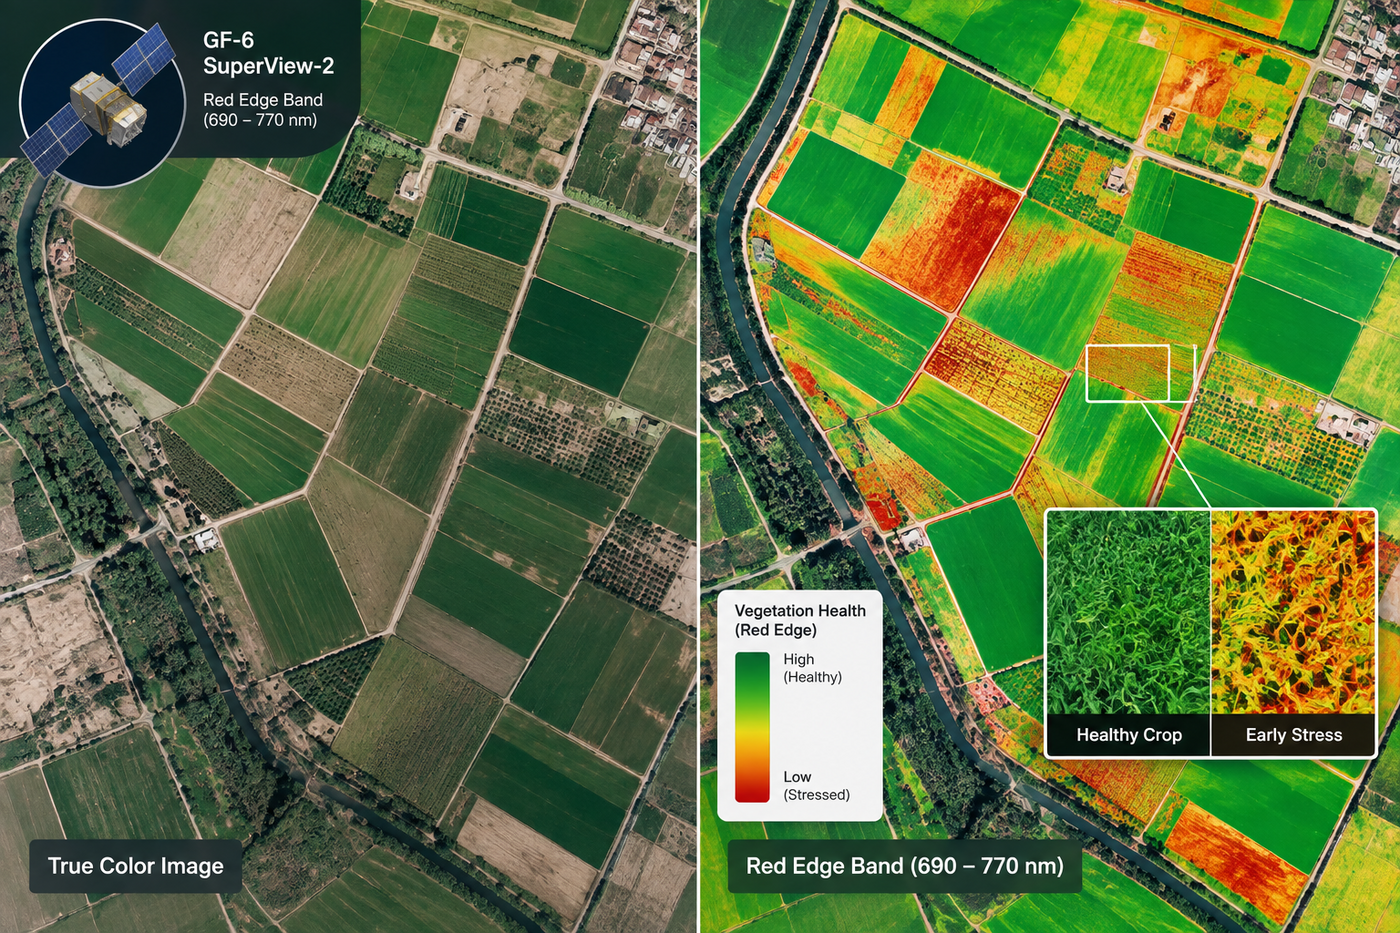
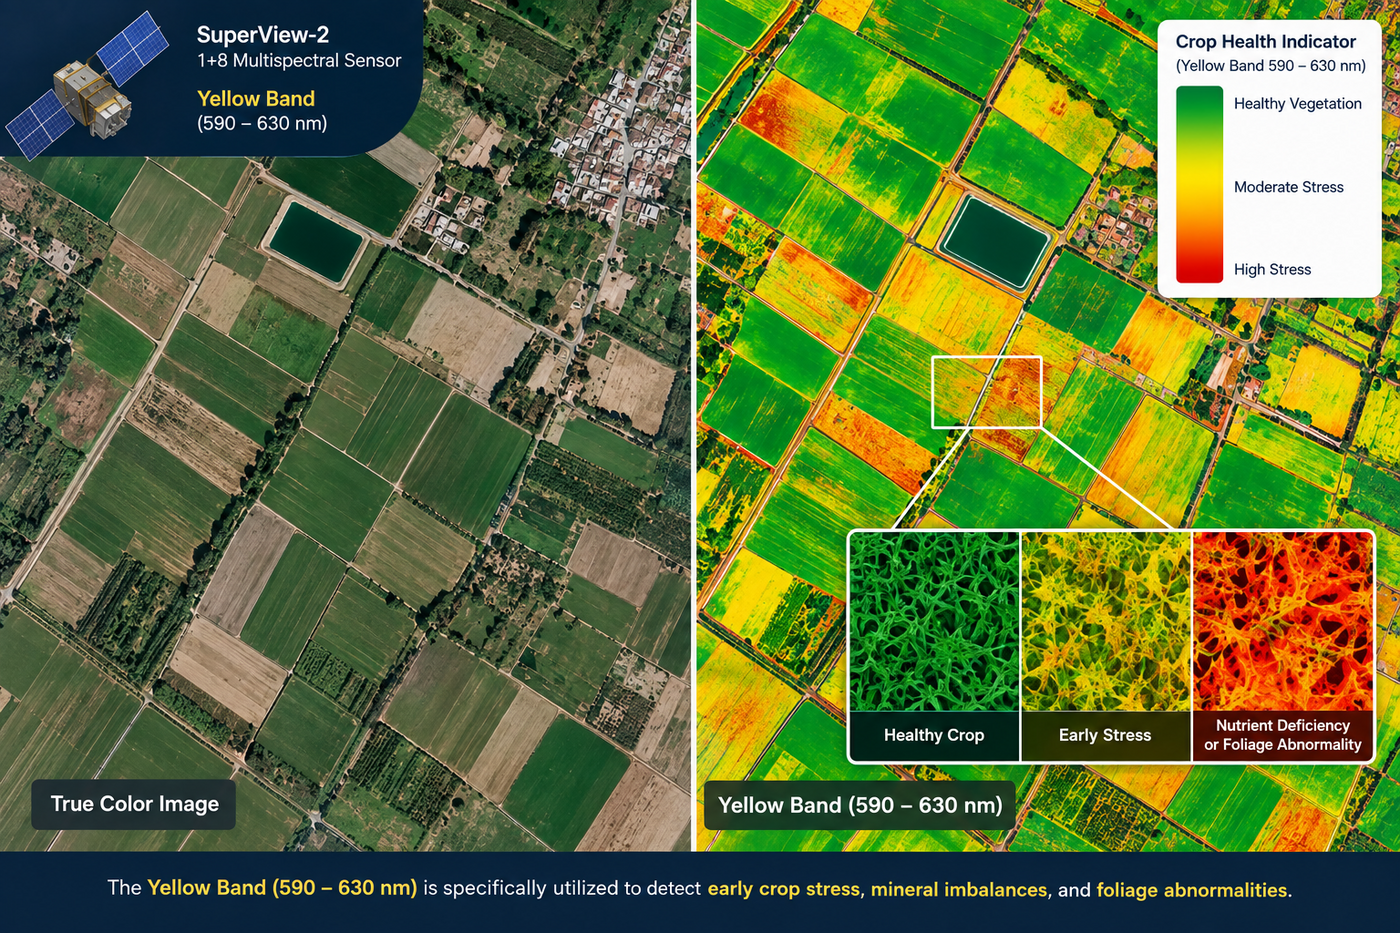
SuperView-2, also referred to as GFDM, pairs a sharp 0.42 m panchromatic band with a specialized 1+8 spectral configuration, adding Red Edge, Yellow, Purple, and two near-infrared channels to the standard RGB set. That combination goes well beyond a simple health or sick reading, the Red Edge band picks up chlorophyll decline days before a leaf visibly yellows, and the Yellow band specifically flags nutrient imbalance and foliage abnormality separately from water stress.
| Satellite | Resolution | Spectral bands | Revisit | Pricing |
|---|---|---|---|---|
| SuperView Neo-1 (03/04) | 0.25 to 0.3 m PAN | RGB + NIR | Daily-cadence | $13 to $20/km² archive, $20 to $30/km² new tasking |
| SuperView-2 (GFDM) | 0.42 m PAN, 1.68 m MS | 1+8, incl. Red Edge, Yellow, Purple, NIR1, NIR2 | Tasked | $13 to $20/km² archive, $20 to $30/km² new tasking |
High resolution, 0.8 to 2 m
This tier trades some of the sharpest detail above for the wider coverage a working farm actually operates at.
03. Precision agriculture planning and field boundaries
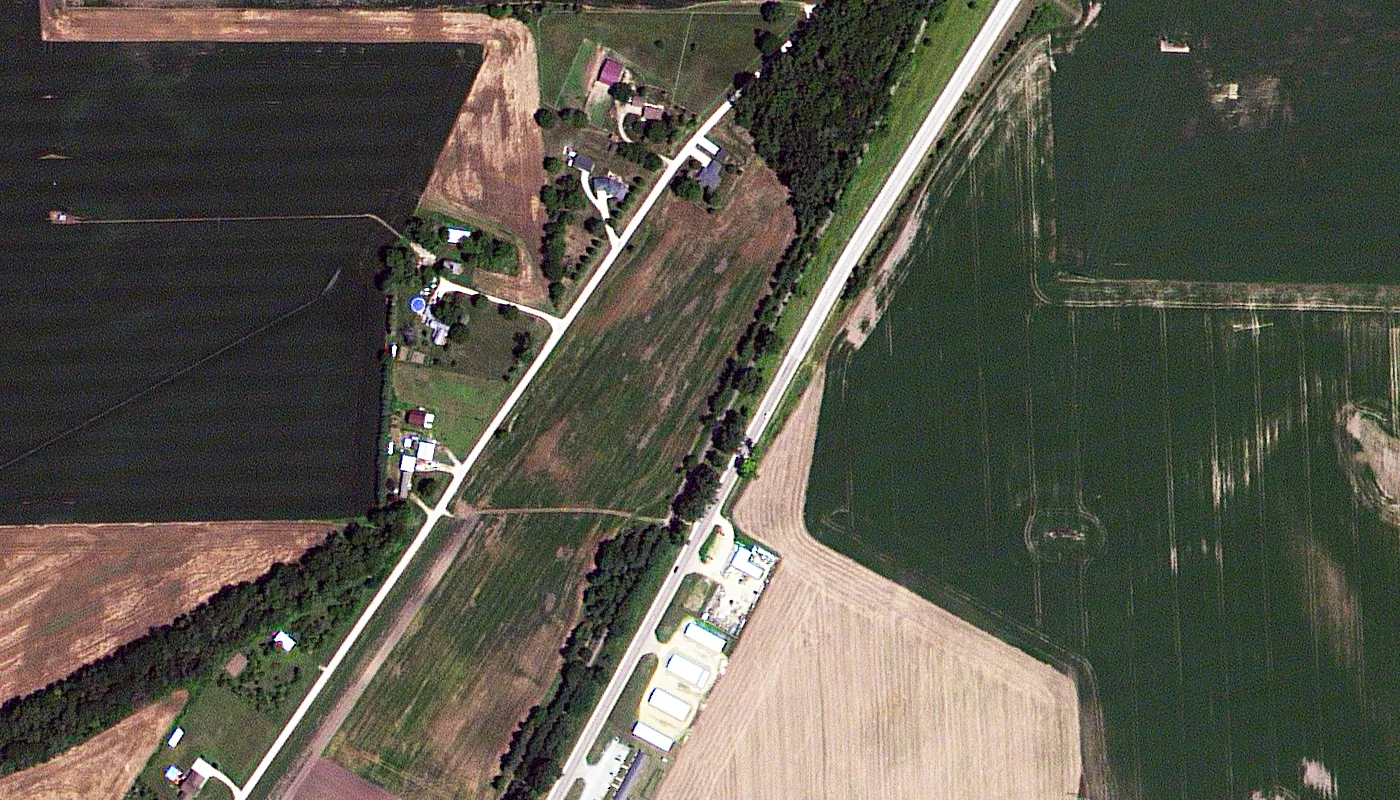
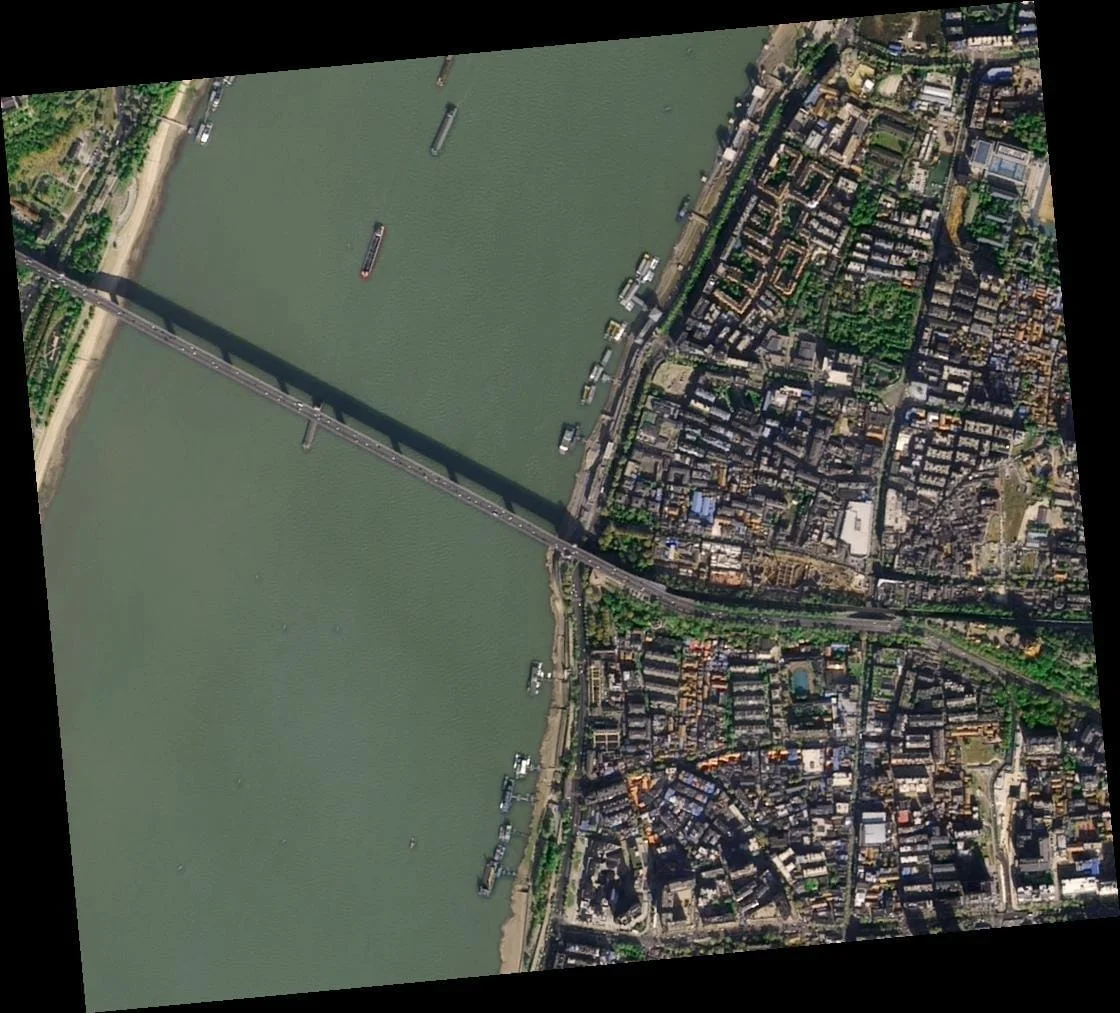
GF-2 and TripleSat resolve to 0.8 m, and ZY-3 to 2.1 m, sharp enough to define management zones and map field boundaries accurately without the cost of a sub-half-meter tasking order. This is the resolution range most precision agriculture programs actually run on day to day, since dividing a farm into zones does not need to see individual plants, just where one zone's soil and vigor pattern ends and the next one's begins. Elsewhere in the industry, subscription platforms built around Planet Labs' PlanetScope constellation cover similar ground at roughly 3.7 m with genuinely daily global revisit, a tradeoff worth knowing about if the priority is catching a change the day it happens rather than matching the sharper pixel sizes named here.
04. Variable-rate prescription mapping
Imagery in this band imports directly into GIS software to generate prescription maps for variable-rate seeding and fertilizer application, telling equipment where to apply less in a historically weak zone and full rate where the data shows the field can support it. It is the step that turns a vegetation-index map into an actual machine-control file rather than a picture.
05. Seasonal growth tracking and harvest timing
GF-6 combines a 2 m panchromatic band with an 8 m multispectral band and a swath that scales from 90 km up to 800 km in a single pass, wide enough to survey an entire agricultural belt in one acquisition. It was also the first satellite in its fleet to add a dedicated Red Edge band, giving broad regional surveys the same crop-stress sensitivity the finer tier above gets at a much smaller footprint. Run across a season, that combination is enough to track crop maturity and flag the right harvest window without tasking sub-meter imagery every week.
| Satellite | Resolution | Revisit | Notable band | Pricing |
|---|---|---|---|---|
| GF-2 | 0.8 m | Up to 5 days | RGB + NIR | $5/km² archive, $8 to $10/km² tasking |
| TripleSat Constellation | 0.8 m | Daily | RGB + NIR | $5/km² archive, $8 to $10/km² tasking |
| ZY-3 | 2.1 m | 3 to 5 days | RGB + NIR, stereo | $5/km² archive, $8 to $10/km² tasking |
| GF-6 | 2 m PAN, 8 m MS | Networked with GF-1, about 4 days | Red Edge (690 to 770 nm) | $5/km² archive, $8 to $10/km² tasking |
Moderate and wide-swath resolution, 8 to 30 m
Past a certain point, an agriculture imaging question is no longer about one field, it is about a county, a province, or a whole growing season.
06. Regional crop yield estimation

CBERS-04 and 04A cover this range at 5 to 60 m depending on the camera, with an onboard infrared multispectral scanner built specifically for regional-scale work, and GF-1's 8 to 16 m wide-field imager adds an 830 km swath on top. At this resolution, county and regional-level yield models built from multi-temporal imagery now reach up to 85% accuracy, proof that finer pixels are not what regional forecasting actually needs, temporal depth and coverage area matter more.
07. Soil moisture, drought risk, and smart irrigation
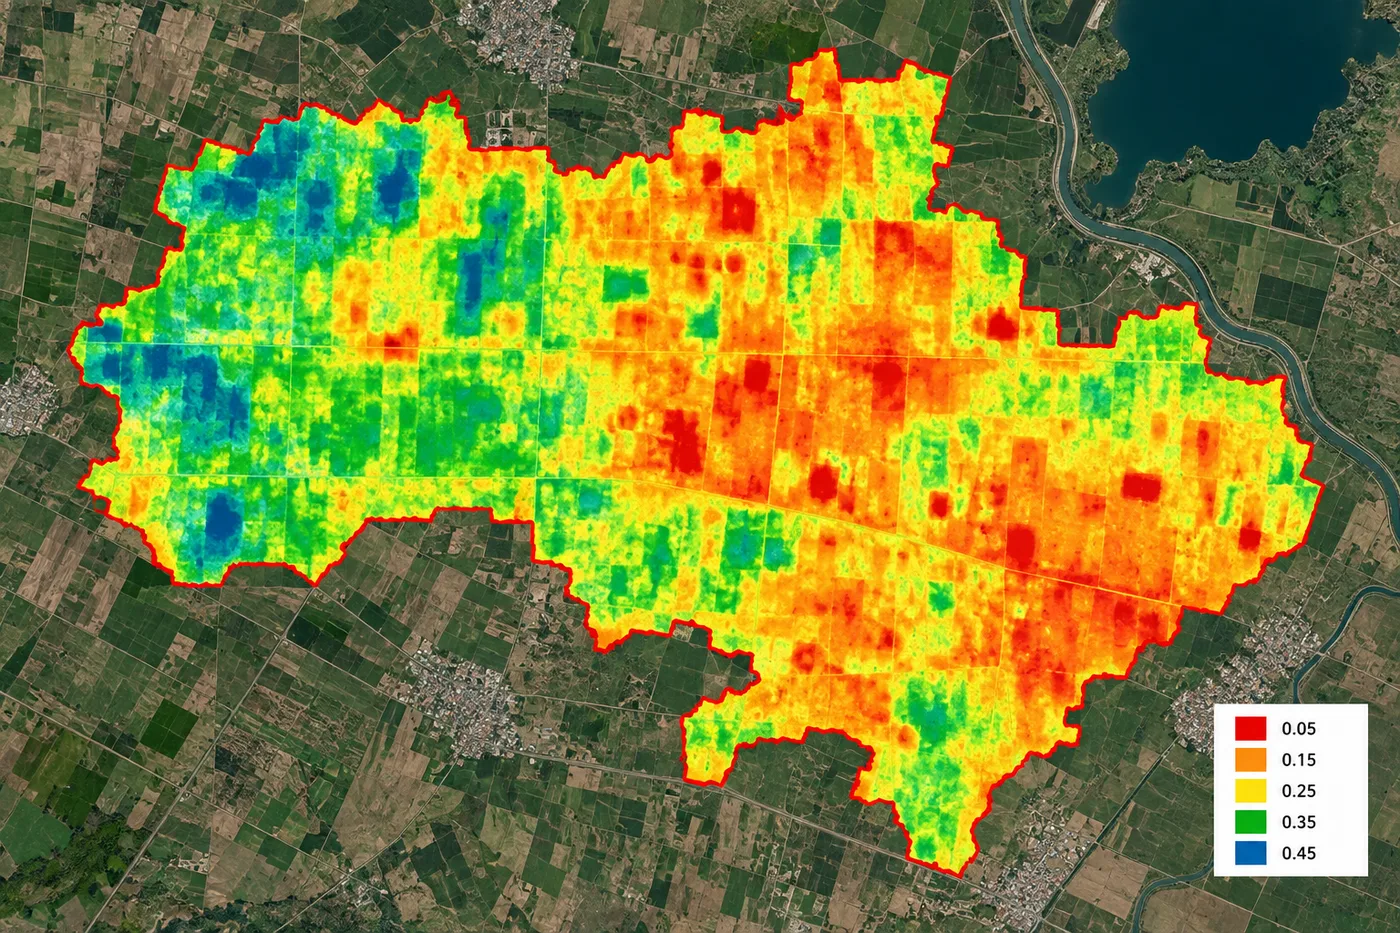
GF-5 and GF-5B add a 330-band hyperspectral sensor at 30 m, fine enough spectrally, if not spatially, to separate a genuine drought signal from a nutrient or pest problem that looks similar on a standard index map. Paired with open-access Sentinel-2 at 10 m and Landsat's 15 to 30 m archive going back to 1982, this tier covers field-scale soil moisture mapping and smart irrigation scheduling at a fraction of the cost of tasking a high-resolution satellite for the same footprint.
08. Agricultural census and subsidy verification
Large-scale agricultural censuses, subsidy distribution audits, and multi-decade land-cover change all run on this same wide-swath tier, since the question is coverage and consistency over time, not fine spatial detail. A government agency verifying that a subsidized region actually planted what it claimed does not need to see individual plants, it needs the same sensor pointed at the same region every season for years.
| Satellite | Resolution | Revisit | Best for | Pricing |
|---|---|---|---|---|
| GF-1 (WFI) | 8 to 16 m | Up to 4 days | Regional drought and crop monitoring | $1/km² archive, $2/km² tasking |
| CBERS-04 / 04A | 5 to 60 m | 3 to 5 days | Regional yield baselines | $1/km² archive, $2/km² tasking |
| GF-5 / GF-5B | 30 m, 330 bands | About 2 days | Soil and crop-stress spectral analysis | $1/km² archive, $2/km² tasking |
| Sentinel-2 | 10 m | 5 days | Open-access vegetation index tracking | Free |
| Landsat 4 to 9 | 15 to 30 m | 8 to 16 days | Multi-decade land-cover trends | Free |
Resolution, coverage, and price side by side
Pulling the three tiers into one view makes the actual tradeoff obvious, sharper pixels cost more and see less ground per pass, not the other way around.
| Tier | Resolution | Best matched to | Typical price range |
|---|---|---|---|
| Very high / super high | 0.25 to 0.5 m | Plant-level scouting, pest and disease detection, land-conversion checks | $13 to $30/km² |
| High | 0.8 to 2 m | Field boundaries, variable-rate maps, seasonal growth tracking | $5 to $10/km² |
| Moderate / wide-swath | 8 to 30 m | Regional yield modeling, soil moisture, census and subsidy work | $1 to $2/km², or free |
Which resolution tier should you actually pick
Three quick rules cover most agriculture imaging decisions, and none of them start with "buy the sharpest option."
- For micro-field stress and disease scouting, pick 0.25 to 0.5 m with Red Edge and Yellow spectral bands, since the question is about one plant or one corner of a field, not the whole property.
- For seasonal scouting and variable-rate prescriptions, pick 0.8 to 2 m, the resolution that balances spatial detail against the wider swath a working farm actually needs pass after pass.
- For regional yield modeling and soil moisture tracking, pick 8 to 30 m wide-swath multispectral or hyperspectral data, where temporal depth and coverage area matter more than pixel count, and open-access sources often cover the job at no cost.
For the full breakdown of resolution tiers across every industry, not just agriculture, see our guide to choosing the right satellite image resolution. If you already know your tier and want the imagery itself, our agriculture satellite imagery page covers tasking and archive search for every satellite named above.
Key takeaways
- Agricultural imagery resolution is not a single number, three tiers cover everything from single-plant scouting to national crop statistics.
- Very high to super high resolution, 25 to 50 cm, is the only tier fine enough for early pest and disease detection and spotting unauthorized land conversion.
- High resolution, 0.8 to 2 m, is where most precision agriculture programs actually operate day to day, balancing detail against swath.
- Moderate and wide-swath resolution, 8 to 30 m, powers regional yield models that reach up to 85% accuracy, and much of it is free through open-access programs.
- Price runs opposite to swath, not opposite to resolution alone, the sharpest tier costs the most per square kilometer and covers the least ground per pass.
- Revisit frequency swings just as wide as resolution does, from daily on TripleSat and SuperView Neo-1 to 8 to 16 days on Landsat, and matters as much as pixel size for time-sensitive decisions.
- Below about 25 cm, satellites give way to drones, single-tree canopy and orchard gap measurements are a UAV job flown at 2 to 7 cm, not a satellite tasking order.
Frequently asked questions
What is the best satellite resolution for agriculture?
The best satellite resolution for agriculture ranges from 25 cm to 30 m, depending on the task. Plant-level scouting and pest detection need 25 to 50 cm. Field boundary mapping and variable-rate prescriptions run well on 0.8 to 2 m. Regional yield modeling and soil moisture tracking are better served by 8 to 30 m wide-swath data, which is often available free through open-access programs.
What resolution do I need for crop scouting and disease detection?
25 to 50 cm imagery with Red Edge and Yellow spectral bands is the tier built for this. It resolves individual plants and rows, and the Red Edge and Yellow bands flag chlorophyll decline and nutrient stress days before a problem is visible to the eye.
What resolution is best for precision agriculture and variable-rate maps?
0.8 to 2 m resolution is the standard tier for precision agriculture. It is sharp enough to define management zones and field boundaries accurately, and imports directly into GIS software to generate variable-rate seeding and fertilizer prescription maps.
What resolution is used for regional crop yield estimation?
Regional and county-level yield models typically run on 8 to 30 m wide-swath multispectral or hyperspectral data. Multi-temporal coverage over a whole growing season matters more than fine spatial detail at this scale, and current models reach up to 85% accuracy at the county level.
Can free satellite data be used for agriculture imaging?
Yes. Open-access programs such as Sentinel-2 at 10 m and the Landsat archive at 15 to 30 m cover most regional agriculture imaging needs at no cost, including vegetation index tracking, drought monitoring, and multi-decade land-cover trend analysis.
What spectral bands matter most for agricultural imagery?
Near-infrared and Red Edge bands matter most for vegetation health and early stress detection. A Yellow band, available on some very high resolution sensors, adds the ability to separate ordinary crop stress from a specific nutrient deficiency, a distinction standard RGB and NIR imagery cannot make on its own.
How wide is the coverage area at each resolution tier?
Very high resolution sensors typically cover a narrower swath per pass since they trade coverage for detail. High resolution satellites such as GF-6 scale up to an 800 km swath. Wide-swath moderate resolution sensors such as GF-1's wide field imager cover as much as 830 km in a single pass, built specifically for regional and national-scale monitoring.
Does higher resolution always mean better agricultural imaging?
No. Higher resolution means a smaller ground footprint per pass and a higher price per square kilometer. A regional yield or drought study gains nothing from 25 cm pixels and loses coverage and budget by using them, while a single-field pest outbreak is invisible at 30 m no matter how many images are collected.
How much does high resolution agricultural imagery cost?
Very high to super high resolution imagery, 25 to 50 cm, generally runs $13 to $20 per square kilometer from archive and $20 to $30 per square kilometer for new tasking. High resolution imagery at 0.8 to 2 m is considerably cheaper, typically $5 to $10 per square kilometer.
Can satellite imagery replace drones for orchard or tree-level analysis?
Not below about 25 cm. Even the sharpest commercial satellites stop short of resolving individual tree canopies or gaps under 50 square meters reliably. Orchard operators typically use satellite imagery for property-wide monitoring and bring in a drone, flown at 2 to 7 cm, for single-tree canopy volume, gaps, or spray-target measurements.
Sources and further reading
- China Siwei, SuperView Neo-1 and SuperView-2 (GFDM) satellite specifications and spectral band configuration
- CAST and CRESDA, GF-1, GF-2, GF-5, GF-5B, and GF-6 satellite mission specifications
- China Siwei and 21AT, TripleSat Constellation and ZY-3 satellite specifications
- ESA Copernicus, Sentinel-2 mission specifications and open-access data policy
- NASA and USGS, Landsat 4 to 9 mission history and archive access
- Planet Labs, PlanetScope constellation resolution and daily revisit documentation
- Peer-reviewed UAV research on orchard canopy measurement and satellite-to-drone resolution gaps
Not sure which tier fits your field?
Search our live archive across every resolution tier above, from 25 cm scouting imagery to free wide-swath data, or task new coverage over your growing region.