How Satellite Imagery Tells Smallholder and Commercial Farms Apart
On this page
- Why field size is the strongest signal a satellite picks up on
- Matching resolution to the field size you need to resolve
- How the classification actually works
- 01. Segment the image into candidate field objects
- 02. Extract shape, size, and texture features per object
- 03. Classify with a trained model
- 04. Validate against a second pass later in the season
- The commercial-farm signature satellites look for
- Crop calendars and intercropping as a second signal
- Real datasets and case studies from across the continent
- What this means for ordering imagery over a mixed landscape
- Frequently asked questions
- Sources and further reading
A practical guide to how high-resolution satellite imagery distinguishes smallholder from commercial farming systems, why field size is the strongest signal, what resolution actually resolves a sub-hectare plot, how classification algorithms turn imagery into a field-by-field map, and what real datasets and case studies from sub-Saharan Africa show about the accuracy this gets you.
Quick answer
Satellite imagery separates smallholder from commercial farming mainly through field size and shape. Smallholder plots across sub-Saharan Africa average well under half a hectare and sit in irregular, densely packed clusters, while commercial operations run in uniform rectangular blocks or circular center-pivot fields from tens to hundreds of hectares. Telling them apart reliably needs sub-meter to 3 m imagery, since Sentinel-2's 10 m pixels are too coarse to resolve a field half that size, combined with object-based classification and multi-temporal analysis that also picks up a second signal, smallholder systems' irregular, intercropped planting versus a commercial block's synchronized, single-crop calendar.
Why field size is the strongest signal a satellite picks up on
Across several sub-Saharan African countries, roughly half of all cultivated fields are smaller than 0.4 hectares, and about a quarter are under 0.2 hectares. In Mozambique, a commonly cited national study found half of all fields smaller than 0.16 hectares, 83% under 0.5 hectares, and a mean field size of just 0.32 hectares. That is the scale a classification system has to resolve before it can even ask what crop is growing, a smallholder plot is frequently smaller than a single pixel on a coarse sensor, let alone a recognizable shape.
Commercial operations sit at the other end of the same scale. A standard center-pivot irrigation unit in South Africa typically covers 30 to 40 hectares on its own, and a single commercial operation often runs three to ten pivots across 200 to 600 hectares or more. In Zambia, roughly 2,500 large-scale commercial farms operate at a similar scale, with some single estates managing close to 2,000 hectares. A classification system doesn't need to know anything about the crop to flag that contrast, size and shape alone separate the two systems most of the time.
Matching resolution to the field size you need to resolve
Pixel size sets a hard floor on what a classifier can even attempt to separate. A field smaller than roughly 2 to 3 pixels across is reduced to a handful of mixed-signal pixels, usually unusable for shape-based classification no matter how good the algorithm is.
| Resolution | Source tier | Smallest reliable field size | Fit for sub-Saharan smallholder mapping |
|---|---|---|---|
| 25–50 cm | Commercial, SuperView Neo / Beijing-3 (21AT) | Well under 0.1 ha | Resolves nearly all smallholder plots, including sub-0.2 ha fields |
| 80 cm–1 m | Commercial archive tier | Around 0.1–0.2 ha | Resolves most smallholder plots; the smallest fragments still blur |
| 3 m | Planet (PlanetScope), daily revisit | Around 0.3–0.5 ha | Captures larger smallholder plots and all commercial fields; misses the smallest fragments |
| 10 m | Free, Sentinel-2 | Around 1–2 ha | Reliable for commercial blocks only; most smallholder plots fall below this floor |
| 30 m | Free, Landsat-8/9 | Around 3–5 ha | Commercial-scale monitoring only |
This is exactly why published research keeps landing on the same conclusion, free 10 m to 30 m data works for tracking commercial blocks and regional cropland extent, but mapping individual smallholder fields requires 3 m PlanetScope data at minimum, and sub-meter commercial imagery to resolve the smallest fragments cleanly. For the full breakdown of what each resolution tier costs and where it's worth paying for it, see our guide to choosing the right satellite resolution for agriculture.
How the classification actually works
Separating farm types from raw pixels is a multi-step process, not a single pass. Most operational systems, including the ones behind the national-scale African field maps referenced further down this page, follow roughly the same sequence.
01. Segment the image into candidate field objects
Rather than classifying pixel by pixel, object-based image analysis first groups neighboring pixels with similar spectral and textural properties into candidate objects, each meant to represent one real field. Canny edge detection combined with watershed segmentation is a commonly used, well-validated method for this step, tracing field boundaries from contrast edges in the imagery rather than a fixed grid.
02. Extract shape, size, and texture features per object
Each candidate field object is then scored on measurable properties, area, perimeter-to-area ratio, shape regularity, and image texture, calculated from panchromatic contrast patterns across the object. Smallholder plots score small, irregular, and texturally rough; commercial blocks score large, rectangular or circular, and textually uniform.
03. Classify with a trained model
A machine learning classifier, commonly Random Forest or a convolutional neural network, is trained on labeled examples of known smallholder and commercial fields, then applied across the full scene. This is the step that turns measured features into an actual map, like the classified output shown below.

04. Validate against a second pass later in the season
A single-date classification can mistake a fallow smallholder plot or a newly cleared commercial field for the wrong category. Rerunning the classification at a second point in the growing season, and comparing the two, catches fields that were ambiguous on either individual date and is the main way operational systems push past 80% accuracy.
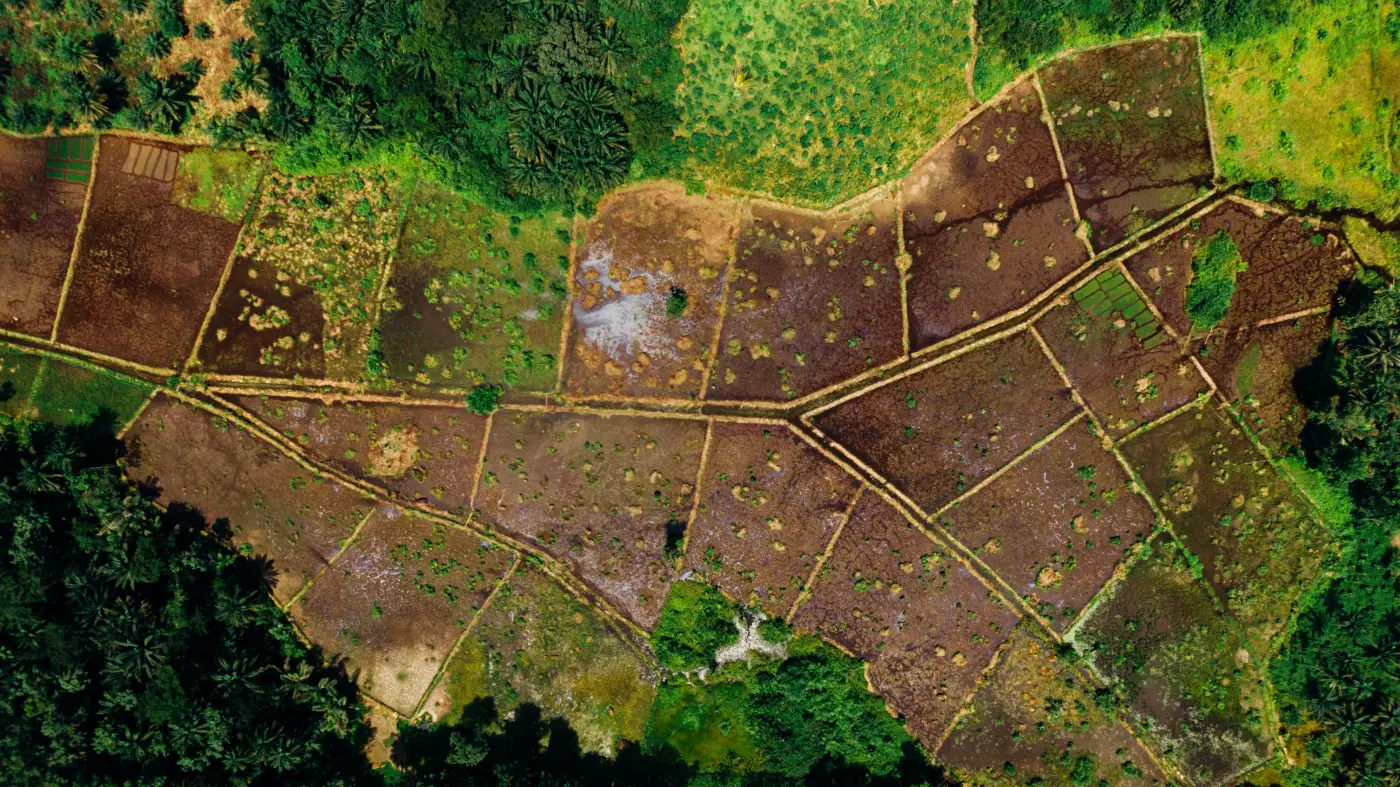
Real boundaries drawn this way look like the patchwork below, close to the ground truth a field agent would map by hand, just produced from orbit at national scale instead of one village at a time.

Need field-level imagery over a specific area in Africa?
Search free archive imagery or task a fresh sub-meter capture, with an instant price estimate before you order.
The commercial-farm signature satellites look for
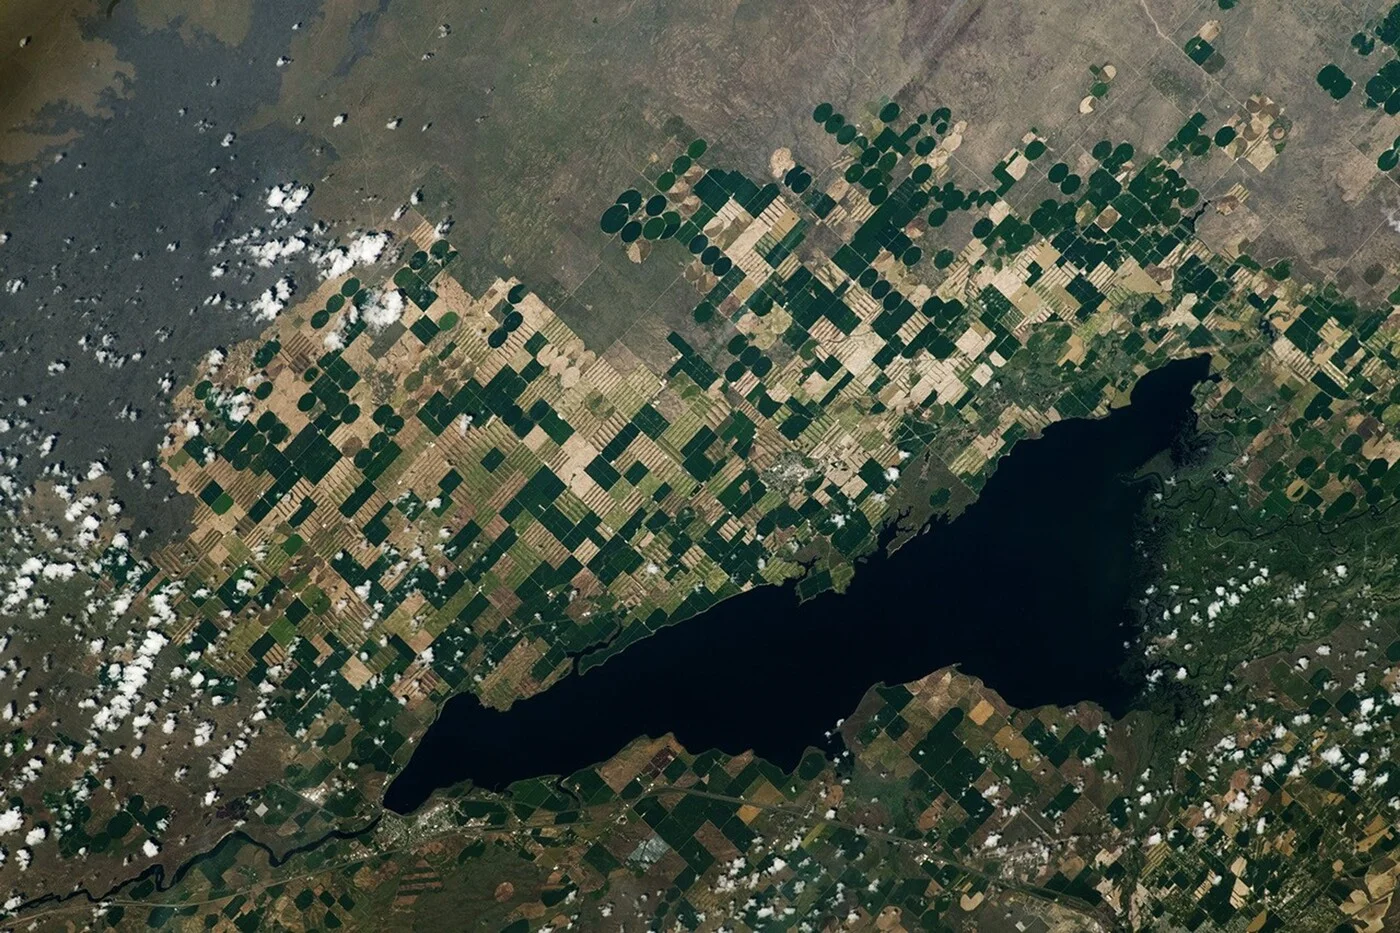
Large-scale commercial agriculture leaves a geometric signature that's almost the inverse of a smallholder landscape, regular, large, and often literally circular. Center-pivot irrigation is the clearest example, a rotating arm pins one end to a well and traces a perfect circle as it waters, producing a field boundary no smallholder system would ever naturally produce.
Beyond shape, commercial blocks tend to be internally uniform in a way a classifier can measure directly, one crop, one planting date, one harvest window, producing a flat, consistent texture across the whole object. A smallholder cluster packs several crops, planting dates, and growth stages into an area the same classifier would expect to be a single field, which is a second, independent signal on top of size alone.
Crop calendars and intercropping as a second signal
Size and shape are a strong first pass, but multi-temporal imagery adds a signal that geometry alone can't, timing. Smallholder systems in sub-Saharan Africa frequently intercrop, planting two or more crops in the same plot on staggered schedules, which shows up in a satellite time series as a field with no single clean green-up and senescence curve, several overlapping ones instead.
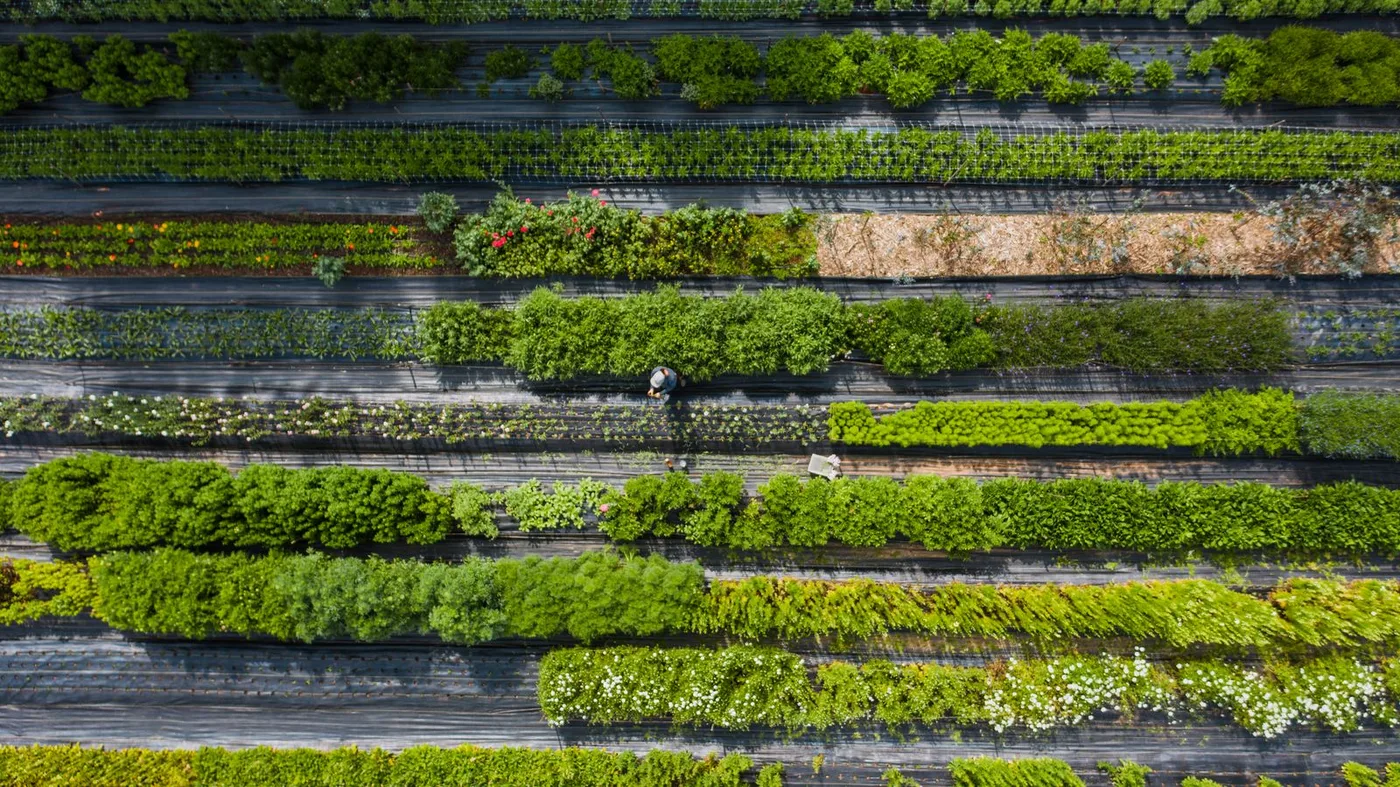
A commercial block run as a monoculture does the opposite, one synchronized planting date and one harvest window across the entire field, producing a single, clean vegetation curve that repeats predictably across every pivot or block in the operation. Multi-temporal Sentinel-1 radar adds a further, cloud-proof version of this same signal, tracking how much a field's backscatter varies week to week, since a uniform commercial block varies far less over the season than a mixed smallholder plot does.
Real datasets and case studies from across the continent
This isn't a theoretical pipeline, it's been run at national and regional scale across multiple African countries, with published accuracy figures to show for it.
Smallholder vs commercial mapping, in numbers
A few figures that put the field-size gap and the classification accuracy it drives into perspective.
Share of fields across several African countries smaller than 0.4 hectares, the core challenge any classifier has to resolve.
Mean smallholder field size measured in a national Mozambique study, with half of all fields under 0.16 hectares.
Typical size of a single standard center-pivot commercial unit in South Africa, scaling to 200 to 600-plus hectares per operation.
Classification accuracy gained in northwestern Benin by combining optical and radar data over optical alone, reaching about 75% overall.
In Ethiopia's Tigray region, researchers mapped smallholder crop area wall-to-wall using sub-meter WorldView panchromatic image texture, a direct application of the texture-based classification covered above, in a landscape too fragmented for coarser sensors to handle. In Kenya, a multi-temporal Sentinel-1 approach uses a coefficient-of-variation calculation across the season specifically to separate smallholder cropland from other land cover for food security monitoring, the same radar-variability signal described above. In Ghana and South Sudan, combined Sentinel-1, Sentinel-2, and Planet imagery reached 57% to 85% classification accuracy depending on the site, and Morocco's Haouz Plain reached 85.6% overall accuracy using Sentinel-2 time series alone, in a landscape with larger, more regular fields than most smallholder regions.
On the dataset side, NASA Harvest and Radiant Earth Foundation ran a public Field Boundary Detection Challenge built specifically around smallholder farms in eastern Rwanda, using Planet imagery labeled for an entire growing season. That effort feeds into Fields of The World, a benchmark dataset now spanning 24 countries on four continents, including Kenya, South Africa, and Rwanda, built specifically so field-boundary models can be trained and tested across genuinely different farming systems rather than one region at a time.
What this means for ordering imagery over a mixed landscape
The practical takeaway scales with what's actually being asked. Confirming whether a region is smallholder or commercial-dominated, or tracking commercial block boundaries over time, is well served by free 10 m Sentinel-2 data layered with Sentinel-1 radar for cloud-proof monitoring. Mapping individual smallholder plots, verifying a specific farmer's field boundary, or supporting a crop-insurance or land-tenure use case down to a 0.2 hectare parcel needs 3 m Planet data at minimum, and sub-meter commercial tasking where boundary precision actually matters. Multi-temporal coverage matters more than a single sharp image either way, since both the geometric and the crop-calendar signal this page covers depend on comparing more than one date.
Key takeaways
- Field size is the strongest signal separating smallholder from commercial farming, roughly half of sub-Saharan African fields are under 0.4 hectares, against commercial center-pivot units of 30 to 40-plus hectares.
- Sentinel-2's 10 m pixels are too coarse for most smallholder plots; reliable mapping needs 3 m PlanetScope data at minimum, and sub-meter commercial imagery for the smallest fragments.
- Classification runs as a pipeline, segmenting the image into field objects, scoring shape and texture, classifying with a trained model, then validating against a second date later in the season.
- Commercial farms carry a distinct geometric signature, large rectangular blocks or circular center-pivot fields with a single, synchronized crop calendar.
- Multi-temporal analysis adds a second, independent signal beyond geometry, smallholder intercropping produces overlapping vegetation curves that a commercial monoculture's single clean curve doesn't.
- Published studies across Mozambique, Ethiopia, Kenya, Ghana, South Sudan, and Morocco report 57% to 85%-plus classification accuracy using these methods today.
Frequently asked questions
How does satellite imagery tell smallholder farms from commercial farms?
Mainly by field size and shape. Smallholder plots in sub-Saharan Africa average well under half a hectare and form irregular, densely packed clusters, while commercial farms run in large, uniform rectangular blocks or circular center-pivot fields from tens to hundreds of hectares. Classification adds a second signal from crop calendar timing, a synchronized single-crop curve for commercial blocks versus overlapping intercropped curves for smallholder plots.
What resolution is needed to map smallholder fields in Africa?
At minimum, 3 m PlanetScope imagery, which resolves fields down to roughly 0.3 to 0.5 hectares. Sentinel-2's free 10 m data is generally too coarse, since most smallholder fields in the region fall below its 1 to 2 hectare reliable floor. Sub-meter commercial imagery is needed to resolve the smallest sub-0.2 hectare fragments cleanly.
How small can a field be and still show up in satellite imagery?
A field needs to span roughly 2 to 3 pixels across to be usable for shape-based classification. At 25 to 50 cm commercial resolution that covers nearly any real field, including the smallest sub-0.1 hectare smallholder plots; at Sentinel-2's 10 m resolution, only fields above roughly 1 to 2 hectares are reliably resolved.
Can satellites identify crop types on smallholder farms?
Yes, though it's harder than on commercial fields because smallholder plots often intercrop multiple species with similar phenology in one small area. Combining high-resolution optical imagery with multi-temporal radar (SAR) data has improved classification accuracy by 10 to 15 percentage points in published African studies, reaching 57% to 85%-plus overall accuracy depending on the site.
What does a commercial farm look like from satellite imagery?
Large, geometrically regular fields, rectangular blocks or, where center-pivot irrigation is used, perfect circles from a rotating irrigation arm. A standard center-pivot unit in South Africa covers 30 to 40 hectares, with full operations spanning several hundred to over a thousand hectares across multiple pivots.
Does cloud cover limit crop mapping in sub-Saharan Africa?
Yes, during the growing season in many regions. This is why operational systems increasingly combine optical imagery (Sentinel-2, Planet, or commercial sensors) with Sentinel-1 radar, which images through cloud cover and adds a crop-calendar signal based on how much a field's radar backscatter varies over the season.
What free datasets exist for African field boundaries?
Fields of The World (FTW) is a public benchmark dataset spanning 24 countries on four continents, including Kenya, South Africa, and Rwanda, pairing labeled field boundaries with Sentinel-2 imagery. It builds on earlier work including the NASA Harvest and Radiant Earth Foundation Field Boundary Detection Challenge, based on labeled Planet imagery over smallholder farms in eastern Rwanda.
Sources and further reading
- PMC / peer-reviewed review: optical and radar imagery for crop type classification in Africa, field-size statistics and classification accuracy by country
- National field-size study, Mozambique, mean and distribution of smallholder field sizes
- ScienceDirect: smallholder crop area mapping using WorldView sub-meter panchromatic image texture, Tigray, Ethiopia
- Multi-temporal Sentinel-1 SAR coefficient-of-variation approach for smallholder mapping, Kenya
- NASA Harvest and Radiant Earth Foundation: Field Boundary Detection Challenge, eastern Rwanda
- Fields of The World (FTW), a machine learning benchmark dataset for global agricultural field boundary segmentation, 24 countries
- South Africa and Zambia commercial center-pivot irrigation scale and farm-count figures
- XRTech Group: commercial satellite resolution tiers and tasking options, 2026
For the resolution economics behind this comparison, see our guide to the best satellite resolution for agriculture, and for how subsistence farming compares to commercial scale more broadly, see intensive subsistence farming.
Mapping farm systems across a region in Africa?
Search free archive imagery or task a fresh high-resolution capture for field-level classification, with an instant price estimate.