Key Mineral Alteration Signatures Satellites Detect
On this page
- What Mineral Alteration Signatures Are
- Key Mineral Alteration Signatures Satellites Detect
- The Porphyry Alteration Zonation Model
- How Satellite Technology Detects These Signatures
- 01. Spectral analysis and band ratios
- 02. Principal Component Analysis
- 03. AI and deep learning fusion
- Case Study From Cuprite, Nevada
- Cuprite, Nevada, the industry's benchmark alteration map
- Why Alteration Mapping Matters for Exploration Teams and Landowners
- Frequently asked questions
- Sources and further reading
A practical guide to the key mineral alteration signatures satellites detect, the specific clay, iron oxide, and mafic minerals that mark a hydrothermal system, the diagnostic wavelengths and band ratios that isolate them, and how the classic porphyry alteration zonation model ties them together into a single exploration target.
Quick answer
Mineral alteration signatures are the specific clay, iron oxide, and mafic mineral assemblages that hydrothermal fluids leave behind around a deposit, and satellites detect them by measuring narrow absorption features in the shortwave infrared and visible-to-near-infrared spectrum that are invisible to the naked eye. Hydroxyl-bearing clays and micas such as kaolinite and sericite, iron oxides such as hematite and goethite, and mafic minerals such as chlorite and epidote each absorb light at their own distinct wavelength, and band ratios or Principal Component Analysis isolate those wavelengths into a classified alteration map that lines up with the industry's standard porphyry zonation model, a potassic core surrounded by phyllic, argillic, and propylitic halos.
What Mineral Alteration Signatures Are
Mineral alteration, often called hydrothermal alteration in exploration geology, is the chemical and mineralogical change a pre-existing rock undergoes when hot, mineral-rich fluids or long-term weathering pass through it. The result is not the ore itself but a halo of new minerals around it, clays, oxides, and mafic silicates that formed as the original rock's chemistry reacted to that fluid. Because this halo is almost always larger than the ore body it surrounds, and because each of its component minerals absorbs light at its own specific wavelength, it is one of the most useful visual and spectral indicators satellite mineral exploration has for gold, copper, lithium, and base-metal deposits.
Key Mineral Alteration Signatures Satellites Detect
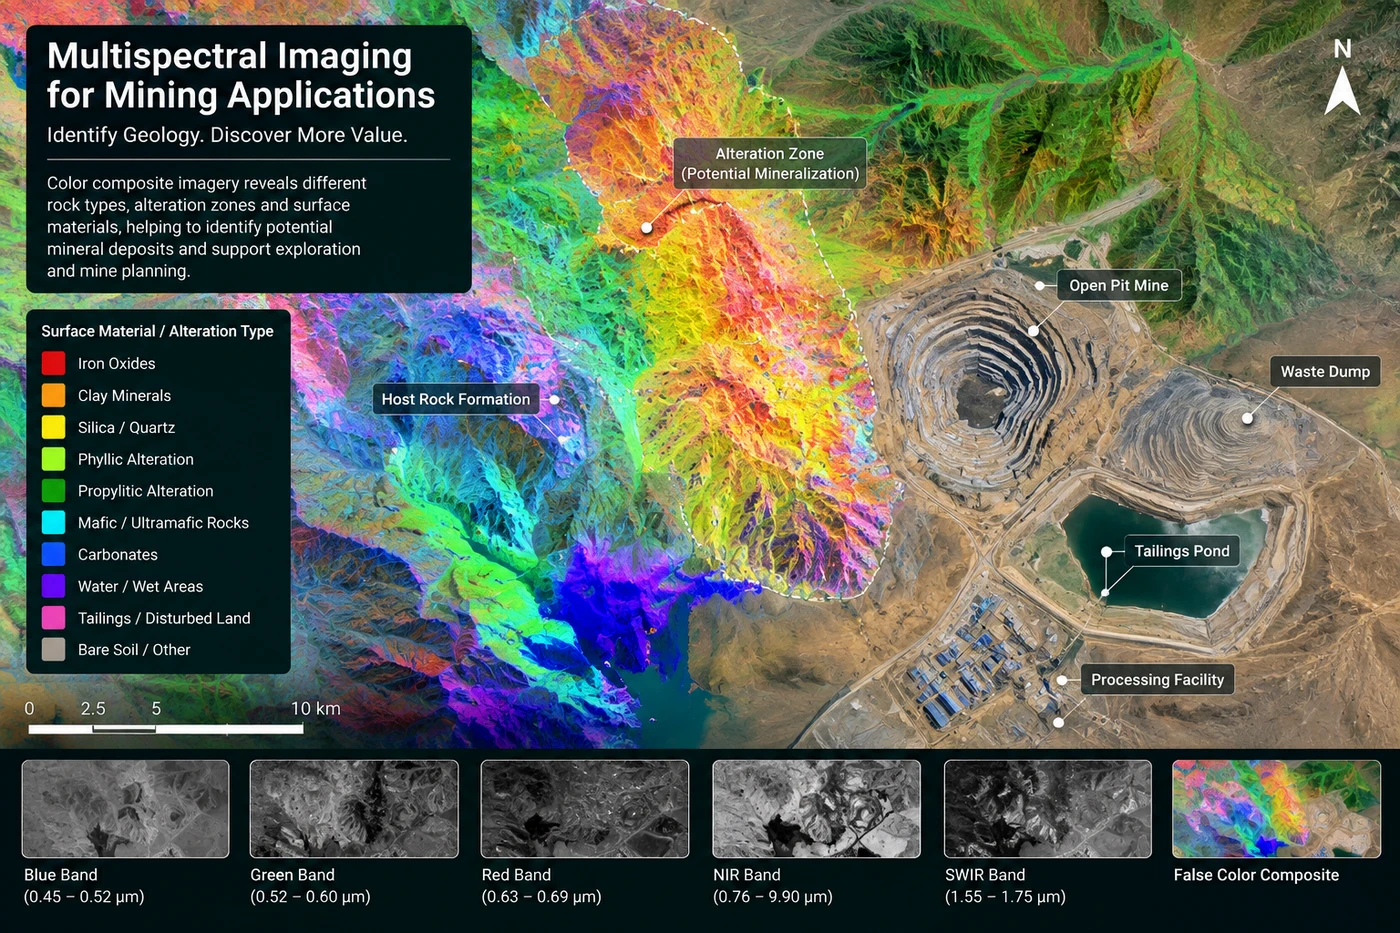
Every mineral in an alteration halo absorbs light at a narrow, repeatable wavelength, mostly in the shortwave infrared for clays and micas, in the visible-to-near-infrared for iron oxides, and in the thermal infrared for silica. These four families cover almost every alteration assemblage a satellite sensor is asked to map.
| Alteration group | Minerals | Diagnostic wavelength | What it indicates |
|---|---|---|---|
| Hydroxyl-bearing clays and micas | Kaolinite | ~2160 and 2209 nm | Advanced argillic alteration, often close to a mineralized core |
| Hydroxyl-bearing clays and micas | Sericite, illite | ~2200 nm | Phyllic alteration halo around a porphyry system |
| Hydroxyl-bearing clays and micas | Alunite | ~1480 and 2170 nm, shifting to longer wavelengths toward the intrusion center | High-sulfidation epithermal systems, and a vectoring tool toward the ore center |
| Iron oxides and hydroxides | Hematite | ~880 nm | Oxidized gossan cap over a sulfide body |
| Iron oxides and hydroxides | Goethite, jarosite | ~920 nm | Weathered, acid-sulfate alteration zone |
| Mafic and metamorphic alteration | Chlorite | ~2250 and 2340 nm | Propylitic alteration at the outer edge of a system |
| Mafic and metamorphic alteration | Epidote | ~2267 nm, with a stronger 2350 nm feature | Propylitic zone, distal from the mineralized core |
| Silica and advanced argillic | Quartz | ~8.29 and 9.07 μm, thermal infrared, not SWIR | Silicified cap, often the innermost, highest-temperature zone of a system |
The Porphyry Alteration Zonation Model
These signatures rarely occur in isolation. Around a porphyry intrusion, the classic Lowell and Guilbert model, refined further by Sillitoe in 2010, arranges them into predictable concentric zones radiating outward from the causative stock, a potassic core, a phyllic zone, an overlapping argillic zone, and a propylitic halo at the margin. Copper-gold mineralization is concentrated where the potassic core and phyllic zone overlap, which is exactly why mapping the zones from orbit, rather than any single mineral alone, tells an exploration team where inside a multi-kilometer alteration system to actually drill.
How Satellite Technology Detects These Signatures
01. Spectral analysis and band ratios
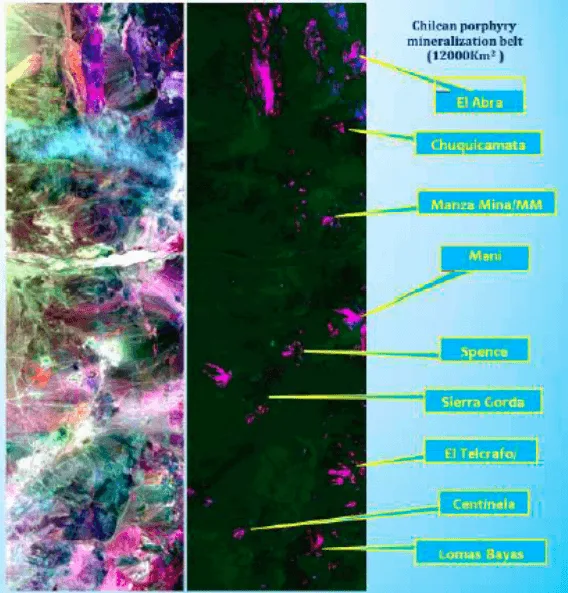
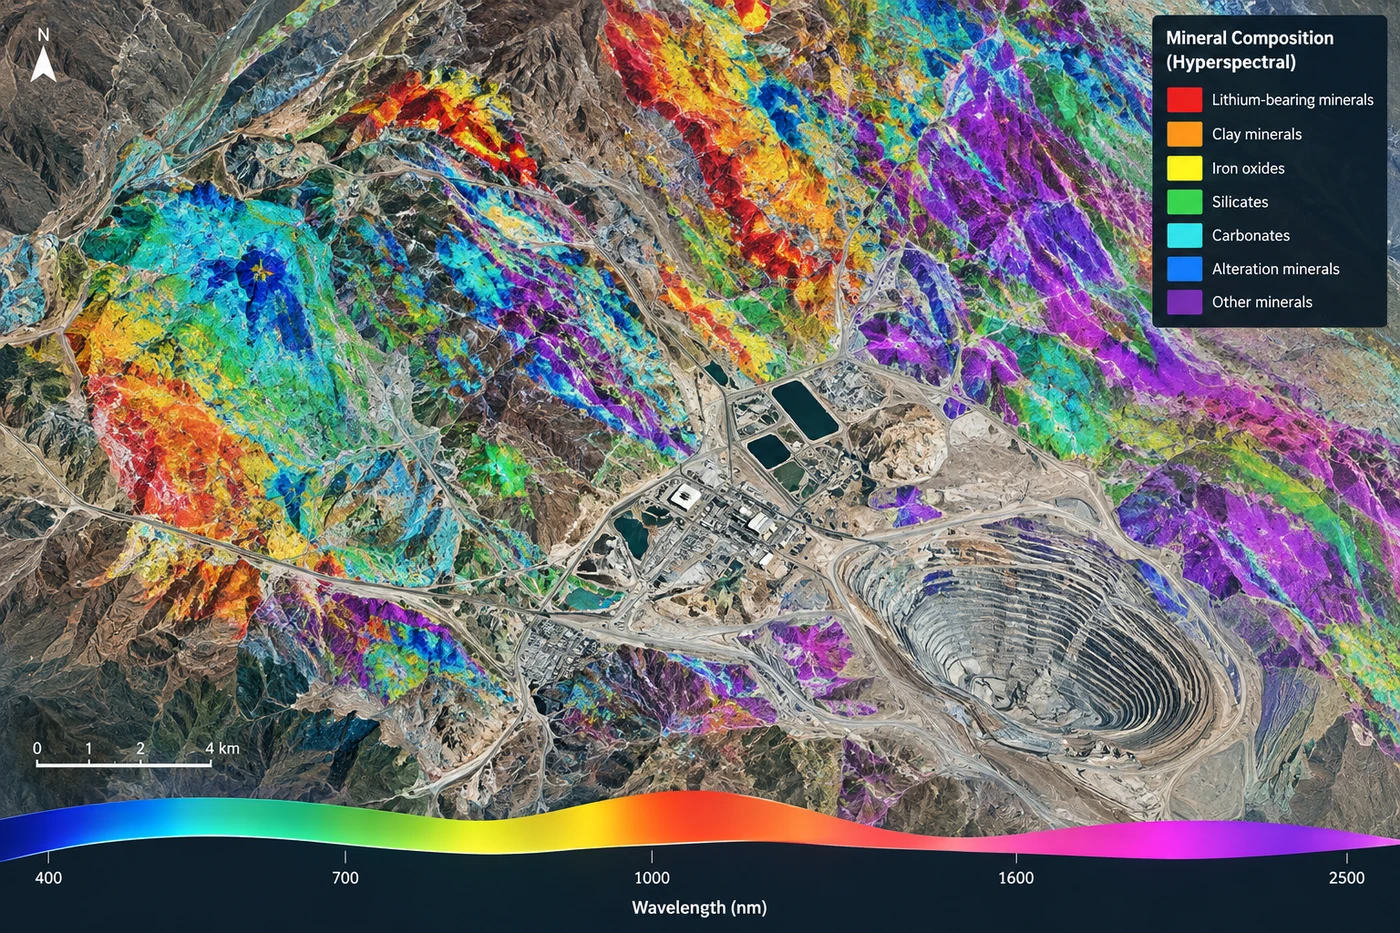
Multispectral and hyperspectral sensors record reflected light in narrow bands across the near-infrared and shortwave infrared, then divide one band by another to cancel out topographic shading and isolate the absorption feature a specific mineral produces. On ASTER, the Band 4-to-Band 6 and Band 4-to-Band 7 ratios are established for targeting kaolinite and muscovite, Band 4-to-Band 2 highlights iron oxides, and Band 6-to-Band 7 isolates hydroxyl-bearing clays as a group. A separate thermal infrared channel picks up what the reflective bands cannot, quartz has its strongest spectral feature not in the SWIR but in the 8 to 12 μm thermal region, where ASTER's five TIR bands capture a diagnostic emissivity doublet near 8.29 and 9.07 μm that maps silicified and advanced argillic zones such as the hydrated silica cap at Cuprite, covered below.
02. Principal Component Analysis
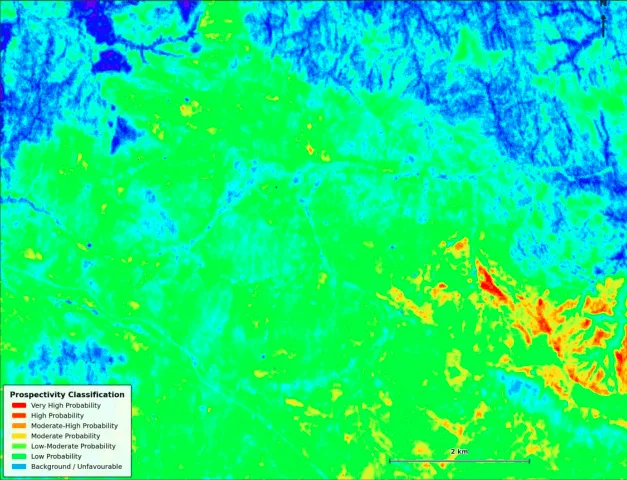
Band ratios work well for one mineral at a time, but a real alteration halo carries several signatures at once. Principal Component Analysis recombines every spectral band into a smaller set of components ranked by how much variation each one explains, which pulls a subtle, mixed alteration anomaly into a single sharp layer that a band ratio alone would blur together.
03. AI and deep learning fusion
Platforms such as XRTech's Khaza'in combine the classified alteration layer with structural fault mapping and Digital Elevation Model terrain data, then calibrate the fused model against real ground-truth mineral samples. The output is a location-specific probability score for the target commodity, gold, copper, or lithium, not just a mineral map but a ranked list of coordinates worth a field visit. The full five-step pipeline behind this fusion step is covered in our guide to how satellites detect minerals and target prospects.

Case Study From Cuprite, Nevada
Cuprite, Nevada, the industry's benchmark alteration map
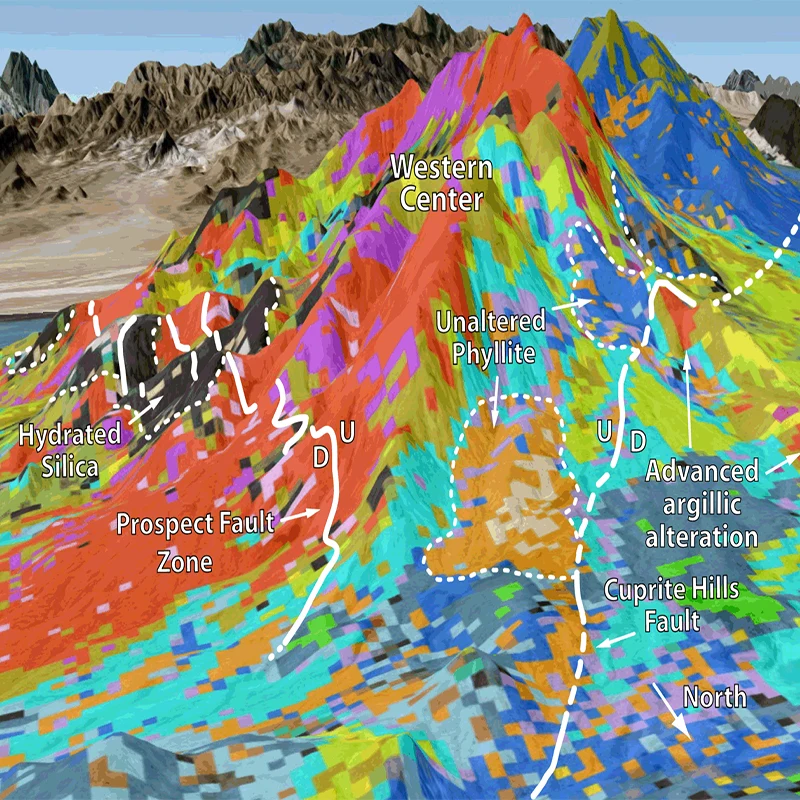
Cuprite sits about 200 km northwest of Las Vegas and carries the same advanced argillic alteration assemblage found at many active ore deposits, but with minimal mining disturbance, which is exactly why the USGS chose it to validate imaging spectroscopy against ground truth. Using AVIRIS hyperspectral data and the Tetracorder spectral-shape matching system, USGS researchers classified the site into silicified, opalized, and argillized zones that form a bullseye pattern on one side of the district and a more linear pattern on the other, matching the concentric alteration zonation described above almost exactly.
- Alteration mapped from Fe-bearing minerals, clays, micas, sulfates, and carbonates, each identified from its own spectral signature
- Zones of hydrated silica, advanced argillic alteration, and named fault structures mapped directly onto 3D terrain
- Published and reused for decades as the standard reference dataset for testing new hyperspectral mineral-mapping algorithms
Want a classified alteration map over your own concession?
Search our multispectral and hyperspectral archive, or request a band-ratio and PCA workup over your area of interest. No account needed for a first estimate.
Why Alteration Mapping Matters for Exploration Teams and Landowners
Exploration teams and landowners alike use a classified alteration map the same way, not to replace drilling, but to replace the guesswork of deciding where to drill first. Instead of walking an entire concession to sample rock by hand, a team can start from a map that already separates a promising potassic-phyllic overlap from a distal propylitic fringe that is unlikely to host ore. That distinction, drawn from wavelengths no eye can see, is what turns a multi-kilometer alteration system into a short, ranked list of coordinates worth a field visit, the same prospectivity workflow covered in full in our guides to how satellites detect minerals and hyperspectral imaging in mineral exploration.
Key takeaways
- Mineral alteration signatures fall into four families, hydroxyl clays and micas, iron oxides and hydroxides, mafic or metamorphic minerals, and silica, each with its own diagnostic wavelength.
- Kaolinite, sericite, and alunite absorb light around 1480 to 2350 nm in the shortwave infrared, while hematite and goethite absorb light around 880 to 920 nm in the visible-to-near-infrared.
- Band ratios isolate one mineral at a time, ASTER's Band 4-to-6 and 4-to-7 ratios target kaolinite and muscovite, while Principal Component Analysis pulls a full mixed alteration halo into a single classified layer.
- The porphyry zonation model arranges these signatures into concentric zones, a potassic core, phyllic, argillic, and propylitic halos, with copper-gold ore concentrated at the potassic-phyllic overlap.
- Cuprite, Nevada remains the industry's benchmark public dataset for validating satellite and hyperspectral alteration-mapping techniques against known ground truth.
Frequently asked questions
What are mineral alteration signatures in satellite mineral exploration?
Mineral alteration signatures are the specific clay, iron oxide, and mafic minerals that hydrothermal fluids or weathering leave behind around a deposit. Each mineral absorbs light at its own narrow wavelength, so a satellite sensor can identify which minerals are present, and therefore what kind of alteration halo it is looking at, without any ground sampling.
What is the difference between mineral alteration and hydrothermal alteration?
They describe the same process. Mineral alteration is the general term for a chemical and mineralogical change in a rock, and hydrothermal alteration is the specific case caused by hot, mineral-rich fluids, which is the mechanism behind nearly every alteration halo satellites are used to map in mineral exploration.
What wavelengths do satellites use to detect mineral alteration?
Hydroxyl-bearing clays and micas such as kaolinite, sericite, and alunite absorb light in narrow bands between about 1480 and 2350 nanometers in the shortwave infrared. Iron oxides and hydroxides such as hematite and goethite absorb light between about 880 and 920 nanometers in the visible-to-near-infrared. Quartz sits in a different part of the spectrum entirely, with a diagnostic emissivity feature near 8.29 and 9.07 micrometers in the thermal infrared, used to map silicified zones. Multispectral sensors sample a handful of broad bands across these ranges, while hyperspectral sensors sample hundreds of narrow, continuous bands for sharper mineral discrimination.
What is the porphyry alteration zonation model?
It is the classic Lowell and Guilbert model, refined by Sillitoe in 2010, describing how alteration minerals arrange themselves in concentric zones around a porphyry intrusion, a potassic core, an overlapping phyllic zone, an argillic zone, and a propylitic halo at the outer margin. Copper and gold mineralization typically concentrates where the potassic core and phyllic zone overlap.
What band ratios are used to map hydrothermal alteration?
On ASTER imagery, the Band 4-to-Band 6 and Band 4-to-Band 7 ratios are established for targeting kaolinite and muscovite, Band 4-to-Band 2 highlights iron oxide minerals, and Band 6-to-Band 7 isolates hydroxyl-bearing clays as a group. These ratios cancel out topographic shading so the remaining signal reflects mineral chemistry rather than terrain.
What is a gossan cap and why does it matter for exploration?
A gossan cap is an oxidized, iron-rich crust of hematite, goethite, and jarosite that forms at the surface directly above a weathered sulfide deposit. Because it sits right above the ore and has a strong, easily detected visible-to-near-infrared signature, a gossan cap is often the first surface clue an exploration team, or a satellite, has that a sulfide system lies beneath.
Can free satellite data detect mineral alteration, or is hyperspectral data required?
Free multispectral data such as Landsat 8/9 and Sentinel-2 can flag broad alteration zones and separate iron oxides from hydroxyl clays as groups. Identifying individual minerals within those groups, telling kaolinite apart from illite, for example, generally requires hyperspectral data with its hundreds of narrow, continuous bands.
How is the Cuprite, Nevada site used in mineral exploration research?
Cuprite, Nevada carries the same advanced argillic alteration assemblage found at many working mines, with minimal mining disturbance, making it an ideal natural laboratory. The USGS used AVIRIS hyperspectral data and the Tetracorder classification system to map its alteration zones in detail, and the resulting public dataset remains a standard benchmark for testing new satellite and hyperspectral mineral-mapping algorithms.
Sources and further reading
- USGS Geology, Geophysics, and Geochemistry Science Center, spectroscopic alteration mapping at Cuprite, Nevada, using AVIRIS imaging spectroscopy and the Tetracorder system (public domain)
- Swayze et al., 2014, Economic Geology, mapping advanced argillic alteration at Cuprite, Nevada using imaging spectroscopy
- Lowell and Guilbert, 1970, and Sillitoe, 2010, Economic Geology, porphyry copper alteration and mineralization zoning models
- Published 2024-2026 remote sensing studies applying ASTER, Landsat 8/9, and Sentinel-2 band ratios and Principal Component Analysis to hydrothermal alteration mapping
- USGS spectral library reference data on shortwave infrared and visible-to-near-infrared absorption features of clay, mica, and iron oxide minerals
- XRTech Group Khaza'in platform, alteration and structural mapping methodology, 2026
Ready to map alteration across your concession?
Get a classified alteration map, band-ratio and PCA outputs, and a ranked target list over your area of interest. No account needed to get a first estimate.