Can Satellite Imagery Prove a Field Was Damaged by Heat, or Is Resolution Too Coarse?
On this page
- The real question isn't resolution, it's what kind of heat damage happened
- Thermal resolution, the part that actually used to be coarse
- The crop-specific thresholds any claim gets checked against
- What a genuine proof package actually requires
- 01. Confirm the regional event crossed a known threshold
- 02. Confirm this specific field's canopy actually responded
- 03. Document the visible or biomass trajectory with before-and-after imagery
- 04. Compare against a baseline that rules out other causes
- The one kind of heat damage no satellite layer proves directly
- What we offer
- Frequently asked questions
- Sources and further reading
A practical guide to whether satellite imagery can prove a specific field was damaged by a heat event during the growing season, why thermal and optical resolution are two completely different stories, the crop-specific temperature thresholds any proof gets checked against, what a genuine evidence package actually requires, and the one kind of heat damage no satellite layer can see directly.
Quick answer
Partially, and it depends on what the heat event actually did to the plant. Pure thermal detection used to be the coarse part, Landsat's thermal band resolves to 100m and ECOSTRESS to 70m, fine enough for one large commercial field but not a small or irregular one. That gap is closing fast, new commercial thermal constellations from Hydrosat and SatVu now resolve to 25m and as fine as 3.5m. Resolution was never the real limit for visible damage, commercial optical and multispectral imagery has resolved individual fields down to 25cm for years. The honest limit is that no single satellite layer "proves" heat caused the damage on its own, a credible case combines weather-station data confirming the event crossed a known crop threshold, thermal or multispectral imagery showing this specific field responded, and a before-and-after comparison against the field's own history or a neighboring unaffected field.
The real question isn't resolution, it's what kind of heat damage happened
Heat damages a crop two different ways, and only one of them leaves a picture a satellite can actually see.
| Damage type | What happens to the plant | Can satellite imagery see it |
|---|---|---|
| Vegetative-stage heat and water stress | Leaf scorch, canopy wilting, necrosis, reduced biomass, elevated canopy temperature | Yes, directly. Optical, multispectral, and thermal imagery all pick up a visible or measurable response. |
| Reproductive-stage heat stress (flowering/pollination) | Pollen sterility, flower or tassel abortion, poor seed set, barren ears, often with no visible canopy change at the time | Not directly. The plant can look fully green right up to harvest; the only satellite-visible signal is a yield or end-of-season biomass shortfall, after the fact. |
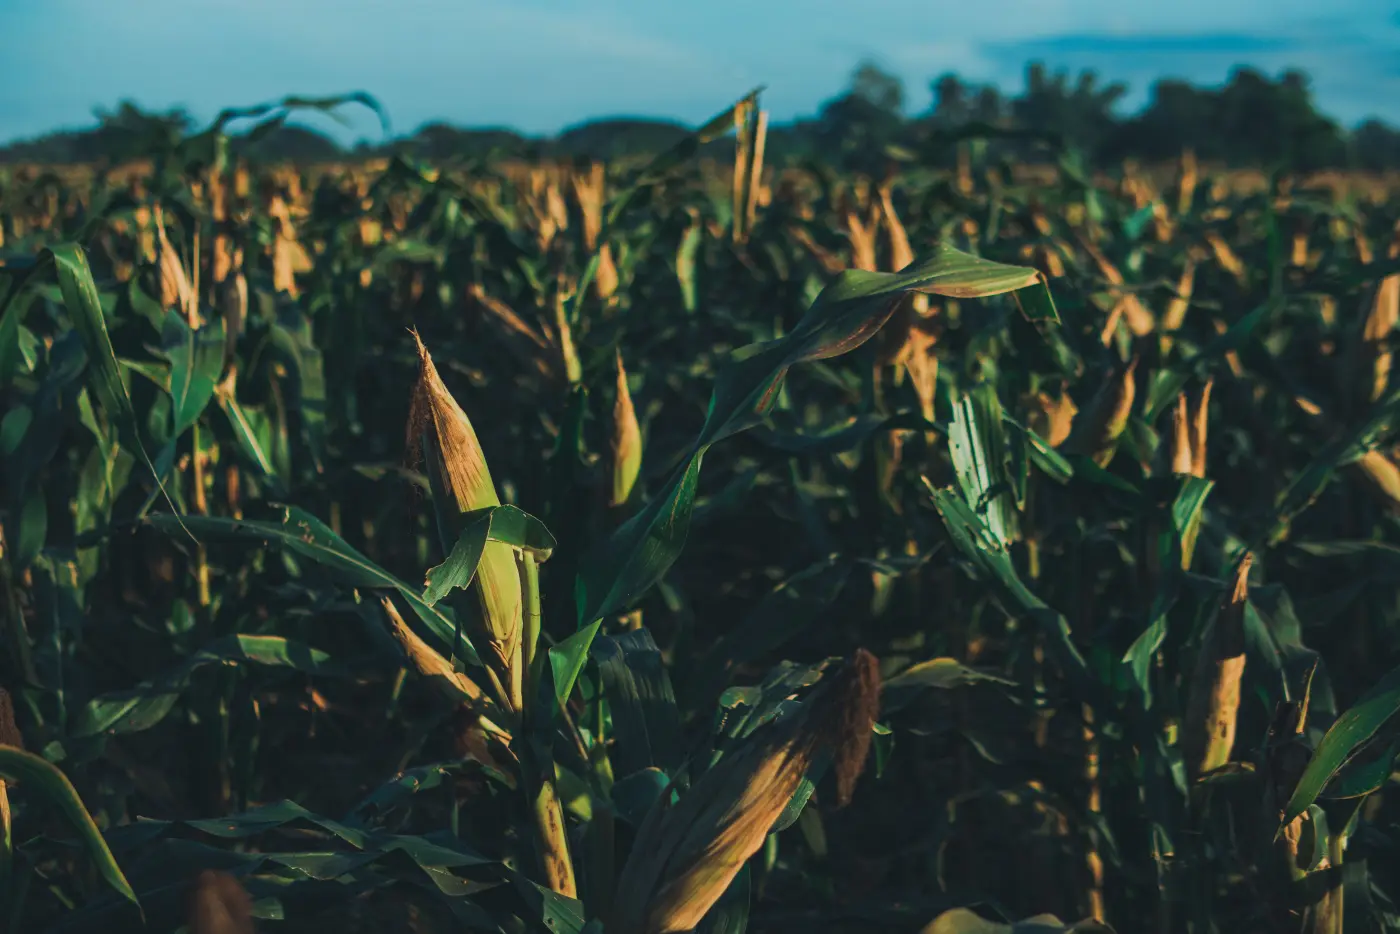
Corn is the clearest example. Research on heat-stressed maize shows pollen damage can cause 3 to 8% yield loss per day of stress during silking and pollen shed, through tassel blast, pollen abortion, and poor pollination, mechanisms that happen inside the flower, not on the leaf surface a satellite is actually imaging. A field can carry this exact damage and still show a perfectly normal NDVI map the week it happened.
Thermal resolution, the part that actually used to be coarse
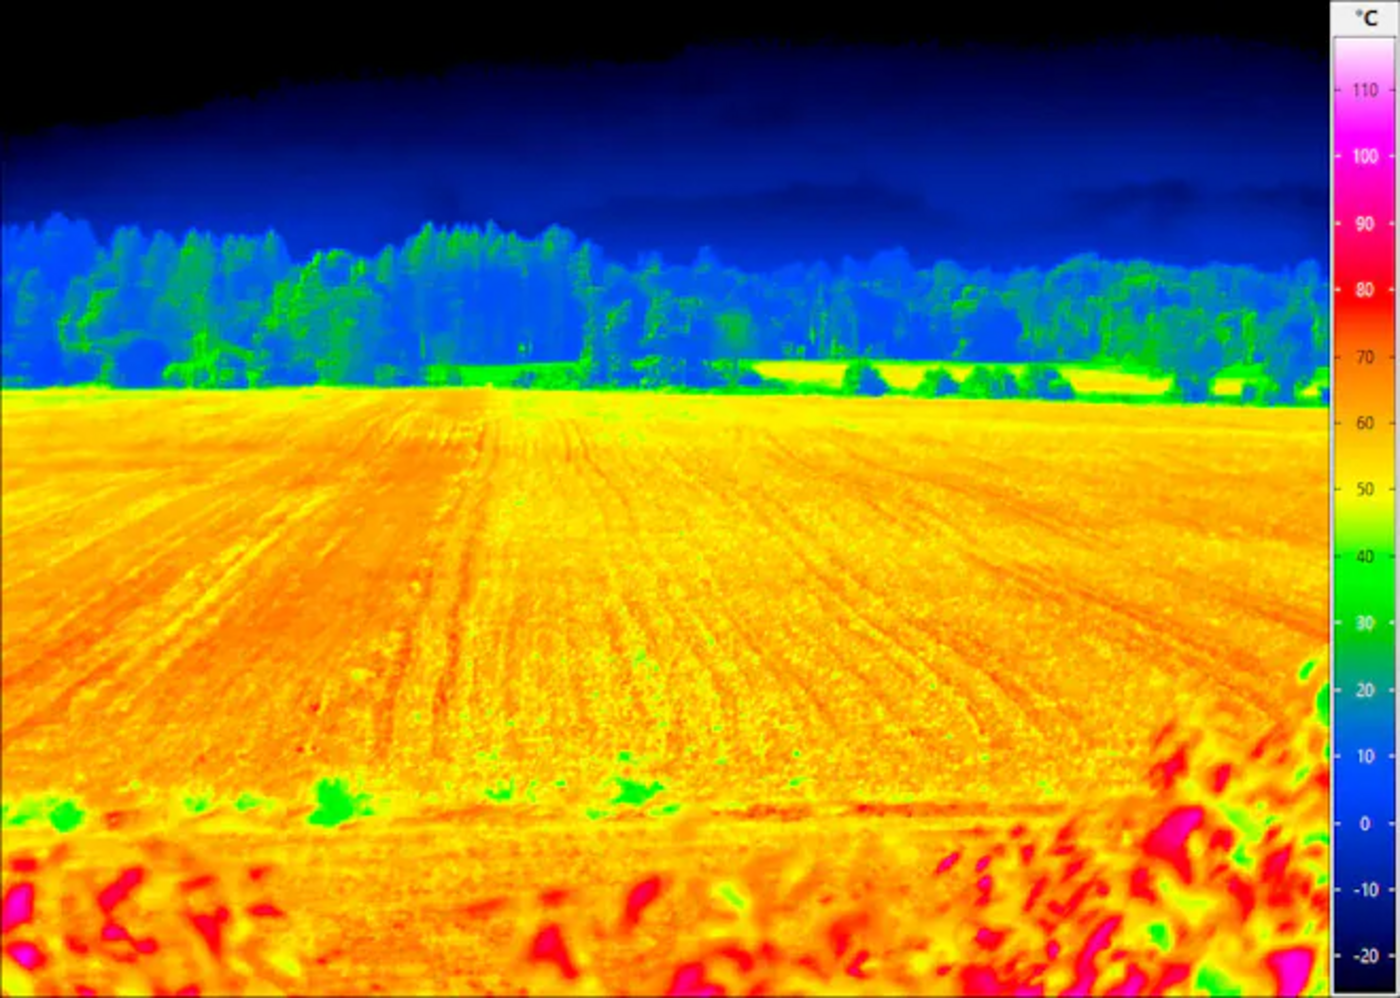
Measuring a field's actual canopy temperature, not just its color, needs a thermal infrared sensor, and thermal sensors have historically carried much larger pixels than optical ones for physical reasons, a thermal detector needs more energy per pixel to get a usable reading.
| Sensor | Resolution | Revisit | Field-level fit |
|---|---|---|---|
| Landsat 8/9 TIRS | 100 m native | 16 days | Resolves one large commercial field per pixel; too coarse for a small or irregular plot |
| ECOSTRESS (NASA, ISS-based) | 70 m | 1–5 days, ~4-day average | Purpose-built for plant water stress; same field-size limitation as Landsat |
| Hydrosat (current constellation) | 70 m thermal / 30 m VNIR | Daily, global | Commercial, operational today |
| GF-5B, VIMS payload | 40 m, 4 thermal-infrared channels | Matches the GF-5B revisit schedule | A separate instrument from GF-5B's 330-band hyperspectral AHSI sensor; a meaningful step down from Landsat/ECOSTRESS |
| Hydrosat Osiris (announced constellation) | 25 m thermal / 10 m VNIR | Up to 16 satellites by 2027, 12-hour global revisit | Resolves most individual fields directly |
| SatVu HotSat | Down to 3.5 m, finest commercial thermal available | Scaling toward 10–20 revisits/day as the constellation grows | Resolves individual fields and in some cases sub-field zones |
The practical takeaway, the "thermal is too coarse" problem is a 2024-and-earlier problem. A field large enough for commercial row-crop agriculture was already resolvable by Landsat or ECOSTRESS; a genuinely small or oddly shaped field now has a real shot with the new sub-30m commercial thermal constellations, and that gap keeps closing as more of these satellites reach orbit.
Optical and multispectral resolution was never the limiting factor. SuperView Neo-1 resolves to 30 cm panchromatic and 1.2 m multispectral, SuperView-2 to 40 cm panchromatic and 1.68 m multispectral with a Red Edge band included, and Beijing-3 (21AT) sits in the same tier, all sharp enough to isolate one specific field, down to individual rows, from its neighbors with no ambiguity at all. The bottleneck was always the thermal side, since no commercial VHR optical constellation has historically carried a usable thermal band at the same sharpness as its visible and NIR sensors.
The crop-specific thresholds any claim gets checked against
A satellite signal means nothing on its own without a known damage threshold for that crop and growth stage to compare it to.
| Crop | Damage threshold | Most sensitive stage |
|---|---|---|
| Corn (maize) | Indemnified heat stress begins around 30°C, intensifying sharply by 38°C; pollination-specific damage from roughly 35°C | Silking and pollen shed |
| Soybean | Heat-related losses begin increasing from around 33°C | Flowering and pod set |
| Wheat | Yield-reducing heat starts from roughly 20°C and above for winter wheat during its sensitive window | Flowering and grain fill |
Duration compounds the effect on top of the peak temperature. One published analysis found 12 or more days at least two standard deviations above the long-term monthly average cut yields by as much as 36%, which is why a single hot afternoon and a sustained two-week heatwave are not treated as the same event in a proof package, even if both cross the same peak-temperature threshold.
What a genuine proof package actually requires
01. Confirm the regional event crossed a known threshold
Weather-station or reanalysis temperature data establishes that a real heat event occurred, and that it crossed the specific crop's damage threshold during its most sensitive growth stage, not just at some point in the season.
02. Confirm this specific field's canopy actually responded
Thermal imagery, where available at adequate resolution, shows whether this field's canopy temperature was genuinely elevated during the event, ruling out the possibility that a well-irrigated or sheltered field was spared while the surrounding region baked.
03. Document the visible or biomass trajectory with before-and-after imagery
Multi-temporal optical and multispectral imagery, before the event, during, and through to harvest, shows whether NDVI, canopy color, or end-of-season biomass diverged from normal in a way that lines up with the event's timing, not a single snapshot that can't show change at all.
04. Compare against a baseline that rules out other causes
The field's own multi-year history, or a neighboring field growing the same crop at the same stage, is the control. If only fields inside the documented heat footprint show the decline and comparable fields outside it don't, that's what actually isolates heat as the cause rather than drought, disease, or a local pest outbreak.
This is the same logic parametric insurers use to manage basis risk, the gap between what a regional weather or satellite index says happened and what actually happened on one specific insured field. The European Space Agency has reported that combining satellite monitoring with ground weather data can improve detection of extreme weather crop impacts by up to 50% compared to relying on ground data alone, precisely because it closes that single-field gap a regional index can't.
Building a heat-damage claim or risk file on a specific field?
Get multi-temporal optical and thermal imagery over your exact field, with a documented before-and-after comparison, not just a regional snapshot.
The one kind of heat damage no satellite layer proves directly
Reproductive-stage damage is the honest limit, and it's worth stating plainly rather than overselling what the data can do.
- Pollen sterility and flower abortion happen inside the plant, invisible to any sensor looking at the canopy from above, whether optical or thermal.
- The crop can look completely healthy through the rest of the season, with a normal-looking NDVI curve, right up until a visibly light or empty harvest.
- What satellite data can still do is tie the timing together, confirm the field was at its documented flowering or pollination stage exactly when the weather data shows the threshold was crossed, which is strong circumstantial evidence even with zero visible canopy symptoms.
- The downstream signal still shows up eventually, a lower end-of-season biomass or yield-model estimate than the field's own history would predict, consistent with the documented event, even though the event itself left no visible mark at the time.
In practice, this is the difference between "satellite imagery shows this field was damaged" and "satellite and weather data together are consistent with this field being damaged, at a stage where the damage mechanism itself isn't directly observable." The second framing is the honest one, and it's still a genuinely useful evidence package, just not an unqualified single-image proof.
What we offer
- Multi-temporal archive search over your exact field. Pull before, during, and after imagery for the documented event window, not a single scene.
- Commercial optical down to 25 cm. Resolves one field from its neighbors with no ambiguity, for the visible-damage cases.
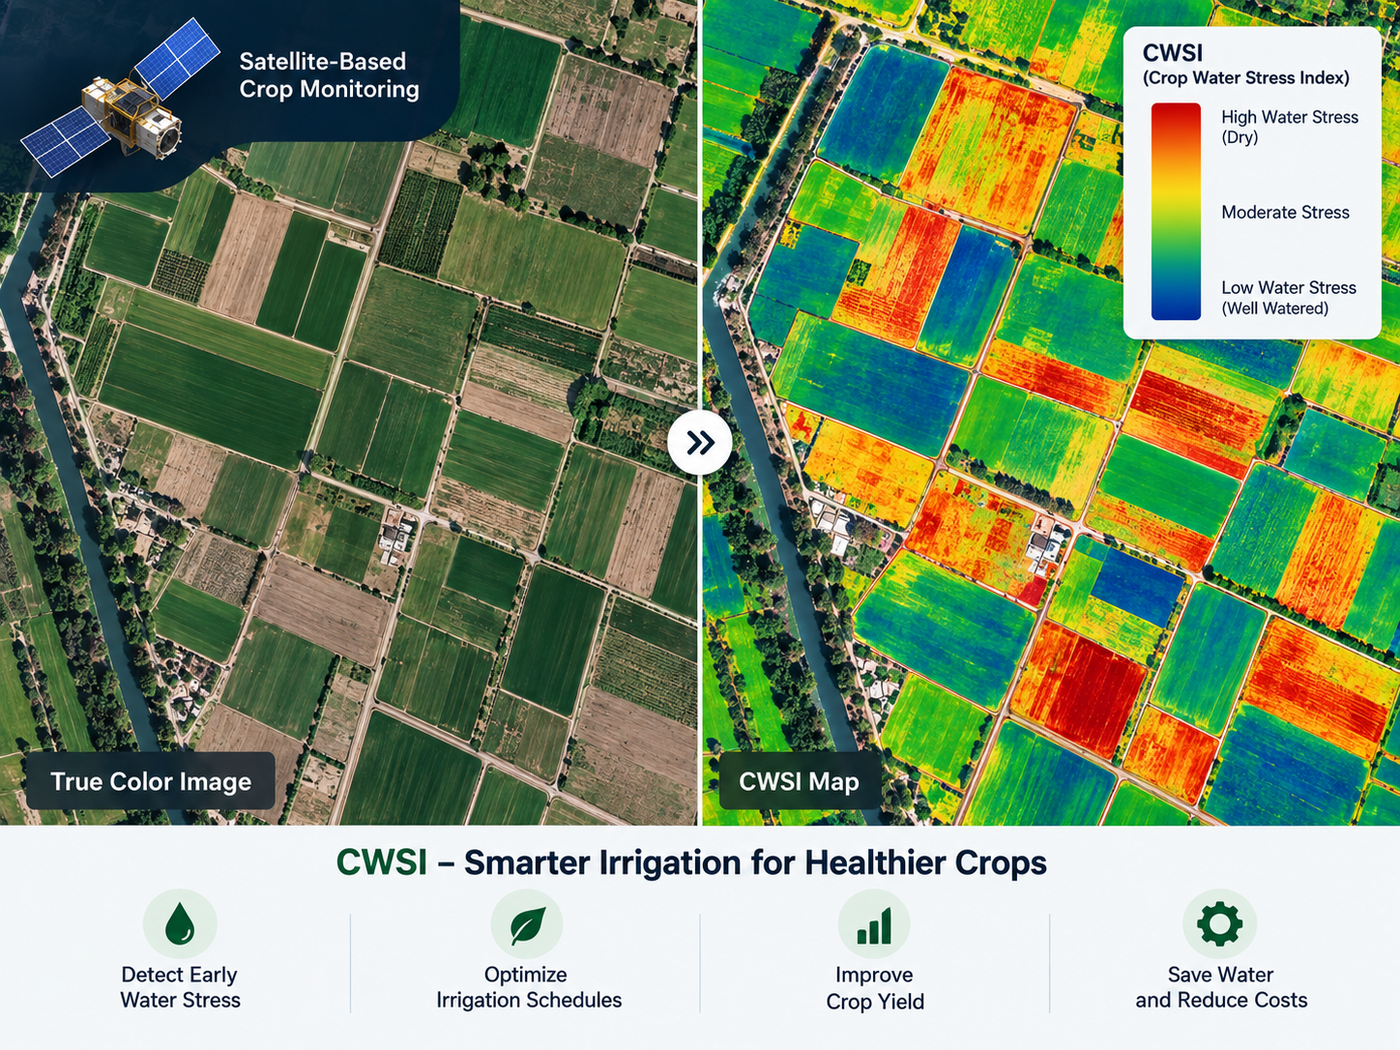
- Access to thermal and multispectral data layers for canopy temperature and water-stress indices like CWSI, where the question is heat specifically rather than general vegetation decline.
- New tasking when the archive has a gap. If no suitable scene exists for the exact dates that matter, we can task a fresh capture.
- Instant, transparent pricing on every archive search or tasking request, so building an evidence file doesn't become its own slow procurement process.
- A human confirms coverage and cloud conditions for your exact field and dates before anything is charged.
Key takeaways
- Whether satellite imagery can prove heat damage depends on the damage type. Vegetative-stage damage, scorch, wilting, biomass loss, is directly visible. Reproductive-stage damage, pollen sterility and flower abortion, usually isn't, the crop can look healthy right up to harvest.
- Thermal resolution used to be the real limit, Landsat at 100m and ECOSTRESS at 70m resolve one large field but not a small one. New commercial constellations from Hydrosat (25m) and SatVu (down to 3.5m) are closing that gap fast.
- Optical and multispectral resolution was never the bottleneck, commercial imagery has resolved individual fields down to 25cm for years.
- Corn, soybean, and wheat each have documented heat-damage temperature thresholds, and duration matters as much as peak temperature, 12-plus days of sustained heat can cut yield by up to 36%.
- No single satellite layer proves causation alone. A credible proof package combines weather data confirming the regional threshold was crossed, thermal or multispectral imagery confirming this field's response, and a before-and-after or neighboring-field comparison that rules out other causes.
- For reproductive-stage heat damage specifically, satellite data can confirm timing and the eventual yield shortfall, but not the invisible mechanism itself, an honest limit worth stating rather than overselling.
Frequently asked questions
Can satellite imagery actually prove that a specific field was damaged by a heat event during the growing season or is the resolution too coarse?
Partially. Optical and multispectral resolution has resolved individual fields down to 25cm for years, not coarse at all. Thermal resolution used to be the real limit, Landsat at 100m and ECOSTRESS at 70m, but new commercial thermal constellations now reach 25m and as fine as 3.5m. The bigger honest limit isn't resolution, it's that no single satellite layer proves causation alone, a credible case combines weather data, imagery of the specific field, and a before-and-after or neighboring-field comparison.
What resolution satellite imagery is needed to detect heat damage on one field?
For visible damage like scorch or biomass loss, commercial optical imagery at 25cm to a few meters easily isolates one field. For direct canopy-temperature measurement, thermal sensors need finer resolution than they used to have, Landsat and ECOSTRESS resolve to 70 to 100m, while newer commercial constellations like Hydrosat and SatVu now reach 25m and down to 3.5m.
Can satellites detect heat stress that doesn't show visible crop damage?
Not directly, if the damage is reproductive-stage, such as pollen sterility or flower abortion in corn during silking. These mechanisms happen inside the plant with no visible canopy change at the time, and can cause 3 to 8% yield loss per day of stress despite a normal-looking NDVI map. The eventual yield or biomass shortfall is the only satellite-visible signal, and it shows up after the fact.
What temperature causes heat damage in corn, soybean, and wheat?
Corn heat stress indemnities typically begin around 30°C and intensify sharply by 38°C, with pollination-specific damage from roughly 35°C. Soybean losses increase from around 33°C. Winter wheat can see yield-reducing heat from roughly 20°C and above during its sensitive flowering and grain-fill window. Duration matters as much as the peak, 12 or more days of sustained heat above normal can cut yield by up to 36%.
What evidence does a credible heat-damage claim need beyond satellite imagery?
Weather-station or reanalysis data confirming the regional event crossed the crop's known damage threshold during its most sensitive growth stage, satellite imagery showing the specific field's actual response, and a comparison against the field's own history or a neighboring unaffected field to rule out other causes like drought, disease, or pests.
What is the difference between thermal and optical satellite resolution for crop monitoring?
Optical and multispectral sensors measure reflected light and have reached 25 to 50cm resolution commercially for years. Thermal sensors measure emitted heat directly and have historically needed much larger pixels to collect a usable signal, 70 to 100m on Landsat and ECOSTRESS, though new commercial constellations are closing that gap to 25m and finer.
Does combining weather data with satellite imagery improve heat-damage detection?
Yes. The European Space Agency has reported that combining satellite monitoring with ground weather data can improve detection of extreme weather crop impacts by up to 50% compared to ground data alone, since it closes the gap between a regional event and what actually happened on one specific field, the same basis-risk problem parametric crop insurers manage.
Sources and further reading
- USGS Landsat 8/9 TIRS thermal band specifications, 100m native resolution
- NASA JPL, ECOSTRESS mission specifications, 70m resolution, ISS-based platform
- Hydrosat and SatVu (Satellite Vu) commercial thermal constellation specifications, 2026
- SuperView Neo-1, SuperView-2, and Gaofen-5B (GF-5B) VIMS payload sensor specifications
- Peer-reviewed research on maize pollen sterility and reproductive-stage heat stress, tassel blast, pollen abortion, and daily yield-loss rates during silking
- Crop insurance and agricultural economics research on corn, soybean, and wheat heat-damage temperature thresholds
- Research on sustained above-normal temperature duration and yield loss
- European Space Agency reporting on combined satellite and ground-data detection of extreme weather crop impacts
- Research on basis risk in parametric and index-based crop insurance
For how satellite data separates heat and drought stress from pests, disease, and nutrient issues more broadly, see our guide to diagnosing crop stress in satellite imagery, and for how this evidence feeds an actual insurance claim, see satellite imagery as insurance claims evidence.
Need to document heat damage on a specific field?
Get multi-temporal optical and thermal imagery over your exact area of interest, with an instant price estimate before you order.