
Satellite gold maps use free NASA and USGS data, plus commercial hyperspectral imagery, to map the alteration minerals that surround gold deposits, not gold itself. This page covers what's real, what free data sources exist, and how to get a professional prospecting map built for your ground.
Talk to Our Exploration Team
Tell us your area of interest and target mineral. Our geospatial team will reply by email with what's realistic for your ground.
We reply by email, usually within one business day.
What Is a Satellite Gold Map?
A satellite gold map is a color-coded image built from satellite spectral and structural data that flags ground with the mineral chemistry and geology consistent with gold deposits. It is a targeting layer that narrows a search area for further ground work, not a device or app that finds buried gold directly.
Gold has no distinct spectral signature a satellite sensor can read, and it essentially never sits exposed at the surface in a form any sensor could pick up even if it did. Be skeptical of any "gold mine detector online" or "free gold map" that claims to pinpoint gold from a photo or a generic web tool.
What a real satellite gold map shows instead:
Cross-check any specific claim against a public record like the USGS Mineral Resources Data System (MRDS) before spending money or digging, and treat any map as a starting filter, not a final answer.
Interactive Map
A live map built on free, public-domain NASA satellite data, not a gold detector.
Live NASA VIIRS true-color satellite imagery (public-domain US government data via NASA EOSDIS GIBS) with markers for major, publicly documented gold districts. Pan and zoom to explore real imagery, this shows where gold is actually mined, not a live detector. Cloud cover and orbital gaps are real, unedited satellite conditions for the day shown.
Spectroscopy
The mechanism behind every alteration map, explained in plain terms.
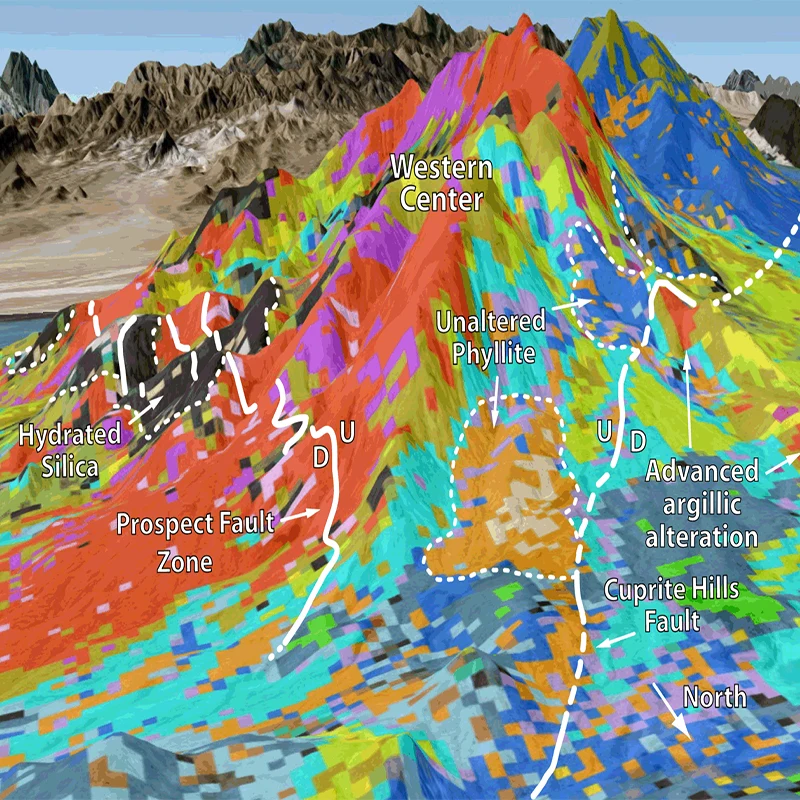
Every mineral absorbs and reflects sunlight in a distinctive pattern across visible, near-infrared, and shortwave-infrared wavelengths, its spectral signature. A satellite sensor records reflected light across many narrow wavelength bands, either a handful (multispectral) or hundreds (hyperspectral), and that recorded curve is compared against a reference spectral library to identify which minerals sit at the surface. Gold itself, being a metal, has a flat, largely featureless reflectance curve, which is exactly why this method targets its alteration halo instead.
Chemistry
The indicator minerals a satellite alteration map is actually built on.
| Indicator Mineral | Alteration Type | What It Signals |
|---|---|---|
| Hematite, goethite, jarosite (iron oxides) | Gossan / oxidation cap | Marks the weathered top of a sulfide system, a classic starting point for gold exploration |
| Sericite, kaolinite, illite (clays & micas) | Argillic / phyllic alteration | A common halo around epithermal and orogenic gold systems |
| Chlorite, epidote | Propylitic alteration | The outer halo of a hydrothermal system, useful for defining the edge of a target area |
Sensor Types
Multispectral data screens a wide area for free, hyperspectral confirms what's actually there.
| Imaging Type | Bands | Best For |
|---|---|---|
| Multispectral (Landsat, Sentinel-2) | 4–13 broad bands | Free, wide-area regional screening using iron-oxide and clay band ratios |
| Hyperspectral (ASTER, GF-5, ZY-1 02D) | Dozens to hundreds of narrow, continuous bands | Finer discrimination between specific clay, mica and oxide species once a target area is narrowed down |
Real hyperspectral constellations used for this kind of mapping include GF-5 and GF-5B's AHSI sensor (330 continuous spectral channels) and ZY-1 02D (166 channels), alongside Wyvern's 31-band VNIR (5.3m resolution) for finer material identification. Very high-resolution optical satellites such as SuperView Neo-1 (0.25–0.3m) and SuperView-2 (0.42m, 9-band including Red Edge and Yellow) support close-up site scouting once a target is narrowed, and stereo satellites like GF-7 (≤0.65m) generate the 3D elevation models used to plan drill access routes. For the full sensor-by-sensor breakdown and diagnostic wavelengths, see our guide to hyperspectral imaging in mineral exploration and key mineral alteration signatures.
Free Data
NASA, USGS, and ESA all publish data usable for a self-built gold prospecting map, no license required.
Every layer behind a professional gold prospectivity map has a free public equivalent. None of them will hand you a finished target map on their own, each needs GIS software and geological interpretation to turn raw bands into an alteration or structural layer, but together they cover the same ground a paid service starts from.
| Free Data Source | Provider | What It Shows | Resolution & Access |
|---|---|---|---|
| ASTER (Terra satellite) | NASA / METI (Japan) | VNIR, SWIR and thermal bands built to map iron-oxide and clay alteration, the standard free dataset for gold-target screening | 15–90m, free via USGS EarthExplorer |
| Landsat 8 / 9 (OLI) | NASA / USGS | Band-ratio composites (bands 2, 4, 6, 7) highlight iron-oxide and ferrous-mineral alteration across wide regions | 30m, free via USGS EarthExplorer, archive back to 1982 |
| Sentinel-2 (MSI) | ESA Copernicus | 13 bands including SWIR support alteration-mineral ratios with a revisit of about 5 days | 10–20m, free via Copernicus Browser |
| SRTM / Copernicus DEM | NASA / USGS / ESA | Elevation data for mapping the faults, shear zones and lineaments that control where gold-bearing fluids concentrated | 30m, free download |
| USGS Mineral Resources Data System (MRDS) | USGS | A searchable, free database of known gold and other mineral deposit and prospect locations worldwide | Free point-location database |
| USGS National Geochemical Database | USGS | Soil and stream-sediment sample results, a ground-truth companion to any satellite-derived alteration map | Free |
Gold Production
USGS Mineral Commodity Summaries data, 2025 mine production estimates.
Combined, these three countries produced roughly 970 tonnes of the world's estimated 3,300-tonne 2025 total. By reserves rather than annual output, Russia and Australia are tied as the largest holders of unmined gold, each with an estimated 12,000 tonnes (USGS, January 2025 estimate).
Examples
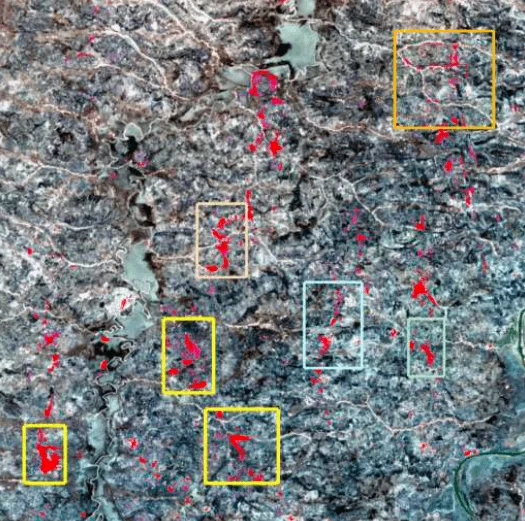
Published and satellite-derived examples of what this technique actually produces.
Method
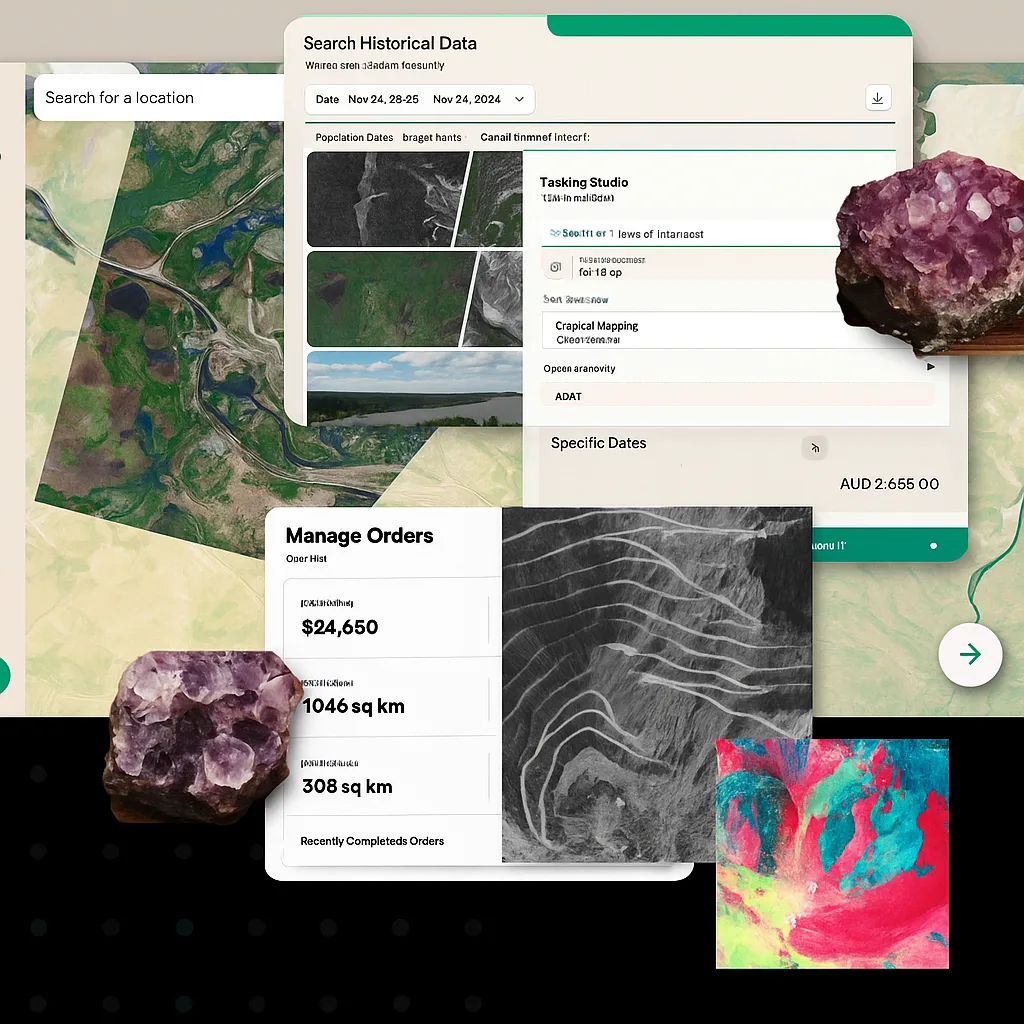
The five-step process behind a satellite-derived gold prospectivity map.
Field Examples
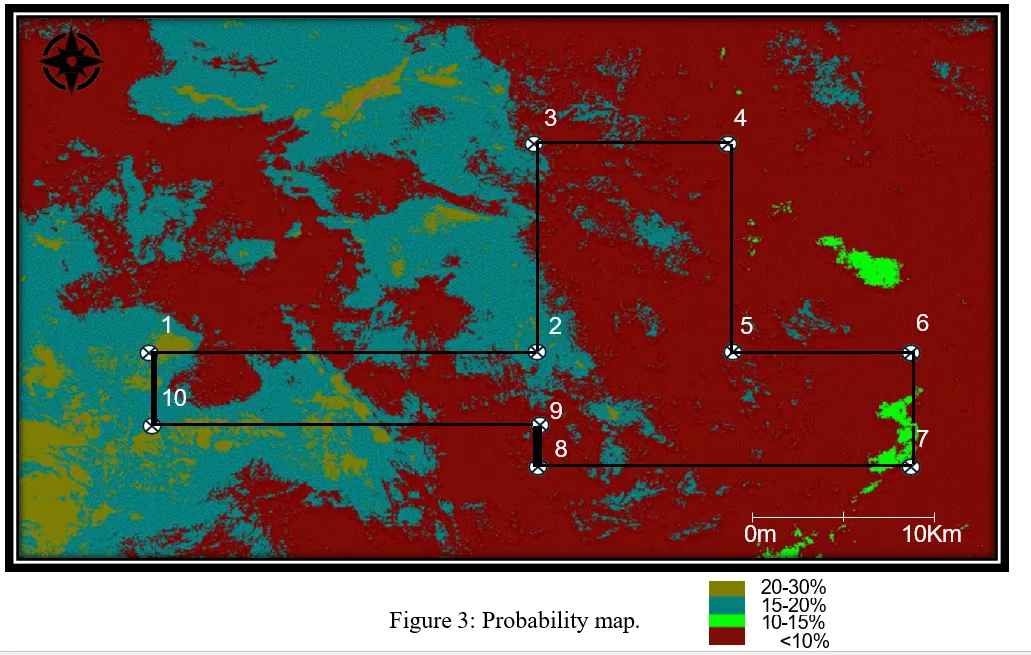
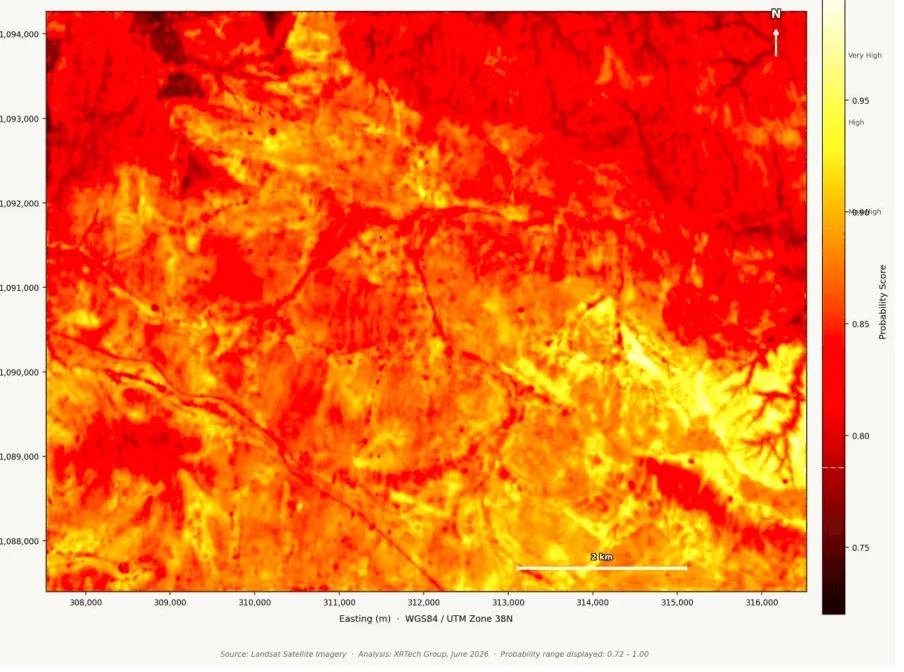
Across the Reguibat Shield in Mauritania, deep-learning-based satellite targeting flagged 10 high-confidence gold exploration targets, with the top-ranked probabilities at 21.69% and 20.16%, shown at right. Around the Lake Victoria Gold Belt in Tanzania, the same approach produced verified target maps in under 20 days, identifying viable zones adjacent to existing artisanal workings. See the full write-ups on our mining applications page and in how satellites detect minerals.
Accuracy
Published, peer-reviewed figures, not marketing claims.
Published prospectivity studies consistently score in the range statisticians consider excellent discrimination. A Random Forest model over the Tongling ore district in China reached 93.65% sensitivity with an AUC of 0.9892. Studies over the Qulong-Jiama district in Tibet and the Dharwar Craton gold belt in India reached AUC scores between 0.97 and 0.999 against known deposits. In one real 6,183-hectare exploration block, this kind of model flagged just 2.26% of the area as moderate probability or higher, concentrating an entire drilling budget onto a sliver of the concession instead of spreading it across the whole block.
The important caveat: these figures measure a model's ability to recover deposits that are already known, not a guarantee about undiscovered ground. A high-confidence zone still needs drill confirmation before it counts as a discovery, exactly the "check the claims before you dig" point made above. Full methodology and sources in our guide to how satellites detect minerals.
By Region
Real districts and free government sources for the two most-searched regions.

Australia is the world's third-largest gold producer, roughly 280 tonnes in 2025, and hosts some of the industry's best-known districts, Kalgoorlie's Super Pit and Boddington in Western Australia, Telfer in the Pilbara, Cadia in New South Wales, and Fosterville in Victoria's historic goldfields.
For free, government-sourced gold map data specific to Australia, start with Geoscience Australia's Operating Mines Map (part of the Digital Atlas of Australia, a free interactive map of every operating, developing, and care-and-maintenance mine nationwide), and the Geological Survey of Western Australia's MINEDEX database (free, no registration, covers mines and mineral deposits across WA) alongside WAMEX for public mineral exploration reports.
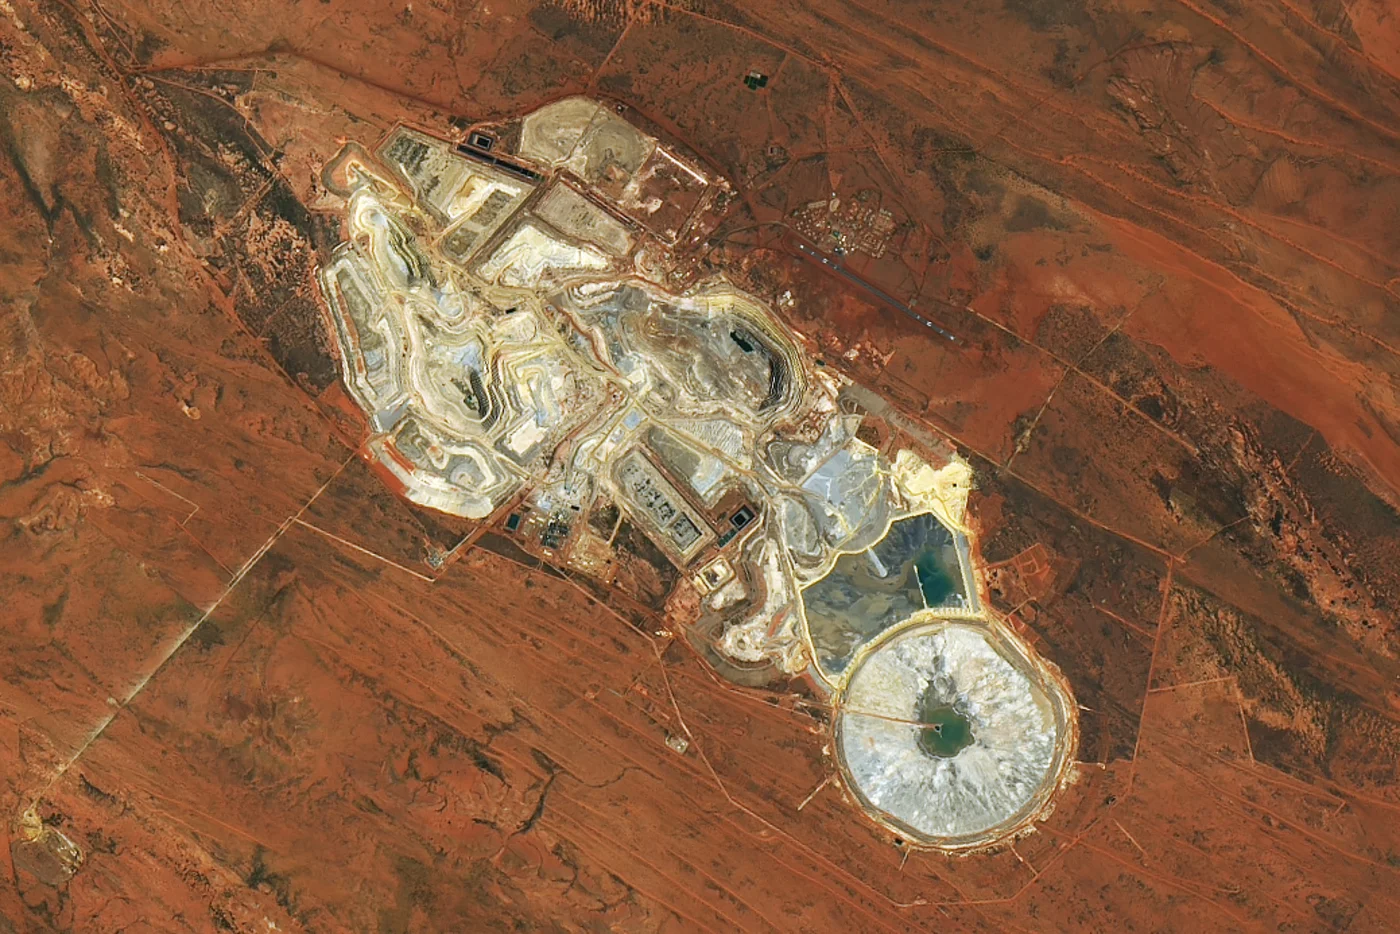
The Telfer gold-copper mine in Western Australia, photographed from orbit, real open pits and tailings infrastructure, not a rendered map. This is the kind of high-resolution optical imagery used to scout a site once a broader alteration or structural target has already been narrowed down.
US gold production centers on Nevada, home to the Carlin Trend and the Cortez district, with Alaska's Fort Knox mine and California's historic Mother Lode belt as other major producing regions. For free US-specific data, the USGS Mineral Resources Data System has a dedicated map view for the continental United States, the USGS Alaska Resource Data File (ARDF) is a free, state-specific database of Alaska's mines and prospects, and the Nevada Bureau of Mines and Geology's Open Data portal publishes free, downloadable GIS layers, including active mines, for the country's top gold-producing state.
| Free Government Source | Region | What It Shows |
|---|---|---|
| Geoscience Australia — Operating Mines Map (Digital Atlas of Australia) | Australia, nationwide | A free interactive map of operating, developing, and care-and-maintenance mines across the country |
| GSWA MINEDEX | Western Australia | The WA Geological Survey's free database of mines and mineral deposits, no registration required |
| WAMEX | Western Australia | Free public access to mineral exploration reports once their confidentiality period expires |
| USGS Mineral Resources Data System (MRDS) — US map | USA, nationwide | The same free MRDS database above, filtered to a dedicated map view of the continental United States |
| USGS Alaska Resource Data File (ARDF) | USA, Alaska | A free, state-specific database of mines, prospects, and mineral occurrences across Alaska |
| Nevada Bureau of Mines and Geology — Open Data | USA, Nevada | Free downloadable GIS datasets, including active mines, for the top US gold-producing state |
Pricing
Volume-based pricing for AI-driven satellite mineral exploration.
| Area of Interest | Price |
|---|---|
| Under 100 km² | $20 / km² |
| 100–500 km² | $17 / km² |
| 500–2,000 km² | $15 / km² |
| Over 2,000 km² | $12 / km² |
Every tier includes a color-coded anomaly map, prioritized GPS target coordinates, confidence layers, downloadable GIS shapefiles, and an optional geological interpretation report. Smaller areas, under 100 km², typically deliver in 2 to 3 days. Request a consultation for a quote specific to your area.
From the Blog
For the complete workflow, sensor specs, and full case studies behind these maps.
How satellites detect minerals from orbit, real accuracy figures, gold and copper case studies from Mauritania, Tanzania, Chile, and the DRC, and pricing.
2026-09-22
How hyperspectral satellites map gold, copper, and iron ore signatures invisible to the eye, with satellite specs, a step-by-step workflow, real case studies, costs, and an FAQ.
2026-09-09
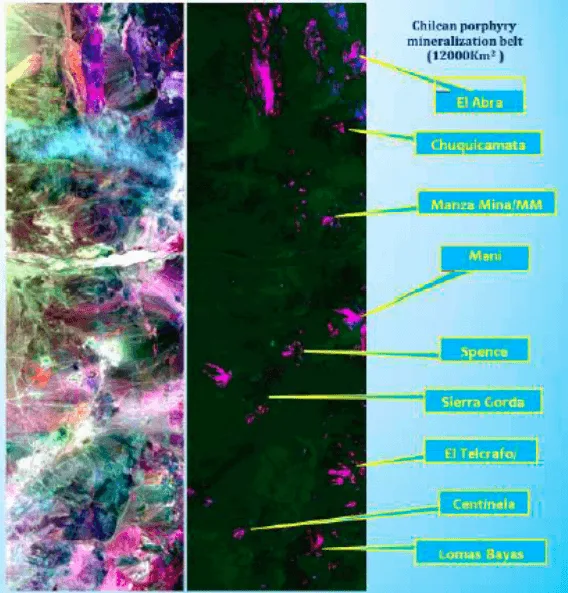
The key mineral alteration signatures satellites detect, diagnostic SWIR wavelengths, band ratios, porphyry zonation, and a real Cuprite, Nevada case study.
2026-09-22
Ready for a Real Gold Prospecting Map?
Tell us your area of interest and target mineral, we'll reply with what's realistic and what it costs.
