
Satellite-Driven Crop Yield Prediction Service
Predict crop yields with satellite imagery and machine learning, accurate to 85% at the county level. Combine historical trends and real-time crop data to plan harvests, manage risk and optimize your supply chain.
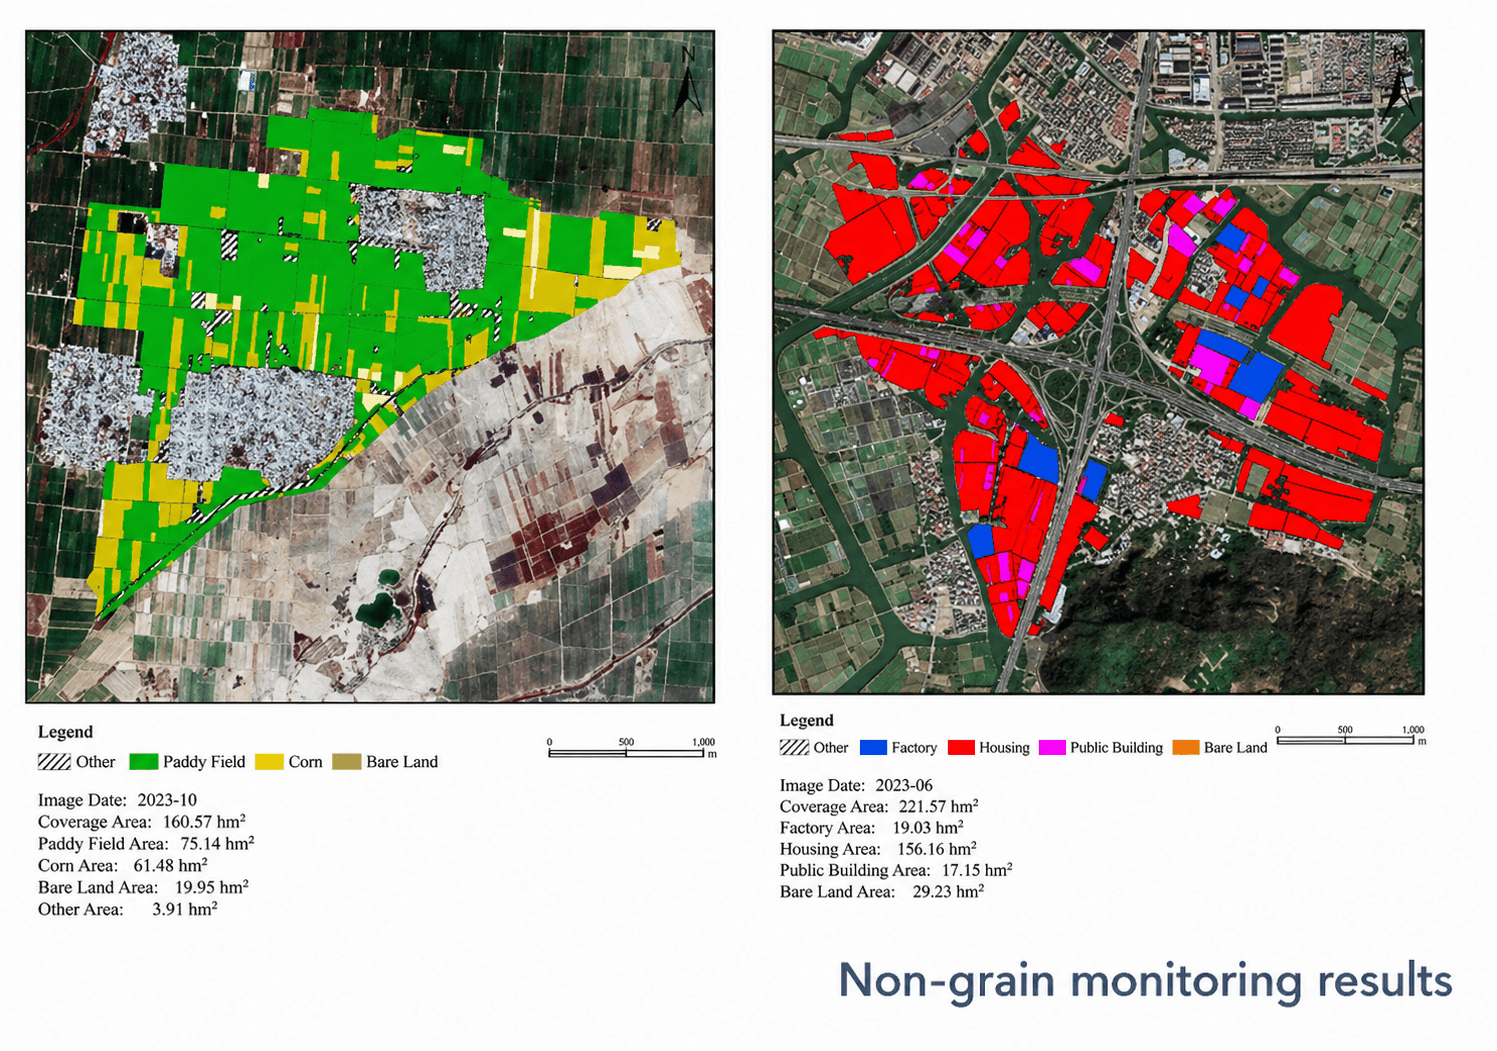
Yield Prediction Methodology
We use two primary analytical pathways to ensure high-accuracy results, up to 85% at the county level.
Machine Learning (Historical-Based)
Trained on historical yield statistics for your area of interest from open sources. Predicts current-season yields by matching historical trends against present conditions.
Biophysical Prediction (Phenological-Based)
Relies on physical crop parameters like variety, growth stage and water demand. Predicts yield for a specific date without historical data, and can be repeated throughout the season to track changing conditions.
Prediction Levels & Data Inputs
Yield results are delivered at two distinct granularities to match your project goals.
Field Level
Detailed results per field, for precise production estimation.
Regional Level
Aggregated results per administrative unit, such as province, state, district or region.
Core Data Inputs
Satellite Imagery
Multi-temporal high-resolution imagery from a constellation of 130+ satellites.
Phenology Data
Information on crop growth stages and water demand.
Weather Data
Integrated real-time monitoring and early warning systems.
Soil Maps
Insights into soil health, fertility and moisture levels.
Open-Source Yield Statistics
Baseline data used to train AI models for your specific region.
Sensors & Bands for Yield Prediction
Effective yield prediction requires data beyond the visible spectrum, to assess plant vigor and stress.
Key Satellites for Yield
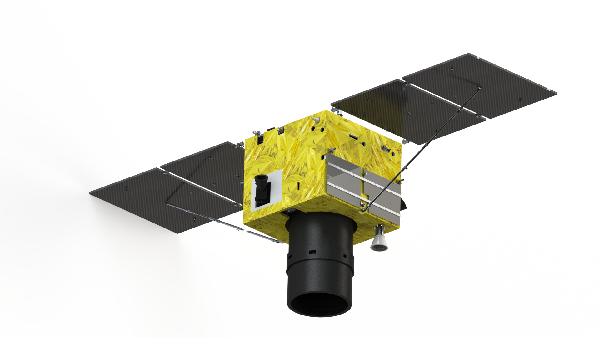 0.4m Resolution
SuperView-2 (GFDM)
A 1+8 band configuration, including the critical Red Edge and Yellow bands for crop stress detection.
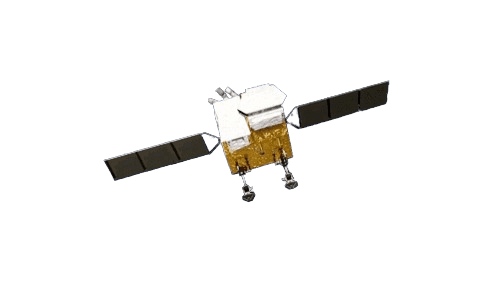 2.0m Resolution
GF-6
Optimized for precision agriculture, with a Red Edge band for regional monitoring.
 Varies
CBERS-04
Features an infrared multispectral scanner, ideal for water resource surveys and yield estimation.
Critical Spectral Bands
Red Edge (690–770nm)
Highly sensitive to chlorophyll and leaf structure, essential for detecting nutrient stress before it is visible.
Near-Infrared (NIR)
Used to calculate NDVI, measuring general plant health and biomass.
SAR (Radar)
Enables constant monitoring through clouds, smoke and darkness, vital for data continuity in rainy regions.
Key Benefits
Strategic Planning
Use field performance data to build variable rate seeding plans and optimize fertilizer usage.
Risk Mitigation
Early detection of drought stress, pests and diseases, with over 90% accuracy, allows for timely intervention.
Supply Chain Optimization
Accurate harvest forecasts assist in logistics and market planning.
Sustainability
Precise soil moisture monitoring prevents overwatering and ensures efficient irrigation.
Resolution Tier Pricing (USD per km²)
Pricing is determined by the required spatial resolution, and whether archived or new tasking data is used.
| Resolution Tier | Archive (90+ days) | New Tasking (Fresh) | Minimum Order |
|---|---|---|---|
| Super High (30cm) | $20/km² | $30/km² | 25km² (Archive) / 100km² (New) |
| Very High (50cm) | $13/km² | $20/km² | 25km² (Archive) / 100km² (New) |
| High (<1m) | $5/km² | $8/km² | – |
| Wide Area (2m) | $1/km² | $2/km² | – |
Get Accurate Crop Yield Predictions From Satellite Data
Combine machine learning and biophysical modeling to forecast yields, manage risk and plan your season with confidence.