
Crop Classification Using Satellite Imagery & AI Analytics
Classify crop types and monitor field health with AI powered satellite imagery, accurate to over 90%. Track growth, detect stress early and forecast yields across your entire farming region.
Satellite AI-Powered Crop Classification
Our core service uses semantic segmentation and AI-driven growth management to identify and classify crop types automatically, across your entire farming region.
High Accuracy
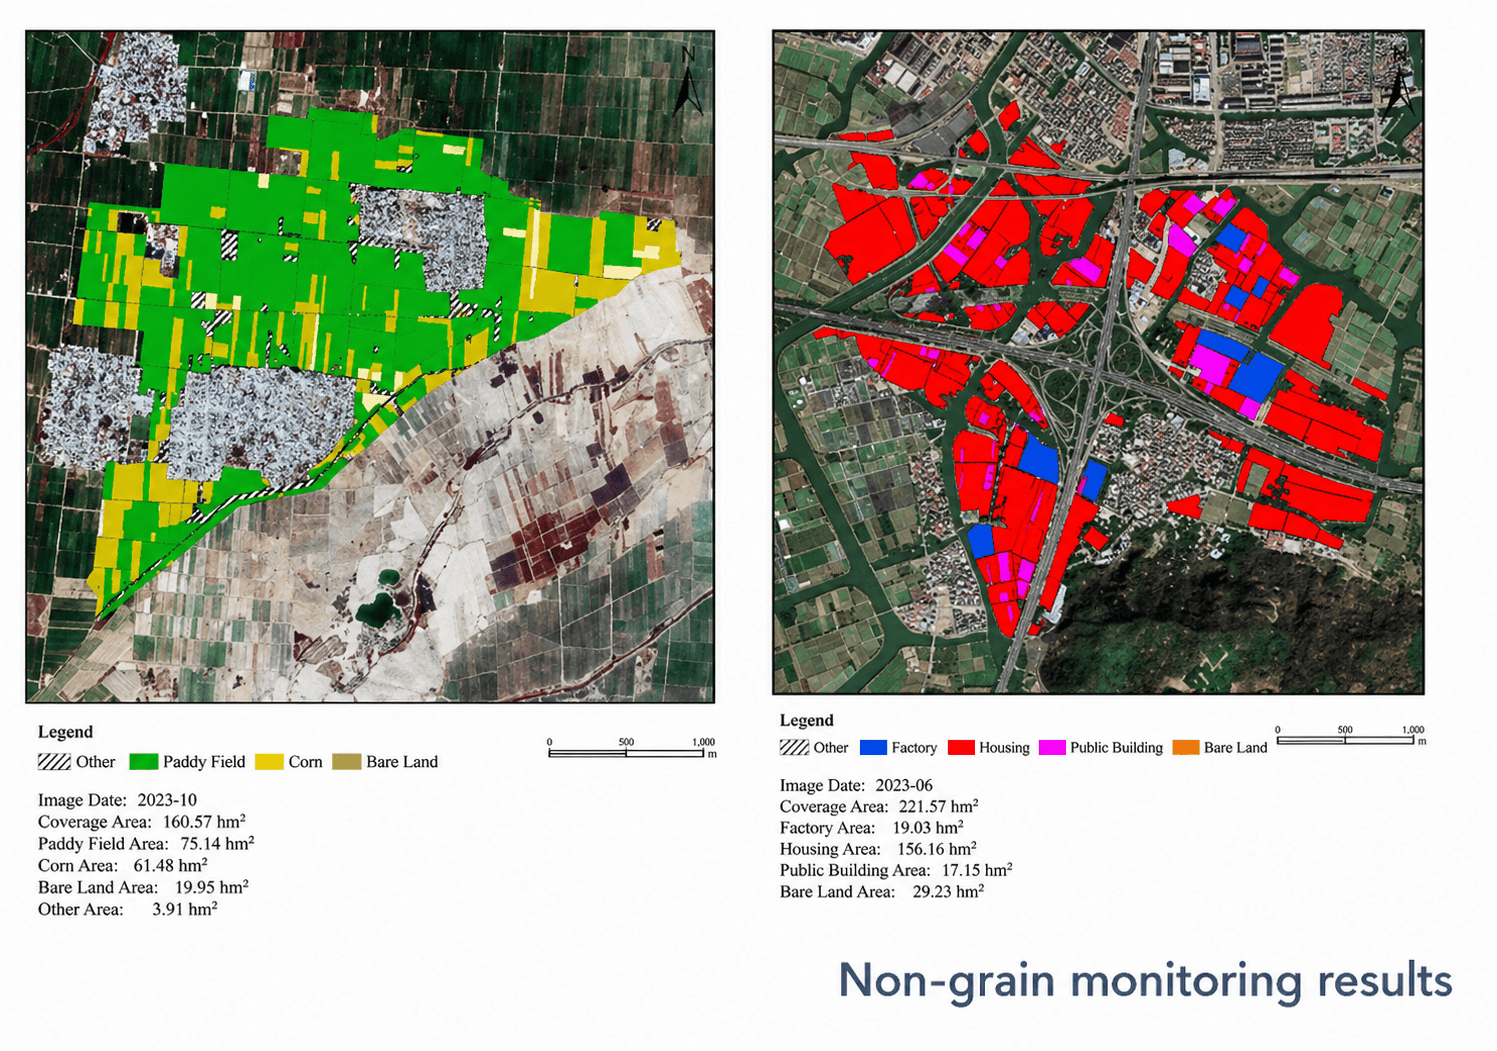
Classify crop types and detect non-grain land changes with deep learning models accurate to over 90%.
Automatic Extraction
AI extracts crop boundaries and land-use categories automatically, keeping agricultural base maps updated without manual mapping.
Full Farming Cycle
Get intelligence across the entire farming cycle, from tilling and planting to managing and harvesting.
Short-Term Benefits
Disease & Pest Detection
Catch early signs of crop issues daily, with detection models reaching over 90% accuracy, to prevent serious losses.
Precision Planning
Build accurate variable rate seeding plans from field performance data, saving money on seeds and fertilizer.
Real-Time Monitoring
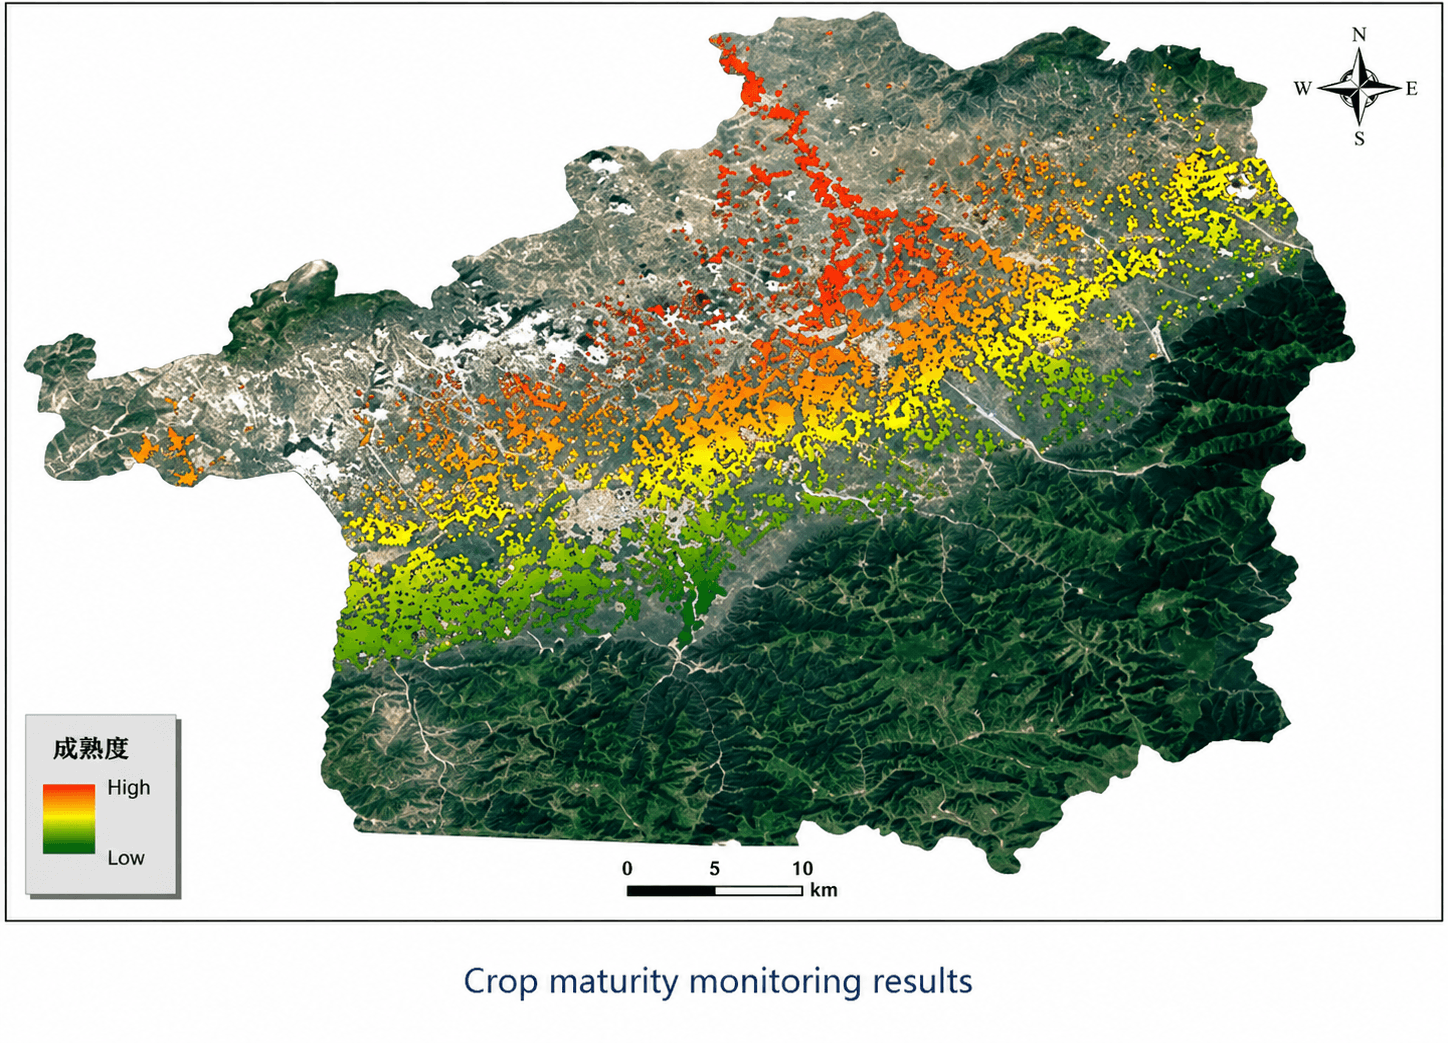
Track crop growth, health and maturity in real time, even in cloudy regions, using SAR radar imagery.
Disaster Response
Get early warnings for meteorological disasters so you can act fast and protect your yield.
Long-Term Benefits
Yield Prediction
Forecast crop yields with up to 85% accuracy at the county level, to support harvest planning and supply chain decisions.
Climate & Sustainability Insights
Track soil quality, carbon sequestration and climate trends across multiple growing seasons.
Subsidy Validation
Give governments verifiable land use data to distribute agricultural subsidies fairly and accurately.
Land Quality Assessment
Measure long-term farmland health and suitability for specific crop rotations.
Sensors, Satellites & Bands
We use specialized sensors to capture data beyond the visible spectrum, essential for identifying different crop signatures.
| Satellite | Resolution | Key Feature for Agriculture |
|---|---|---|
| SuperView-2 (GFDM) | 0.4m | 1+8 band configuration including Red Edge and Yellow for early stress detection |
| SuperView Neo-1 | 0.3m | Daily revisit for tracking rapid changes in crop health |
| GF-6 | 2.0m | Wide 800km swath with a Red Edge band for regional resource monitoring |
| CBERS-04 | Varies | Infrared multispectral scanners ideal for yield estimation and water surveys |
Critical Spectral Bands
Near-Infrared (NIR)
Essential for calculating plant vigor and leaf density through NDVI.
Red Edge (690–770nm)
Highly sensitive to chlorophyll changes and leaf structure, used to spot nutrient deficiencies before they are visible.
Yellow (590–630nm)
Used to detect specific crop stress and mineral patterns.
Customer Input Data & Output Delivery
What You Provide
- Area of Interest: Geographic coordinates or files in KML, SHP or GeoJSON format
- Resolution Choice: 30cm for field-level detail or 2m for regional monitoring
- Timeframe: Archive imagery dating back to 1999, or new satellite tasking for fresh captures
What You Receive
- File Formats: GeoTIFF, SHP, DWG, IMG and UTM
- Data Depth: 16-bit for high fidelity scientific modeling, or 8-bit for visual inspection
- Delivery Method: Secure cloud delivery or physical HDD
Resolution Tier Pricing (USD per km²)
| Resolution Tier | Archive (90+ days old) | New Tasking (Fresh) | Min. Order Size |
|---|---|---|---|
| Super High (30cm) | $20/km² | $30/km² | 25km² (Archive) / 100km² (New) |
| Very High (50cm) | $13/km² | $20/km² | 25km² (Archive) / 100km² (New) |
| High Resolution (80cm) | $5/km² | $8/km² | – |
| Wide Area (2m) | $1/km² | $2/km² | – |
Vegetation Indices for Analysis
We calculate a wide library of indices from multispectral bands to monitor crop conditions remotely.
Normalized Difference Vegetation Index
Measures general plant health and density by comparing near-infrared and red light.
Normalized Difference Red Edge
Uses the Red Edge band to spot early stress and nutrient deficiencies in dense canopies.
Leaf Area Index
Assesses biomass and canopy cover across your fields.
Crop Water Stress Index
Identifies irrigation needs before visible signs of stress appear.
Additional Indices
CCCI for chlorophyll, OSAVI for soil-adjusted analysis, and the Nitrogen Nutrition Index (NNI).
Real-World Results
China's Wheat Belt: Yield Estimation
We deployed multi-temporal satellite imagery and AI to track wheat development across massive regions. By detecting early drought stress and nutrient deficiencies, the system accurately forecasted yields, helping farmers optimize fertilizer use and increase harvest profitability.
Henan Province: Soil Moisture Monitoring
Using high-resolution satellite data, we mapped soil moisture levels at a field scale, daily. This gave farmers real-time alerts to irrigate only when and where needed, avoiding overwatering and boosting healthy crop yields through sustainable water management.
Subsidy Validation: India and Nigeria
We combined Earth observation data with local insights to track crop health and ensure agricultural subsidies were distributed to the correct farmers, based on verified land use.
Buy Satellite Imagery for Crop Classification and AI Analytics
Get instant pricing, choose your resolution tier and start classifying crops with AI powered satellite imagery.